Summary – A top-down review of interesting calls and comments made last week in Treasuries, monetary policy, economics, stocks, bonds & commodities. TACs is our acronym for Tweets, Articles, & Clips –our basic inputs for this article.
Editor’s Note: In this series of articles, we include important or interesting Tweets, Articles, Video Clips with our comments. This is an article that expresses our personal opinions about comments made on Television, Tweeter, and in Print. It is NOT intended to provide any investment advice of any type whatsoever. No one should base any investing decisions or conclusions based on anything written in or inferred from this article. Macro Viewpoints & its affiliates expressly disclaim all liability in respect to actions taken based on any or all of the information in this article. Investing is a serious matter and all investment decisions should only be taken after a detailed discussion with your investment advisor and should be subject to your objectives, suitability requirements and risk tolerance.
1. Yellen, ECB, Economy
This was a week tailor made for the U.S. Dollar. On Tuesday, the Dollar was propelled by a twin engine – ECB’s Benoit Coeure announced that they would front-load their QE in the next two months. That didn’t have a huge impact on longer Bunds but it propelled the Dollar up against the Euro. The strong housing starts were the second engine for Dollar’s rise.
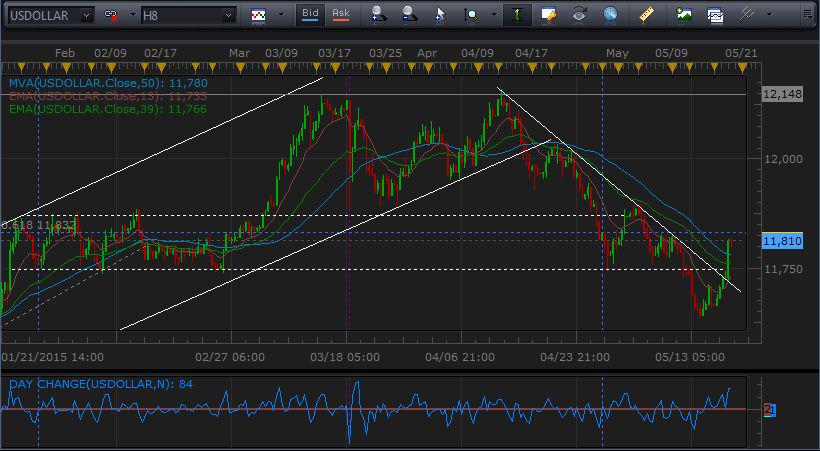
- Tuesday – John Kicklighter @JohnKicklighter – That month-long $USDollar bear trend line broke pretty nicely this past session:
The Fed minutes on Wednesday didn’t hurt the Dollar. On Friday, a hot CPI print and Yellen’s statement that the Fed will tighten sometime this year (with proviso about the economy of course) rallied the Dollar by another 1% to make it a 3% rally for the week for the greenback.
The U.S. Economy looked different too at least to a few:
- Fat Pitch – The upward revision in first quarter GDP growth should not surprise anyone who has been following the US economy. In recent months, there has been a wide variety of positive developments, for example:
- Through April, the average monthly gain in employment during the past year was the highest in more than 15 years
- Employee compensation through the first quarter of 2015 grew at the highest rate in 6 1/2 years.
- Personal consumption (70% of the economy) in the first quarter of 2015 grew at the highest rate in 5 years.
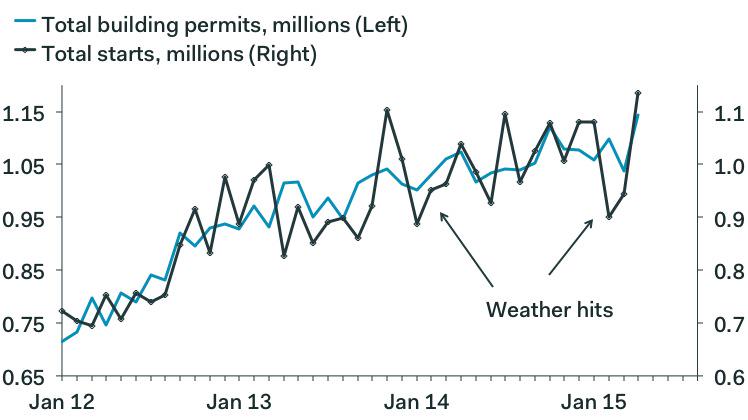
- Housing starts and building permits in April reached at a new 8 year high
and
- Tue – Pantheon Macro @PantheonMacro – “Remarkable,and strong evidence that the winter really was most of the problem in Q1.”@IanShepherdson #HousingStarts
The story for the Dollar could well be the next chart:
- Friday – Bloomberg VisualData @BBGVisualData – The entire global economy. In one chart. http://bloom.bg/1FrXQ1A
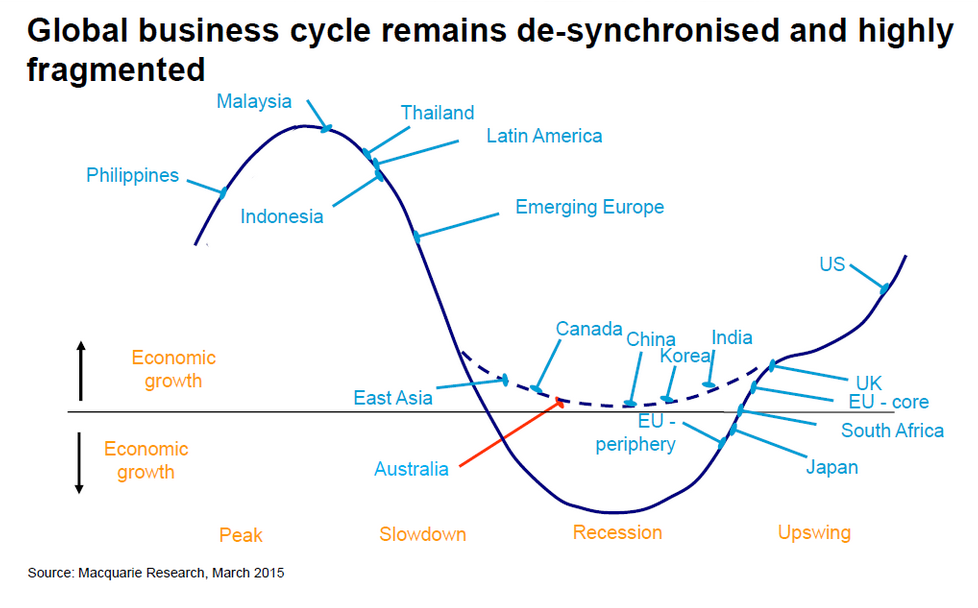
If this chart is correct & if the US economy shows stronger growth in Q2 & Q3, then Rick Santelli’s statement “$ is idling, getting ready for another moonshot” could prove correct. But would such a strong Dollar rally stay the hand of the Fed? The hot PPI and Chair Yellen did persuade the Treasury market at least for one day – the 30-5 year curve flattened by 4-5 bps on Friday accounting for almost all of this week’s flattening. This action is just like 2014 when any hawkish comments from Chair Yellen led to more flattening. It was almost as if the Treasury market was warning the Fed about the risks of tightening in 2014. That changed in 2015. So is Friday is just a one-off or is the Treasury market beginning to warn again about the risks of tightening?
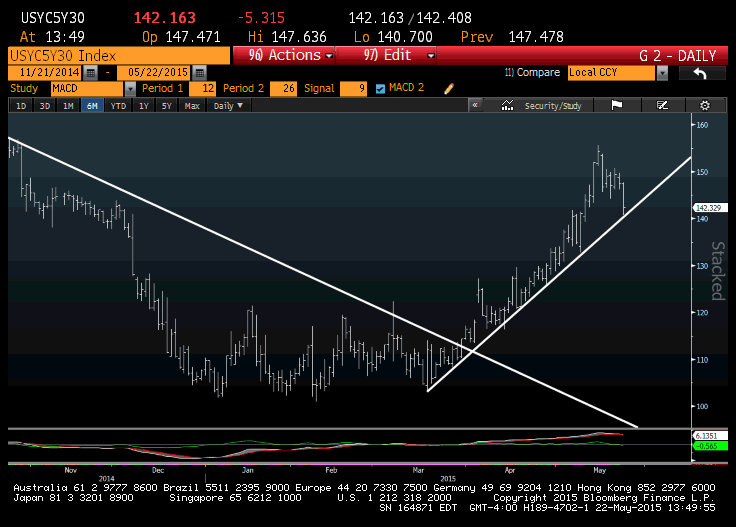
- Friday – Mark Newton @MarkNewtonCMT – $5s/30s curve nearing support after this week’s flattening
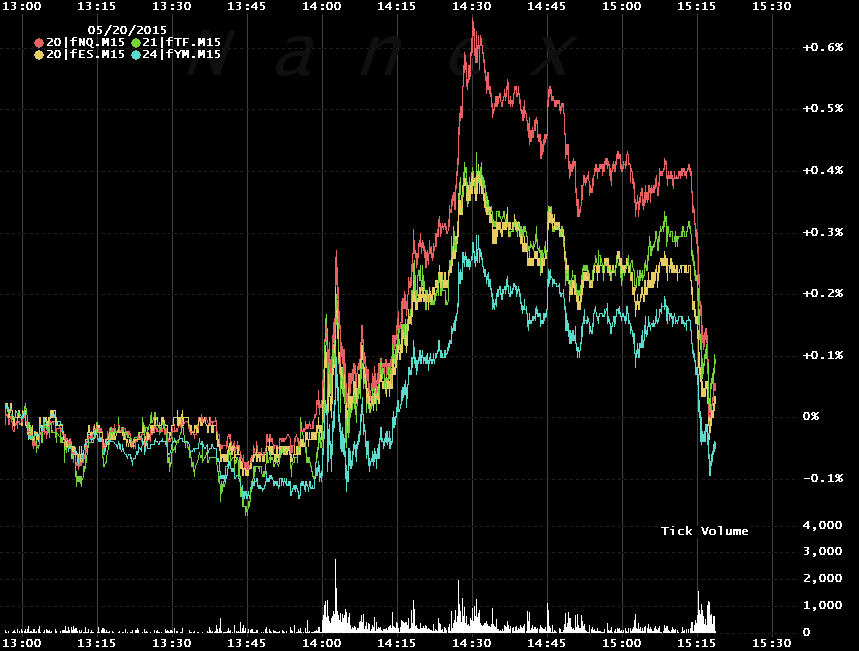
The Treasury market did not react much to the Wednesday’ Fed minutes sort of like the Stock market didn’t react much to Chair Yellen’s statements on Friday. But the stock market reacted strangely to the Fed minutes on Wednesday with first a rally,
- Wed – Cousin_Vinny @Couzin_Vinny – $SPY nice High $TICK +1268 – wtf did she say? LOL. Total lunacy. Bulls killing stops.
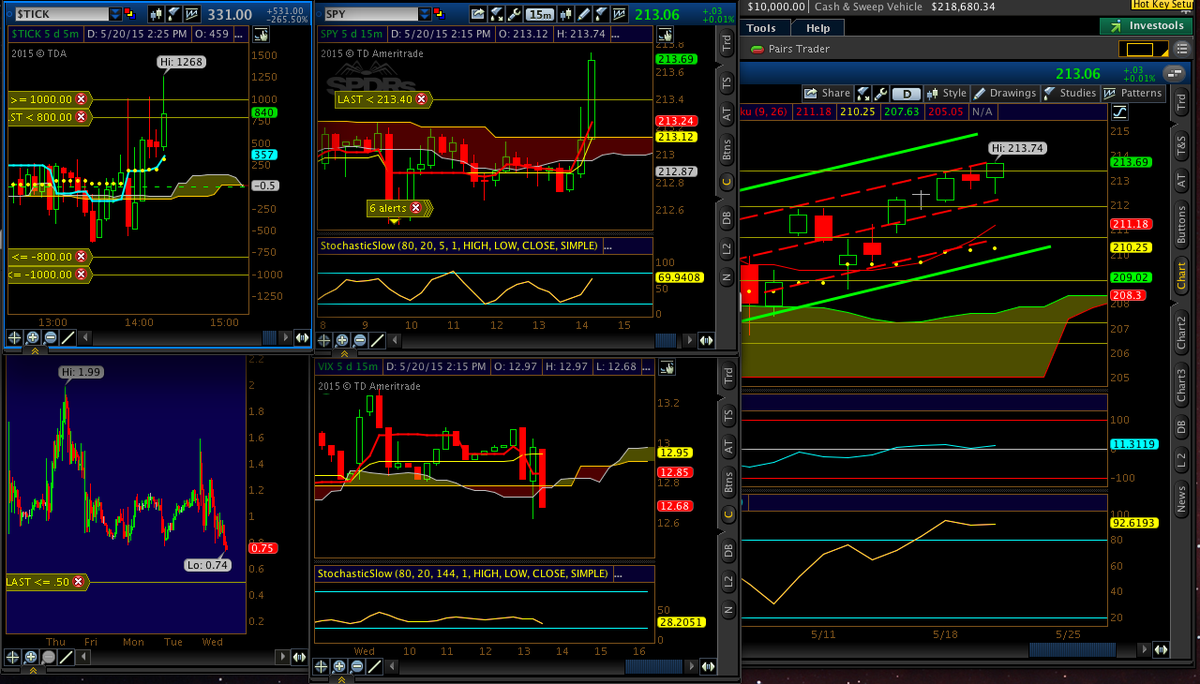
and then,
- Wed – Eric Scott Hunsader @nanexllc – Easy come, easy go. Gains since 2pm (FOMC) disappear:
2. Treasuries
Treasury yields rose every day of this week except for Thursday when they fell hard. The more interesting action came on Thursday & Friday when Treasury yields acted conversely to Bund yields, falling while Bund yields rose on Thursday and rising while Bund yields fell on Friday. This is a reversal of the past few weeks when Bund yields drove the action in Treasury yields.
The mood in Treasuries remains negative and the majority view was voiced by Craig Johnson of Piper Jaffray on CNBC Trading Nation on Friday:
- “The chart on TLT is a clear Sell; we have violated a multi-month support line & … you have made a clear lower high in the most recent price action and also violated the 40-week moving average. If I was long this, I would look to sell it; rates are going higher. Our projection is somewhere around 2.50% – 2.75% yield on the 10-year by year-end”
Well, buy-sale is in the eye of the beholding technician, it seems:
- Tue – J.C. Parets @allstarcharts – gotta buy treasury bonds down here right? Bullish momentum divergence? Right at key support $TLT $ZB_F
- Thu – J.C. Parets @allstarcharts – any out there u think are positioned for interest rates to get slammed over the next month? I don’t think many #RisingRateEnvironment
- Thu – J.C. Parets @allstarcharts – bonds at new post-fed minute highs…..as rates keep telling us that economists will be wrong once again. Some might call this a “trend
We remind readers that Mr. Parets correctly called the recent rise in yields & targeted 2.20% as the level to which 10-yr yield could rise. He then said take profits when the 10-yr yield went decisively past 2.20%. Now he says yields are likely to fall? Will he be right again? At least he is on the side of smart money, smart according to GaveKal as argued in their article Smart Money Most Committed to Falling Rates Since The Last Peak in Long Bond Yields:
- “Commercial traders (AKA the smart money) has massively flip flopped their positioning since the end of last year with respect to the long bond. In aggregate, commercial traders have moved from a net short position (benefiting when rates rise) of about 50K derivative contracts to a net long position (benefiting when rates fall) of 22K contracts. This is a delta of about 72K contracts in about six months. Aside from the rapid change in positioning, the commercial traders net long position in derivatives is the largest since the last peak in rates at the beginning of 2014, which led to a 1.8% decline in rates over the course of a year”

Tom McClellan presented an interesting correlation on Thursday in his article Crude Oil Leads Bond Yields:
- “This week’s example shows how crude oil futures prices tend to lead T-Bond interest rates by about 3 weeks. It is not a perfect correlation, just a very good one. Crude oil prices have rebounded from a low in the $40s, and after a lag we have seen the same rebound occurring in the Treasury Yield Index (TYX). Crude oil prices have leveled out over the past 3 weeks, and so now we can expect a similar response in interest rates”
- “The upshot is that if crude oil prices are really topping out now, then so should interest rates after the 3-week lag period. And if you want to know what mortgage rates are going to do in the future, watch what oil prices are doing now. And if oil prices should resume their rise later this year, then we should expect a corresponding rise in long term T-Bond interest rates“
Being simple folks, we follow the one metric that has worked for us for a decade – a decisive break of the 200-day moving average of TLT, 30-year & 10-year yields. In any case, much of what we see in the next 30 days will depend on the next payroll report and the Fed statement/Presser on June 17.
3. Volatility
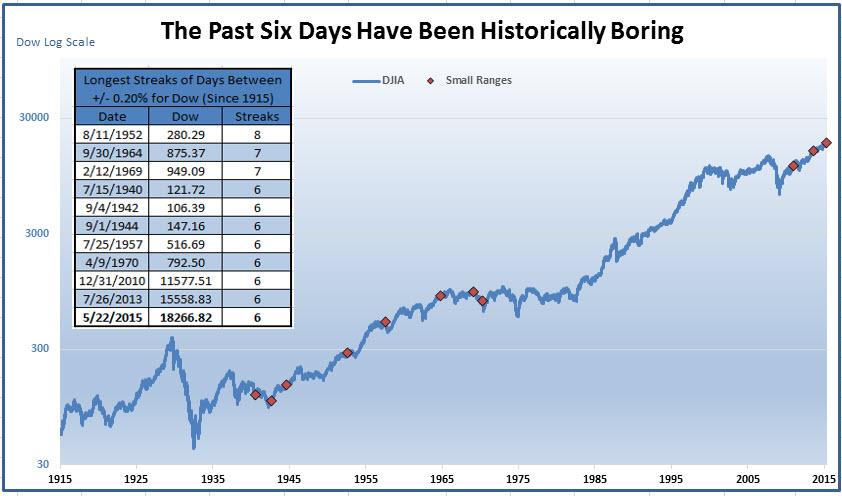
- Friday – Ryan Detrick, CMT @RyanDetrick – Think the past 6 days have been boring? Turns out, it is one of most boring for $DJIA in 100 years! $DIA
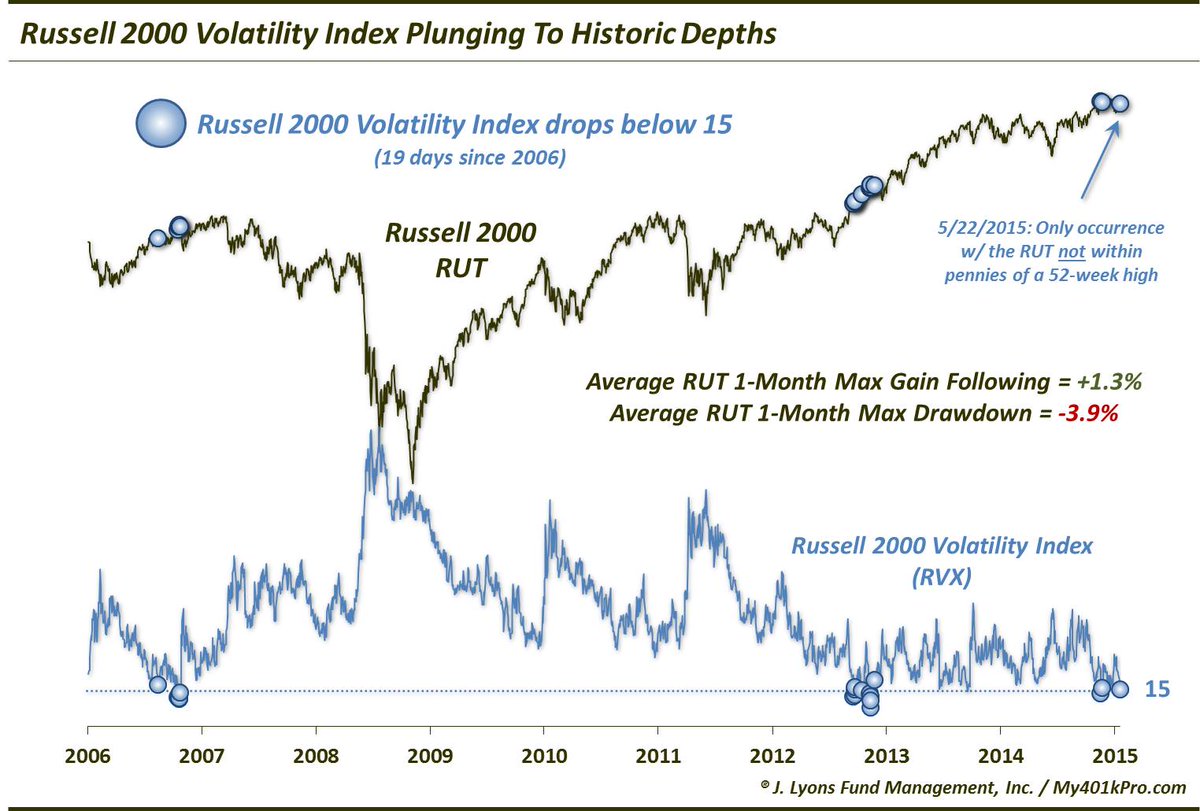
- Friday – Dana Lyons @JLyonsFundMgmt – ChOTD-5/22/15 Russell 2000 Volatility Index Plunges To Historic Depths $IWM $RUT $RVX
We are tired of waiting for the big move such low volatility often brings. But that wait might be coming to an end, at least according to one observer:
- Friday – James Goode @OntheMoneyUK – Don’t be lulled to sleep by today’s $SPX price action – big moves coming after the weekend. Gap risk high. Enjoy the holiday!
Jonathan Krinsky of MKM Partners told CNBC Futures Now that a down move is coming in a few weeks:
- Since 1896 there’s been 19 times that the Dow has traded in a range of less than 10 percent high to low,” said Krinsky, chief market technician at MKM Partners. “Thirteen of those 19 times the Dow went on to gains in the second half of the year, and only three times of those 19, the Dow closed negative.” The average year-to-date return of those 19 occurrences is positive 8.25 percent.
- Krinsky added that there could be some increased selling pressure coming in the next few weeks, as seasonally the beginning of summer tends to be a tough time for the market.
- “Everyone talks about sell in May and go away, but June is actually the worst month for the market over the last 10 years,” he said. “If we do see any weakness it could happen [in the next few weeks], but that would probably set up a buying opportunity over the back half of the year.”
Is VIX broken, asked Carter Worth, resident technician at CNBC Options Action. Does the next chart suggest that?
- Friday – Northy @NorthmanTrader – $SPY versus $VIX this week

We are simple folk and we have noticed that when they begin saying a well-followed indicator is broken, it tends to spring back to health. That seems to the bet of a few traders who have been buying “tremendous amount” of June VIX 17/18/20 strike calls, according to Brian Stutland of CNBC Options Action. That would be a 50% move in the next few weeks.
4. Stock Market
If you don’t think VIX is broken, then you would have to describe the above SPX-VIX chart as an example of divergence. This is an overused word in market commentary. But are such divergences actionable? Dana Lyons published a series of divergences this week, a series that we would describe as must-read. What is the divergence he calls “grand-daddy” of divergences:
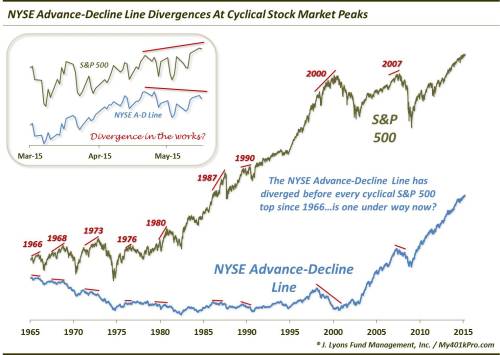
- “But the real story lies in the indicator’s track record regarding divergences. There is a reason why we call it the grand-daddy of divergences and a reason why it is perhaps the only potential source of divergences that we monitor”
- “The NYSE Advance-Decline Line has negatively diverged before every cyclical top in the S&P 500 since 1966. … While the magnitude and the lead-time have varied, every single major cyclical top since 1966 has occurred with the A-D Line below its prior peak. Now, these divergences have typically spanned periods longer than the 1-month that describes our current situation. The “norm” is for the market to sell off for several months before rallying back to make a higher high – and ultimate top – while the NYSE A-D Line simultaneously fails to record a higher high”
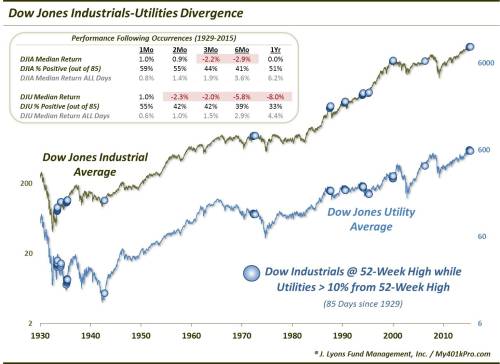
The second divergence discussed by Dana Lyons is the one between the Dow & Utilities.
- As the table illustrates, this is one divergence that has earned the right to be considered a potential red flag. … Accounting for the awful returns is the proximity of several of these divergences near major tops. These include 1972, 1987, 1990, 1993-94 and 1999-2000. In fact, there have been hardly any false signals in the past 70 years in this indicator. … These divergences have been especially accurate over the past 70 years in marking significant market tops. Therefore, this appears to be a legitimate divergence concern
But what about the very near-term?
- Wed – Jason Goepfert @sentimentrader – The last time $SPY was rejected from a new high on back-to-back days was Sept 3. Tended to be neg in short-term.

Lest you think everyone is negative:
- Tue – Urban Carmel @ukarlewitz – $SPY: 2014 vs 2015. Breakout last yr was May 23. Gained ~5% in next month. Breadth and sentiment similar to now
And now the most emotional & committed bullish trader, the one man who matches well with Rick Santelli to deliver a useful & fun TV experience:
- “When people go back and do hindsight analysis they always wonder where the breakout is. This is the breakout. This is the ‘buy in May’ scenario that we were all taking about and more than likely is going to last to the end of the year.”
.Who but Jack Bouroudjian can be so confidently explicit on TV?
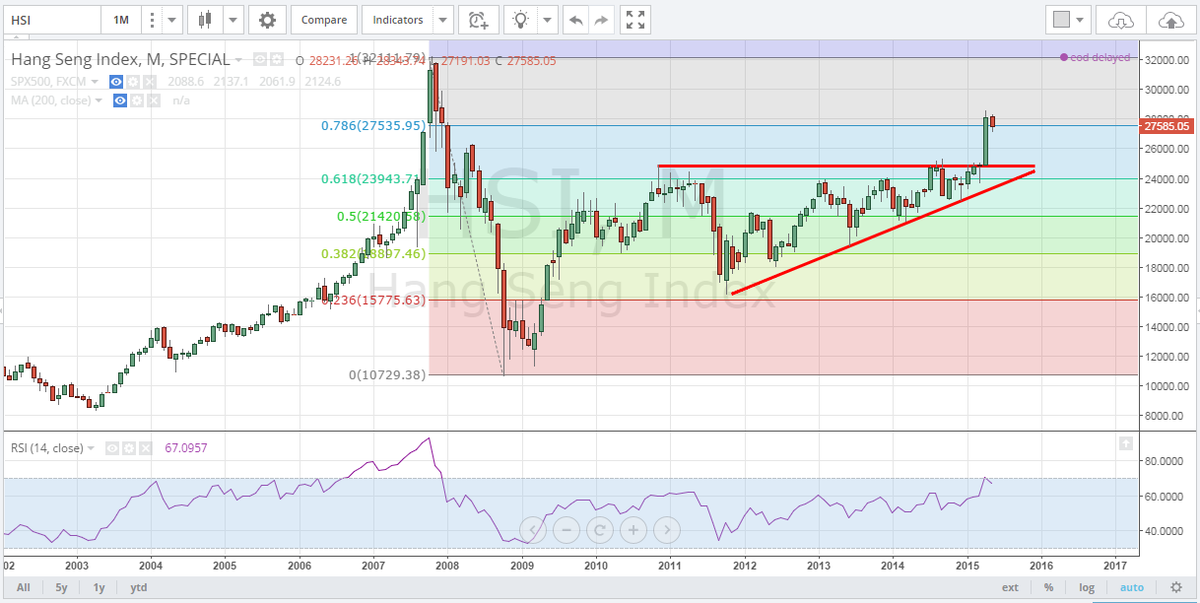
No segment on stocks can end without at least one comment on Hong Kong/China:
- Blake Morrow @PipCzar – “Hang Sang Stock Market (HSI) Poised to Pullback?” New Blog Post http://www.pipczar.com/2015/05/21/hang-sang-stock-market-hsi-poised-to-pullback/ … $EWH —-> (see all charts)
5. Oil
The Dollar rallied by 3% this week and, behold, Oil fell by 2%.
- Wed – John LaForge @Phomax – Short #oil moves still largely about USD (chart), even with global supply/demand picture balancing. @NDR_Research

But what about supply-demand?
- John LaForge @Phomax – May 19 – Global #oil picture close to balanced. Typically leads to flat/rising oil prices. @NDR_Research


6. Gold
Gold, Silver & Gold Miners were all down this week. As we have said before, we have no clue how Gold trades or why it trades the way it does. Neither do many others as the tweets-charts below suggest. The tweets on Monday were bullish and the tweets on Friday were bearish. Is that because the Dollar had rallied by 3% by Friday? Or are the tweets simply chasing prices? Jeff Gundlach is bullish on Gold as he has stated on different occasions on different platforms and he says Dollar will go higher. And Ray Dalio says we all should own some Gold.
On the other hand,
- Thursday – J.C. Parets @allstarcharts – this might be the most vulnerable ETF that I look at. I think this could be about to get destroyed $GDX
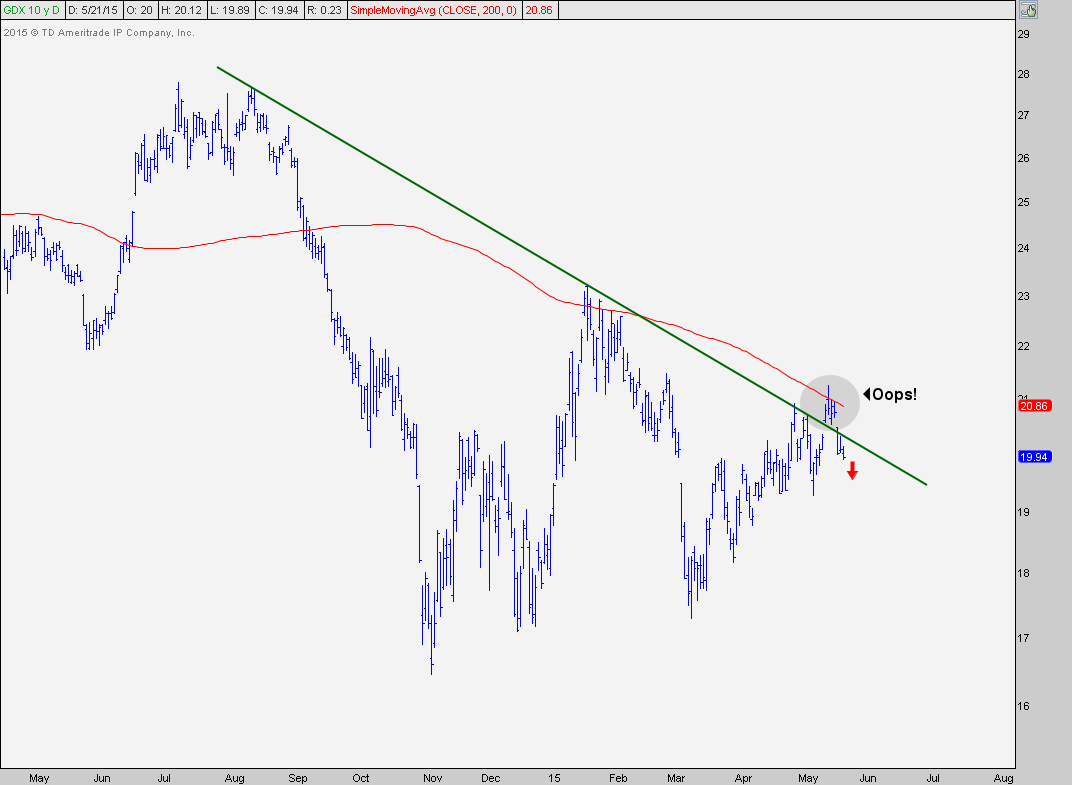
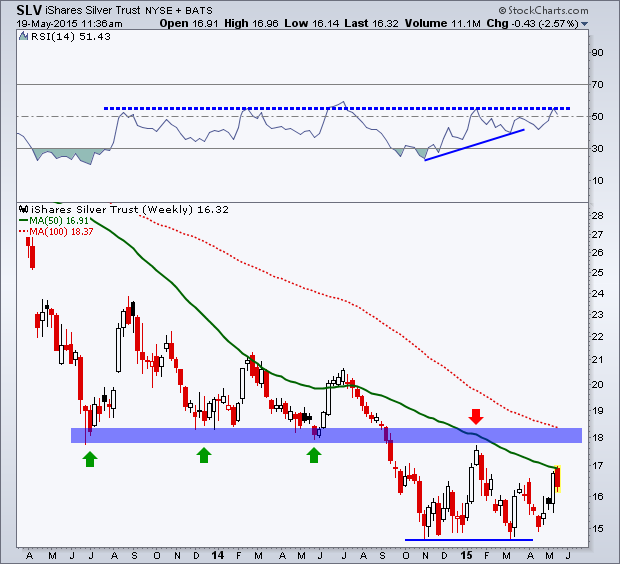
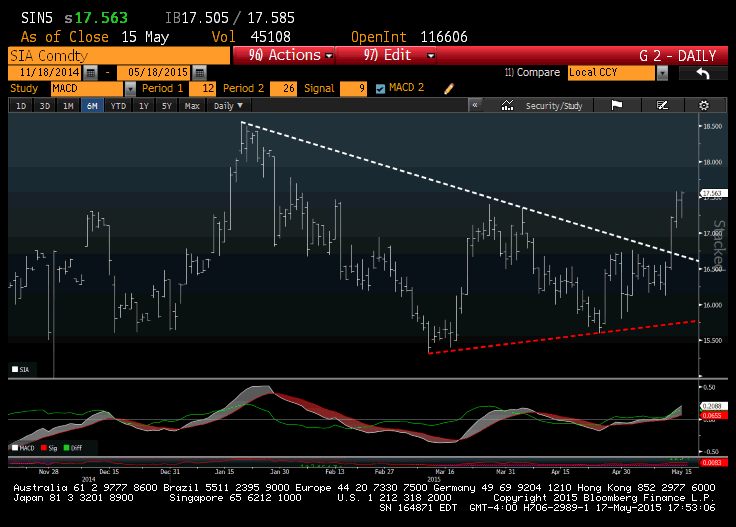
We recall that last year J.C. Parets made a similar call about Silver when it was trading around 18-19 and put a $15 target. That call worked and Silver did fall hard to near his target. Speaking of Silver,
- Andrew Thrasher, CMT @AndrewThrasher – Silver getting rejected at 50-week Moving Average and resistance in momentum $SLV
On the other hand,
- Mon – Mark Newton @MarkNewtonCMT – Silvers minor breakout above 3 mth trend argues for higher prices up to 18.50 in ST- $AGK ,$SI_F UP .72% this am
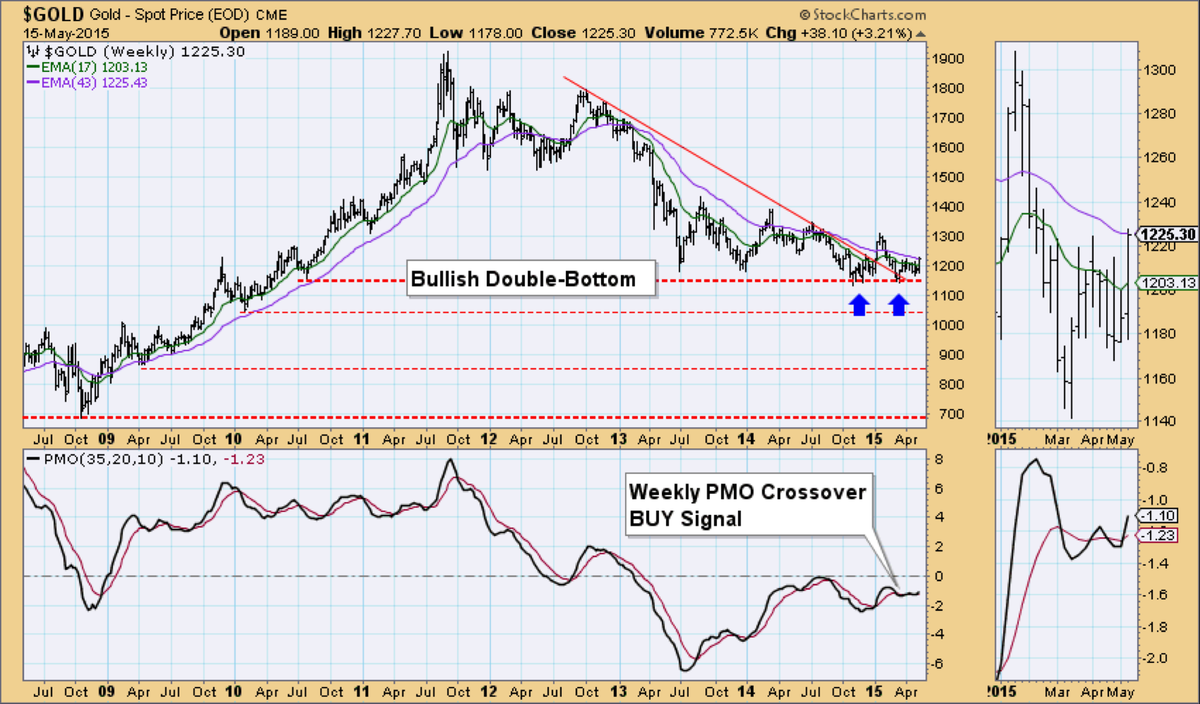
- Mon – Becky Hiu @beckyhiu – “@jessefelder: Gold is looking bullish http://stks.co/q25Gl $GLD”
7. Interesting Laws.
Just about when we think this handle has run out of crazy laws to report, we see:
- Interesting Laws @InterestingLaws – The law required all women to prostitute themselves prior to marriage to gain sexual experience. (Tibet)
Send your feedback to [email protected] Or @MacroViewpoints on Twitter