Summary – A top-down review of interesting calls and comments made last week in Treasuries, monetary policy, economics, stocks, bonds & commodities. TACs is our acronym for Tweets, Articles, & Clips –our basic inputs for this article.
Editor’s Note: In this series of articles, we include important or interesting Tweets, Articles, Video Clips with our comments. This is an article that expresses our personal opinions about comments made on Television, Tweeter, and in Print. It is NOT intended to provide any investment advice of any type whatsoever. No one should base any investing decisions or conclusions based on anything written in or inferred from this article. Macro Viewpoints & its affiliates expressly disclaim all liability in respect to actions taken based on any or all of the information in this article. Investing is a serious matter and all investment decisions should only be taken after a detailed discussion with your investment advisor and should be subject to your objectives, suitability requirements and risk tolerance.
1. Data Dependent or just sick of being at Zero?
We are so fed up with this Fed. They are doing to the world exactly what Bernanke did in 2013 – these constant attempts to massage their message are creating needless damage. Ask yourselves – if a public company issued guidance in this manner, wouldn’t that company face mammoth class action lawsuits from investors?
The Fed’s statement preserved their tightening option for September. This was evident from the flattening of the yield curve, rise in the Dollar and the debacle in commodities on Thursday. The markets clearly believed that they were getting ready to tighten in September and so began readying for it.
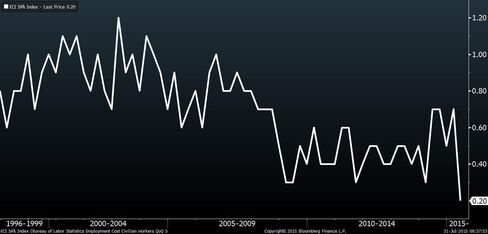
Then came the thud – thud of the worst ECI reading since 1982, the year they began keeping the score. Guess what happened to expectations of the Fed ease – the 2-year yield fell by 7 bps and the Euro spiked against the Dollar.
The shock of the number was that great and just as great was the judgement about the Fed’s readiness to tighten:
- Lawrence McDonald ?@Convertbond – Rate Hike? Just another disinflation data point point pushing the Fed out to Dec – March
- Jim Rickards ?@JamesGRickards – Most important gauge on Yellen dashboard is wages. That’s where both parts of dual mandate converge. It’s flatlining: http://bloom.bg/1OSXKTx
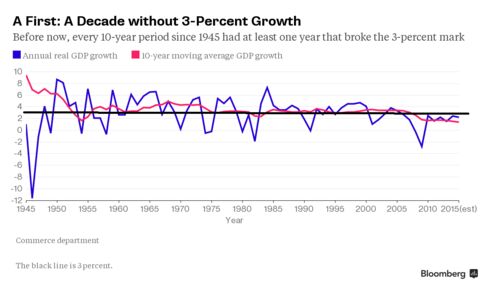
We are looking at a lost decade of growth, as Bloomberg wrote:
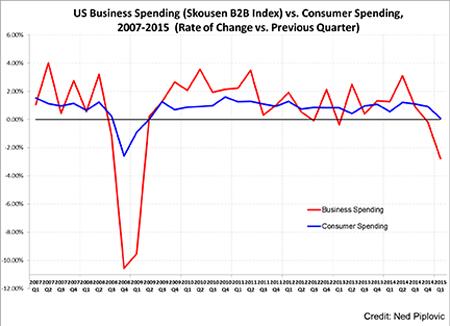
The business sector seems even worse than the consumer sector:
- Lance Roberts ?@LanceRoberts – #DrMarkSkousen discusses why B2B data is suggesting the economy is even weaker than headlines. http://streettalklive.com/index.php/blog.html?id=2832 …
The tweet below from Thursday looked prescient on Friday morning:
- Thursday – fred hickey ?@htsfhickey – Poor Q3 guidance from techs prove no 2nd half recovery-yet that’s assumption of stock bulls. GLOBAL slowdown.Sept/Oct moment of truth ahead
Read what Alice Andres-Frantz told Rick Santelli about Chicago PMI number:
- overwhelmingly respondents are saying business is slow to flat
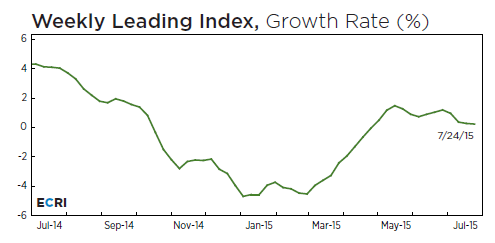
ECRI also tweeted a downtick:
- Lakshman Achuthan ?@businesscycle – U.S. Weekly Leading Index ticks down to 133.0, growth rate slips to 0.2%. #economy https://goo.gl/zxblYu .
We don’t think this level of weakness will stop the Fed. So why don’t they just come out and tighten by 25 bps already? Because they are deeply afraid of looking foolish as people begin clamoring for them to reduce rates again. So this mess could end in the worst way possible – they wait to tighten until year-end and tighten just as the economic trajectory starts falling. This is why we wanted Druckenmiller or Gross to get the Fed Chair – they would have tightened by 25 bps immediately after the strong March report or the strong May report.
2. Dollar
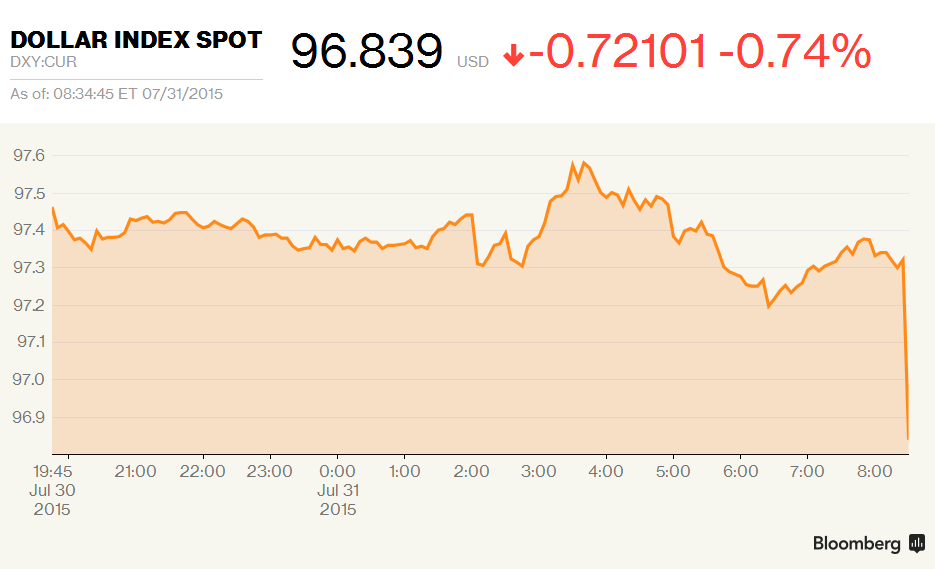
How immediately did the ECI number move the US Dollar?
- Bloomberg Markets ?@markets – Dollar spot index drops on ECI surprise http://www.bloomberg.com/news/articles/2015-07-31/worker-pay-in-u-s-rises-0-2-smallest-gain-in-records-to-1982
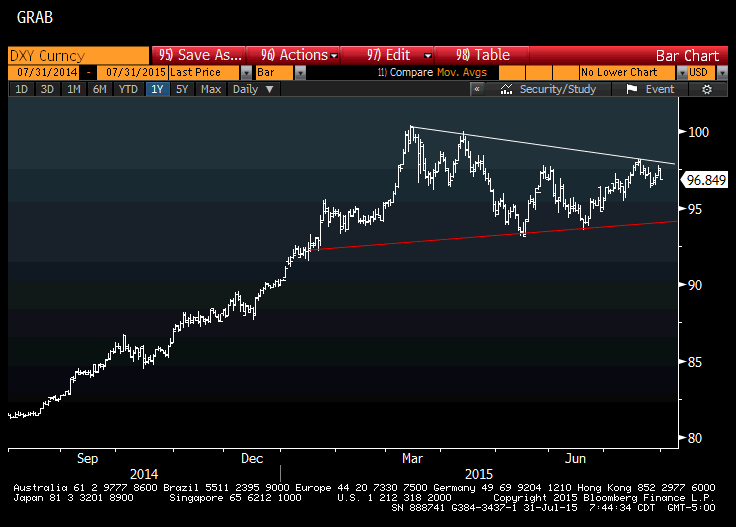
It made Raoul Pal backtrack from his earlier comments:
- Raoul Pal ?@RaoulGMI – There is a risk that DXY pulls back into the wedge before its major break higher. Let’s see…
What were his comments the day before on CNBC FM?
- “$ will go up for another few years from here; by end of this year, I am expecting Dollar up 20% – meaning another 10-15% from here; next year something similar; so I think $ will go a long way; for example against the Euro which will go may be down to 75 cents;”
- “I just look at what is happening to global export growth because of the global economic slowdown going on everywhere … what we are seeing that as the Dollar gets stronger, global growth keeps falling, global export growth keeps falling, that means generally commodity prices should fall as well “
Pal also commented on the consensus enthusiasm for Germany-Europe:
- “Germany is at risk of leading Europe into a recession which is very much against everyone else’s opinion; US is weak; first half GDP weakest first half since the recession; Europe lags the US; that won’t help Germany at all because US is buying less from Germany ; that doesn’t help”
3. Emerging Markets
Remember what Bernanke’s Taper Tantrum did to Emerging Markets in 2013? Is Chair Yellen’s transparency doing so again in 2015?
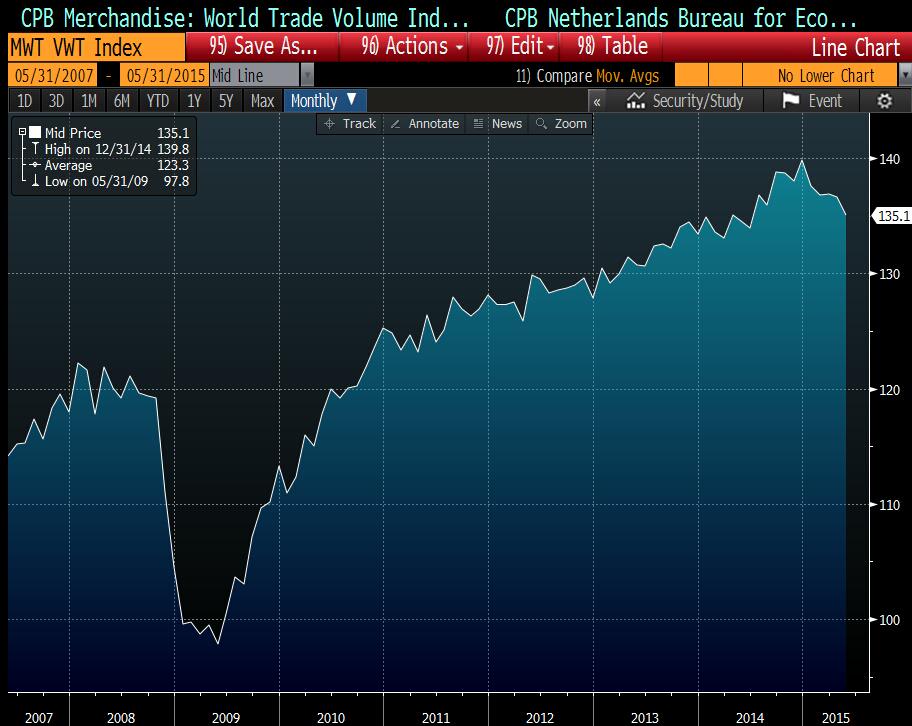
- jeroen blokland ?@jsblokland – More bad news for emerging markets (and everybody else.) World trade is falling. via @swaptions
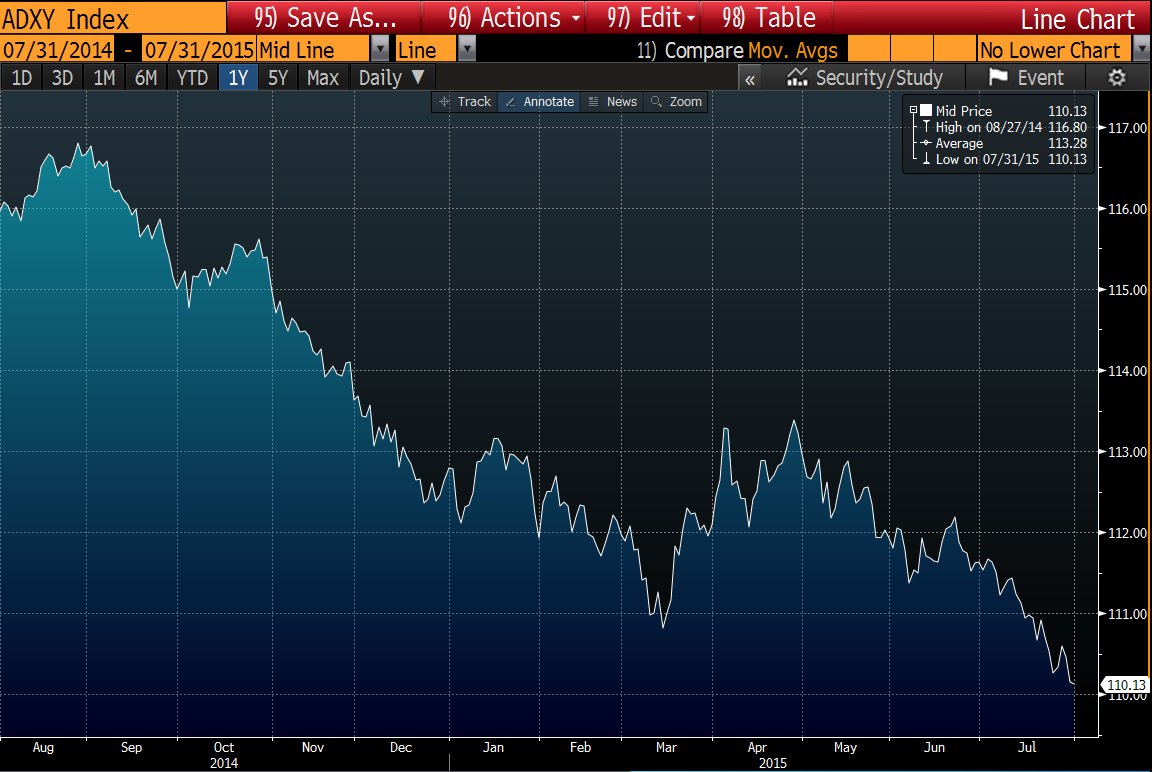
When you say EM, don’t you really mean EM currencies?
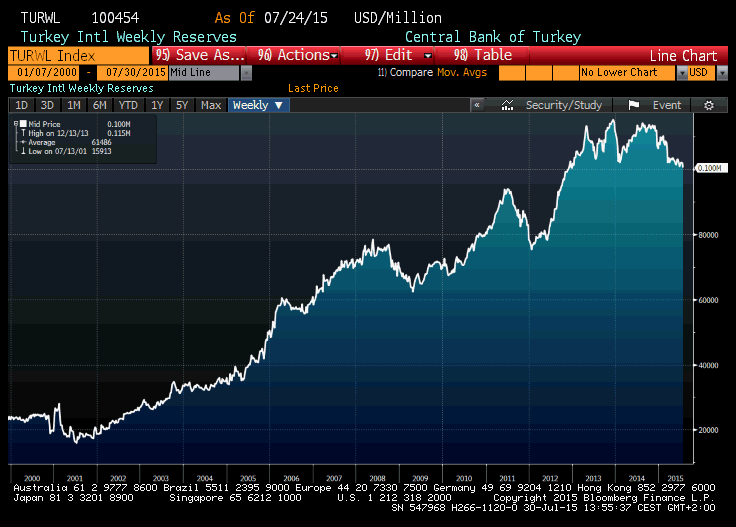
- Thursday – Holger Zschaepitz ?@Schuldensuehner – Next EM crisis in the making? #Turkey Central Bank FX reserves drop to lowest in 2.5 years
- Lucy Meakin ?@lucy_meakin – Asian currencies are headed for their steepest drop in 10 months http://bloom.bg/1h9GZIl via @business #FX
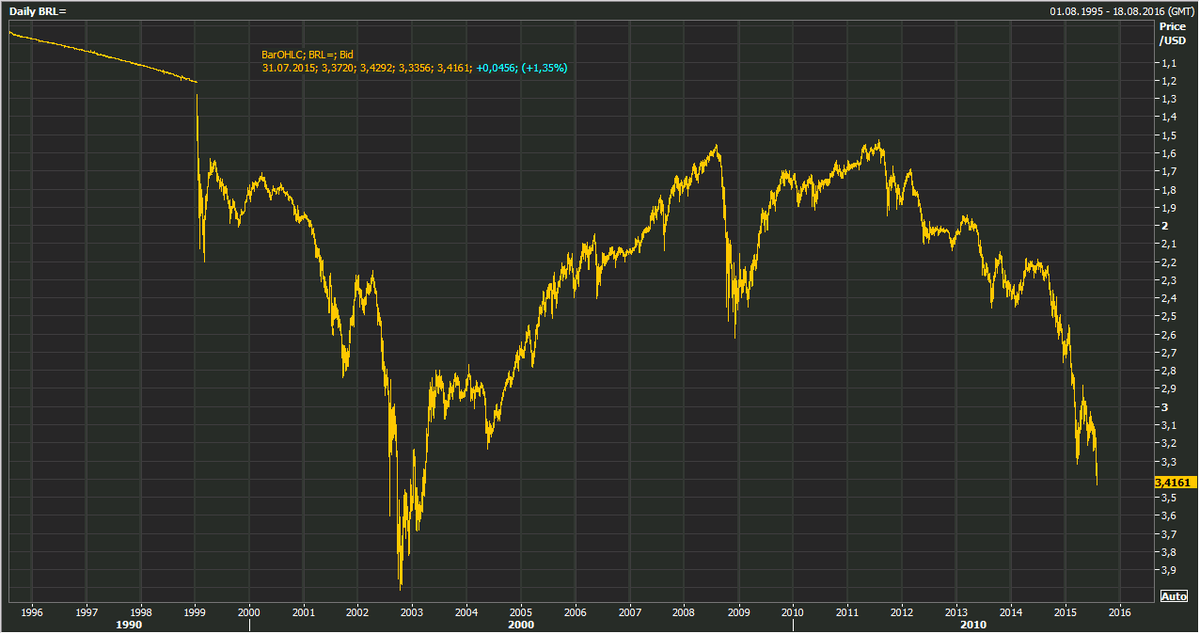
Can any discussion about EM be complete without Brazil?
- Holger Zschaepitz @Schuldensuehner – #Brazil Real extends worst monthly drop since march on fiscal woe. http://bloom.bg/1fOJ23x
If EM currencies are in trouble, can EM corporates remain unscathed?
- A Evans-Pritchard ?@AmbroseEP – Either EM sovereign debt must rally, or corporate debt must take a bath. Divergence not sustainable. (RBS latest)

With EM currencies & EM debt in this state, can EM equities rally vs. DM equities?
- Greg Harmon, CMT ?@harmongreg – US Markets Smiling at Emerging Markets – Dragonfly Capital http://stks.co/t2bvG $SPY $EEM
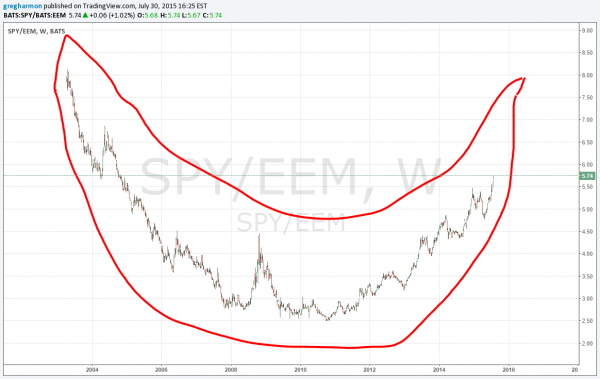
Harmon then writes:
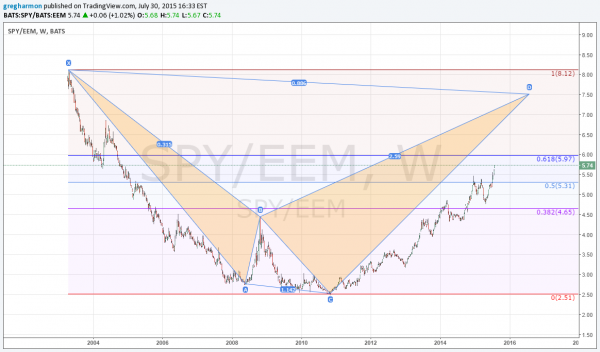
- “There are three important patterns on this chart and all suggest that smile will continue to grow. The first is that rounded bottom and reversal noted earlier. The second is the Fibonacci retracement ratios. The long leg down from 2003 to the base form 2009 to 2010 has now been retraced over 50%. Having moved far away from that 50% line expect the next potential area to find resistance at the 61.8% retracement up at 5.97.”
- “Third is a Shark harmonic pattern that would target a move to 7.48 in the ratio or 8.85 if that does not stop it. Either way it is well above the current level. The 3 patterns together add some confidence to the continuation and a growing smile in the US at the expense of Emerging markets.”
4. China
Raoul Pal on China in his CNBC FM comments:
- “China is having very serious problems with a strong currency because it is pegged to the Dollar; China’s economy is a mess right now; that makes commodities weaker; we know the economy is bad; China is still a wild card; it could create a lot more problems than people are imagining“
If you think Raoul Pal is negative, you should read Scott Minerd in his China – 1987 or 1929 article. Since the 1987 scenario is the less scary case, we fast forward to Chinese version of 1929:
- “The alternative scenario to 1987 is 1929, the course upon which China currently seems set. Chinese policymakers’ unorthodox attempts to bridle the runaway market resemble the policy response of the United States in 1929, which basically relied on investor groups to purchase large blocks of stock in the hope of propping up equity markets. As in 1929, this type of market intervention will do nothing to solve the fundamental problem in China’s equity markets today. The unresolved issue is that prices have detached from fundamental value due to a wave of debt-fueled retail investor mania.”
- “This too is analogous with 1929. China’s sky-high margin-debt-to-total-market-capitalization ratio is estimated to be near 10 percent. In reality, it is likely even higher when you factor in margin lending by China’s shadow banking system. By comparison, U.S. margin debt is currently less than 3 percent of total market cap, but in 1929, margin debt in the United States reached a high of 12 percent of total market capitalization prior to the stock market’s collapse.”
Why can’t China devalue its currency?
- “Chinese policymakers will do anything they can to avoid devaluation ahead of the International Monetary Fund’s November decision on the RMB’s special drawing rights (SDR) status. China may not have that long to act if it is to avoid a full-blown disaster. In the meantime, my best estimate is that the PBOC will be forced to increase sales of Treasury securities to prop up the RMB as more capital flows out of China. I would expect up to $300–500 million of Treasury liquidation may be necessary to hold the line on RMB depreciation in the coming months.”
What about the short term in the Shanghai Stock market? Tom Demark on CNBC FM 1/2 on Tuesday, July 28:
- “we are pretty confident it should move down to 3200, the die has been cast in that regard; we have to reassess the market once it reaches 3200″
5. US Treasuries
How would a transition to China’s 1929 affect US Treasuries? Minerd writes:
- “The transitory period that lies ahead, however, promises to be rocky for all global markets. Consider how much Greece’s $300 billion debt crisis roiled investors (a figure dwarfed by the $3 trillion lost by Chinese equities markets since June). Under any circumstances investors should expect to see increased market volatility with a growing safe-haven bid for Treasury securities, which I expect will push the U.S. 10-year note to 2 percent or lower in the near term. Renewed downward pressure on interest rates will increase market volatility and is likely to adversely affect credit spreads.”
Frankly, Minerd is nuts. If the markets really think a Chinese 1929 is a possibility, the US 10-year yield won’t stop at 2%; it will fall to new historical lows.
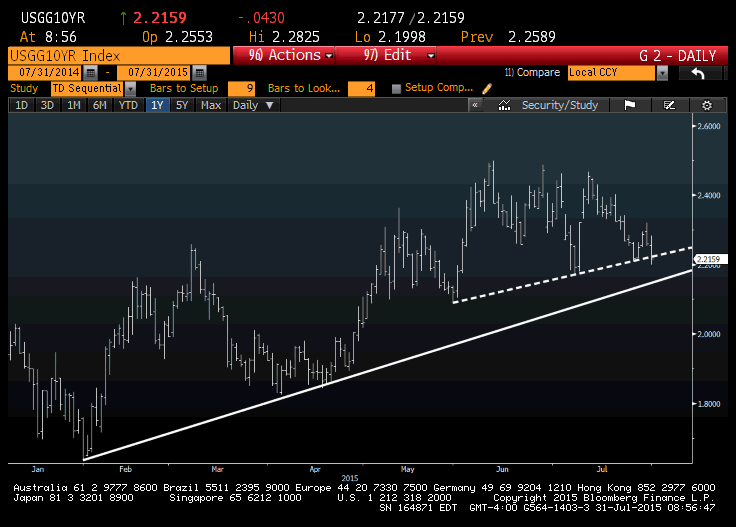
The 10-year yield closed at 2.1872%, below the level highlighted below:
- Mark Newton ?@MarkNewtonCMT – Daily $TNX growing a bit more negative,challenging Trendline which held earlier in the week.Structurally 2.208 impt
Treasuries have rallied for 3 straight weeks. Does that say sell or buy?
- Friday – raoul Pal – Raoul Pal ?@RaoulGMI – Well, another round of new highs for the $ versus a range of ccy’s . Next up it looks like $TLT is due a breakout.
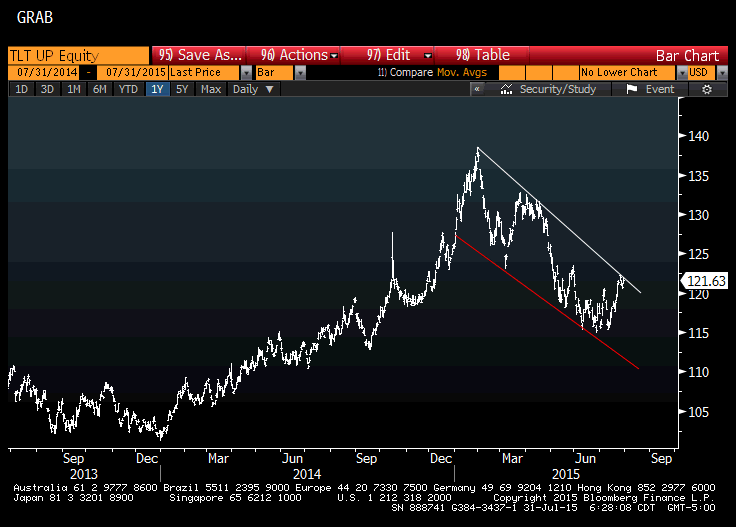
ACG Analytics came in on Friday afternoon and advised selling a portion of TLT to lock in profits from the big rally. JCParets sounded similar caution on BTV’s What’d You Miss? on Thursday:
- “downtrend line from highs comes down to $123; I would be fading it there tactically; then going forward, what we want to see if TLT can take out that 123 level & start trading 124-125, that would signal to us that market thinks interest rates are going to get slammed”
We are simple folks and we find that TLT’s breakout from 200-day has been very bullish in the past. And guess where the 200-day of TLT is – $124.39. So that’s a confirmation to us of Paret’s levels.
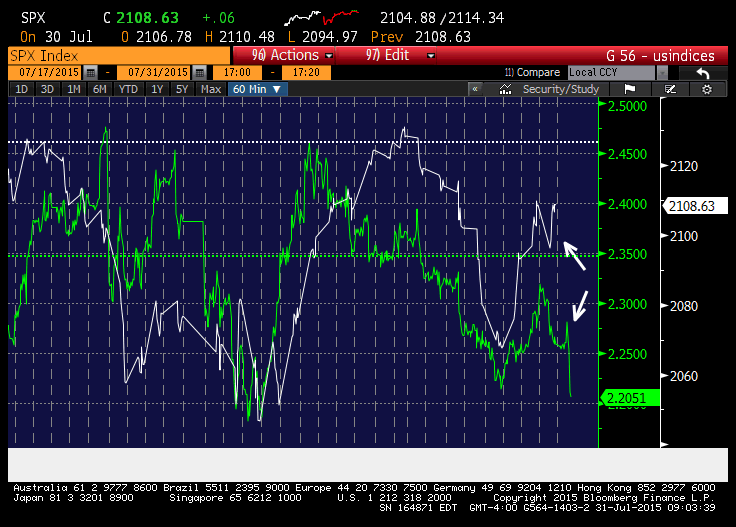
- Mark Newton ?@MarkNewtonCMT – We’ve seen a bit of a decoupling of late w how Yields have dropped, while Equities have remained high-Corrltn .31 YTD
6. US Equities
The above has been so negative that we must have a bullish article on that one asset class that has maintained its resilience. That comes from Ryan Detrick’s article Are Investors Really Panicking In A Historically Boring Market?
- “The bottom line is less and less stocks are going up, which has marked every major top throughout history. Before you go out and sell everything, here’s the other side to the argument.”
- “Those in the neutral camp have been in the majority most of this year. My take is neutral is the new bearish, as saying you are bearish has been so wrong for so long. Safer to just be neutral. Then again, if they are truly neutral, they’ve been very right this year. In fact, this came in at 38% this week – the first drop beneath 40% in a record 16 weeks. I find it encouraging that we are seeing some of those that are neutral finally getting the courage to turn bearish. Could be what is needed to break us out of this range to the upside.”
- “Here’s my favorite chart from the AAII data. The last time we saw bulls this low for an extended period of time was the March 2009 lows. The time before that was March 2003. Those were the best two times to buy going back 16 years“
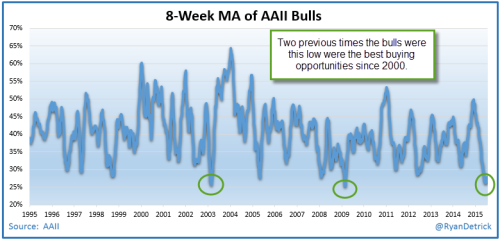
- “Could bode well for a surprise rally the next five months of 2015“
And Tom DeMark on CNBC FM 1/2 this Tuesday:
- “we think there is a good rally coming in the US market possibly to new highs on some indices“;
On the other hand,
- Jason Goepfert ?@sentimentrader – It’s official – mutual funds are now holding the lowest amount of cash reserves in history.

In his article, The Summation of All Fears, Dana Lyons discusses a “negative breadth signal” that has “an ominous long-term track record“:
- “That rare combination took effect as of today’s close. Specifically, each of the Summation Indexes were below 0 while the S&P 500 was within 1.5% of its 52-week high. This was just the 59th such occurrence since 1970.”
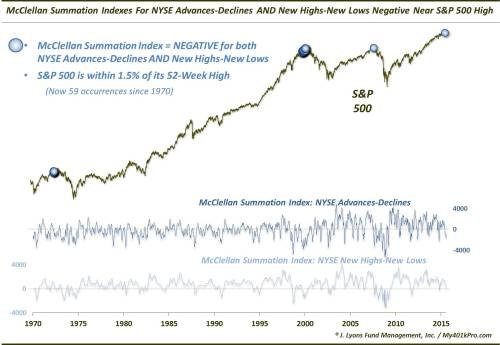
“The 59 occurrences all took place in 4 distinct periods, though most of them happened within 2 clusters:
- August 1972 (13)
- November 1999-March 2000 (44)
- September 2007 (1)
- July 2015 (1)
Here are the performance statistics following the 58 prior examples:”
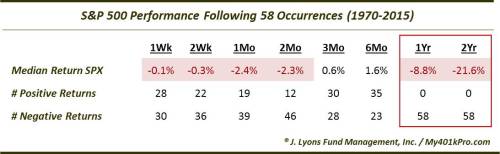
- “The S&P 500 was consistently weak out to 2 months. After that, more than half of the occurrences turned in gains after 3 and 6 months. Beyond that, it was a different story. Of the 58 prior occurrences, not one single time did the S&P 500 show a gain 1 year later – or even 2 years later.”
- “In our view, this represents a deterioration in market breadth similar to those which occurred in the lead-up to cyclical tops in 1973, 2000 and 2007. … the longer-term outlook for stocks appears to be quite ominous.”
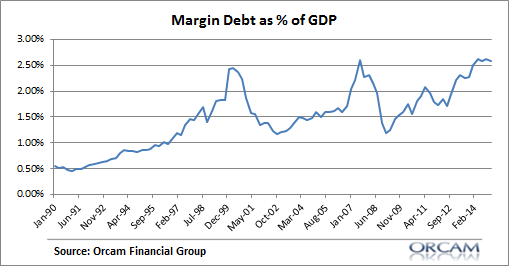
Another tweet about 2000 & 2007:
- Holger Zschaepitz ?@Schuldensuehner – China Omen? US Margin Debt as % of GDP is back at levels that we saw back when mkts peaked in 2000 & 2007 (via Orcam)
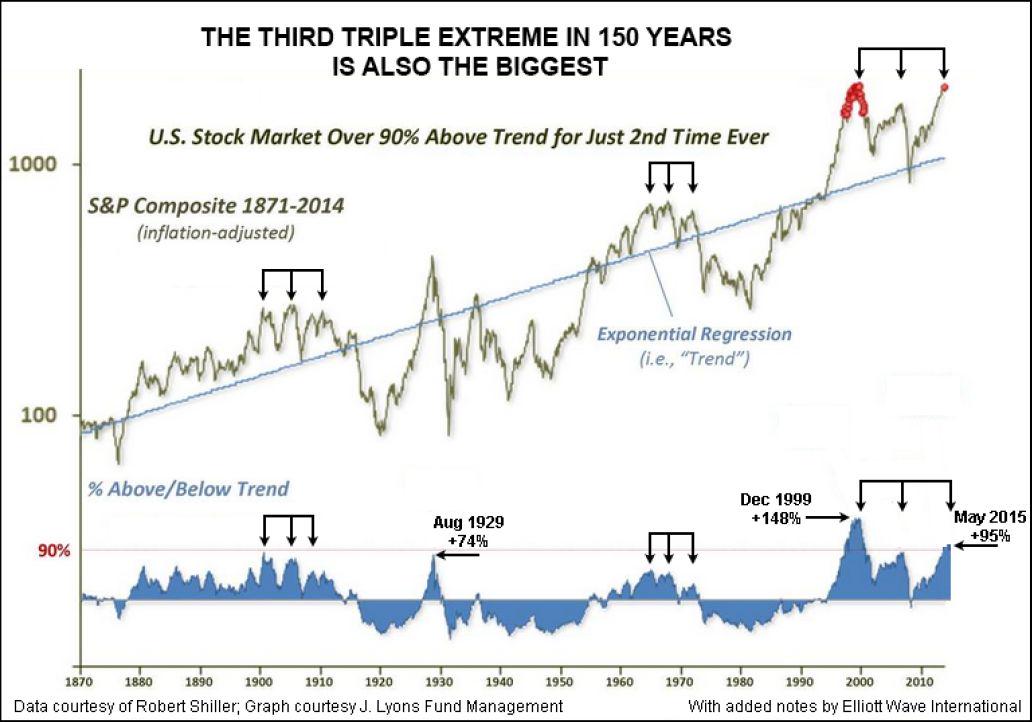
Then you have:
- Elliott Wave Int’l @elliottwaveintl – “Third Triple Extreme” — the Biggest in 150 Years: http://bit.ly/1SkKRHk
What’s the way for central banks to prevent all of the above? What question did Bonnie Baha of Double Line ask of a bullish CNBC guest -” What’s your feeling about QE4? ”
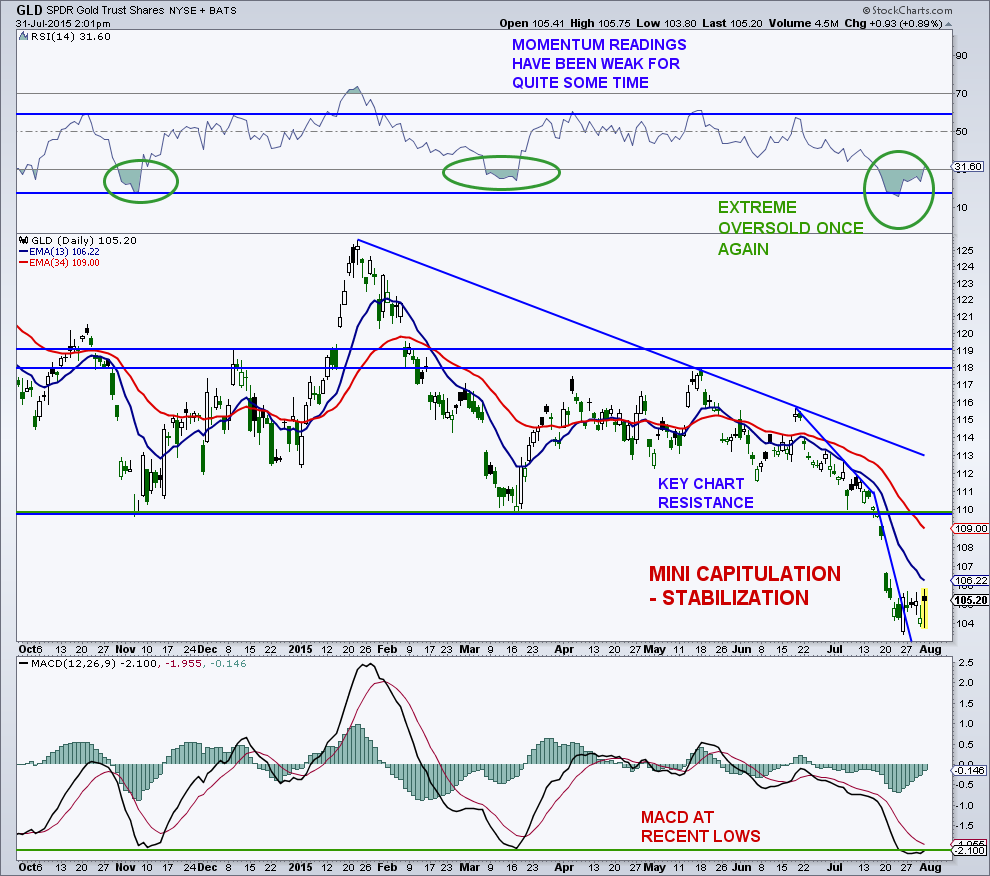
7. Gold
We are struck by the number of positive, or at least non-negative, comments about Gold this week. On Monday, Larry McDonald suggested buying GDX on CNBC Closing Bell. The miners, he said, ranked very high on their capitulation model. He also added that GDX was at the cheapest level he had seen to Gold. McDonald was not expressing a secular or long term bullish call on Gold or the Gold Miners. he expected a vicious bear market rally.
The technicians seemed to like Gold as well or at least not hate it:
- Wednesday – Urban Carmel ?@ukarlewitz – $GLD is not doing much. Similar to last November. Likely to do something big soon. Have a plan, even a bad plan pic.twitter.com/x4riAneHxS
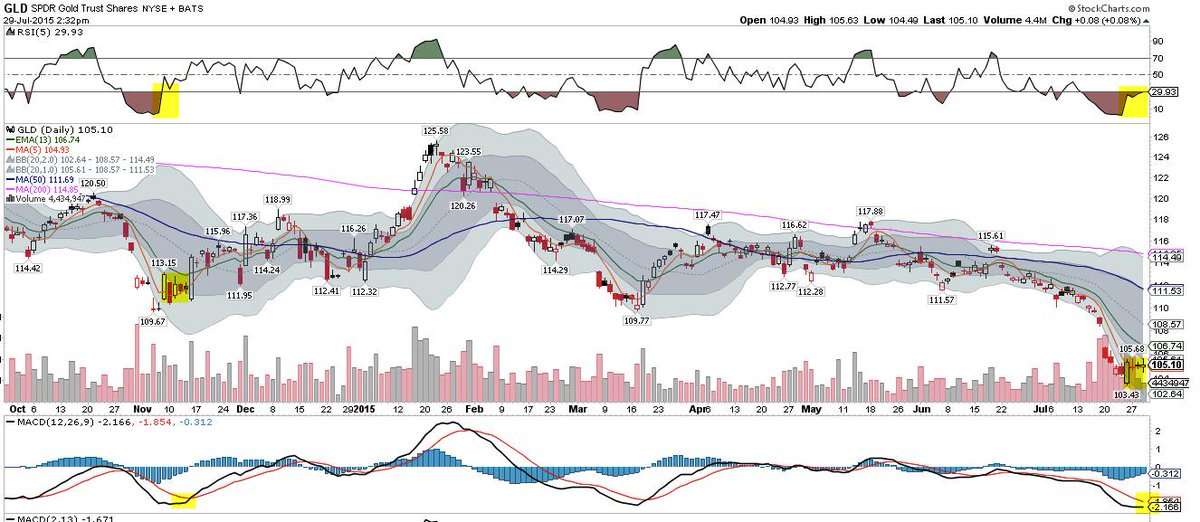
- Friday – Mark Newton ?@MarkNewtonCMT retweeted robert mancini Yes, I like buying GOLD, Good technical risk/reward. Stops under July lows, but Attractive here from CounterTrend
- Friday – Mark Newton ?@MarkNewtonCMT – Gold in a seasonallly Bullish time, and should pay to OWN and buy from August and hold into October..TD COMBO 13 buys confirmed Today >1094
- Friday – Mark Arbeter ?@MarkArbeter – While $GLD could certainly go lower, if it catches a bid here, there is “NO” chart resistance until 110. None!
But the long term picture looks terrible according what Louise Yamada said on CNBC Futures Now:
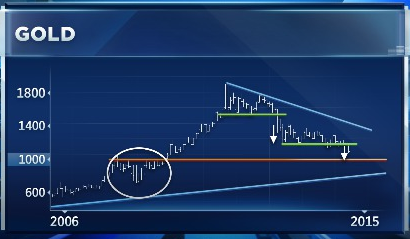
- “Gold is in a structural bear market; it broke down in 2013; this breakdown has spent two years with each rally failing at lower peak; we can argue that a descending triangle was in place; would suggest 200 points down from 1200 to 1000; now 1200 represents resistance; 1000 is the support all the way back from 2008-2009 consolidation period; we could eventually even break 1000 and go back to 2001 uptrend in a couple of years & get to 800; break down to 1000 will happen this year; you are practically there;”
7. Oil
Jeff Currie of Goldman Sachs succinctly used a 3Ds phrase on CNBC FM 1/2 to explain his bearishness on oil – Deflation, Divergence in Currencies & Deleveraging of the Debt bubble in China. He is more inclined to short the longer end of the oil curve that has not factored in these negatives.
Raoul Pal was conditionally negative on CNBC FM:
- “If $ continues to do what it is doing, then probability is oil will come back down to $20; thats how the correlation plays out for the Dollar; what we are seeing that as the Dollar gets stronger, global growth keeps falling, global export growth keeps falling, that means generally commodity prices should fall as well”
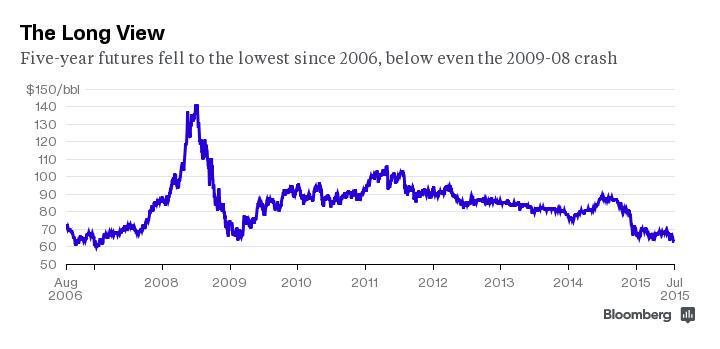
Lower for longer in Oil?
- Javier Blas ?@JavierBlas2 – #Oil Embraces Lower-for-Longer View: 5-Year Forward Drops Below 2008-09 Crisis Level http:// http://bloom.bg/1LZXGmv
The most negative or dire outlook was presented by Ari Wald of Oppenheimer on CNBC FM on Friday:
- “XLE has broken a 12-year upturn; has reversed lower; when we talk of breakdowns of this magnitude, I think of financials in 2007, I think of technology in 2000; XLE made its peak in 2014, Financials (XLF) in 2007 and Technology (XLK) in 2000; this is a doomsday scenario;
- “in the short term, XLE has broken its Q1 low; there are some short opportunities, I would underweight or stay away from these stocks”
This view is consistent with the high-yield debt of energy companies is like 2007 view that has been expressed often by Larry McDonald. So what do look forward to – Energy TARP for Oil companies? Or series of bankruptcies for smaller energy companies?
Send your feedback to [email protected] Or @MacroViewpoints on Twitter.