Summary – A top-down review of interesting calls and comments made last week in Treasuries, monetary policy, economics, stocks, bonds & commodities. TAC is our acronym for Tweets, Articles, & Clips –our basic inputs for this article.
Editor’s Note: In this series of articles, we include important or interesting Tweets, Articles, Video Clips with our comments. This is an article that expresses our personal opinions about comments made on Television, Tweeter, and in Print. It is NOT intended to provide any investment advice of any type whatsoever. No one should base any investing decisions or conclusions based on anything written in or inferred from this article. Macro Viewpoints & its affiliates expressly disclaim all liability in respect to actions taken based on any or all of the information in this article. Investing is a serious matter and all investment decisions should only be taken after a detailed discussion with your investment advisor and should be subject to your objectives, suitability requirements and risk tolerance.
1.”we needed a week like this“
said Mohammed El-Erian on CNBC Closing Bell on Friday. It was the strongest week of the year for the equity markets. The two days after a 116-handle three day rally were a consolidation of the gains. Rates rose up a bit after the capitulation lows of last week and Gold also consolidated a bit. Volatility came down hard.
That gives us time after a violent month & half to reflect on what caused the decline in risk assets and the stunning vertical move in Treasuries & Gold. According to the world’s largest hedge fund, it is not the R-word that is responsible but the D-word:
- Holger Zschaepitz @Schuldensuehner – Bridgewater’s Prince says #deflation fear behind market selloff. http://bloom.bg/1Q60ijG
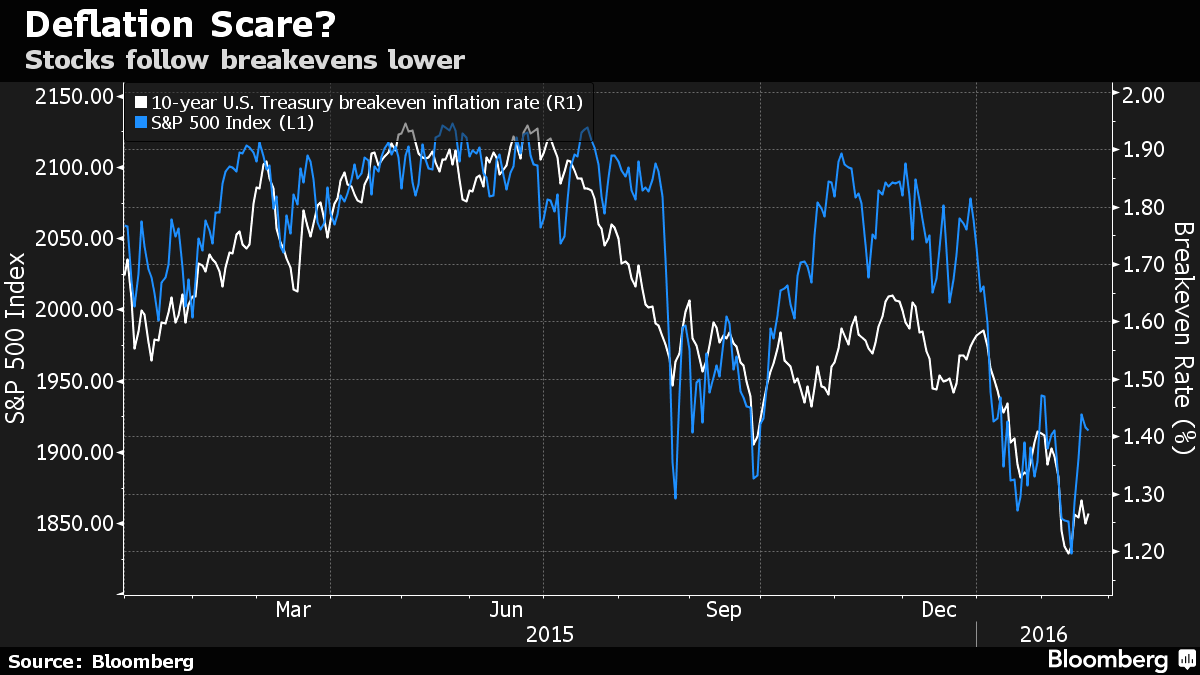
Prince wrote:
- “Central bankers and governments need to contain the deflationary forces before the pressures are too great to control, … Since 2014, the discounted real return of cash has been rising, creating a drag on all assets, … With nominal interest rates so low already, “central banks can’t easily offset the impact of this tightening.”
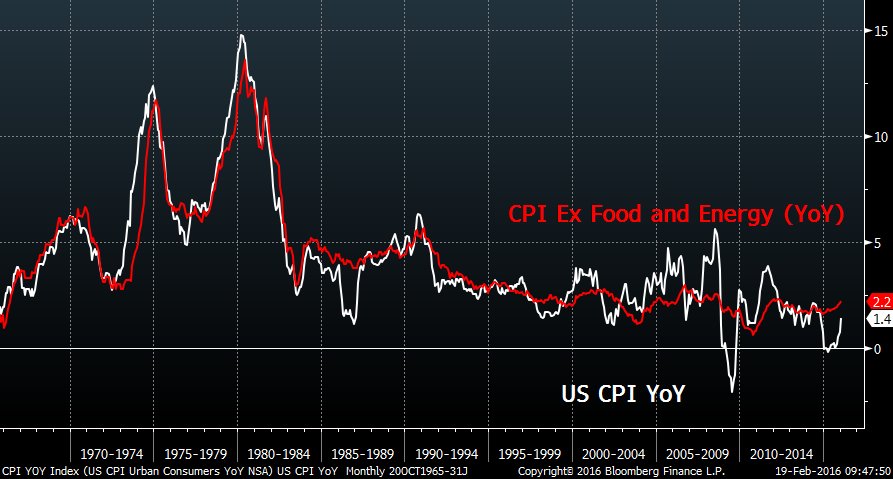
The real return on cash rose again on Friday after a hotter than expected CPI report. The 10-2 year curve flattened to 100bps.
- Charlie Bilello, CMT @MktOutperform – US CPI Overall: +1.4% YoY => highest since Oct ’14 US CPI Ex Food/Energy: +2.2% => highest since June ’12
A flattening yield curve is probably the last thing the economy or markets need right now. But can we get 10-year yield to get to or go past 2%? Larry McDonald of SocGen argued on CNBC Trading Nation that it may get to 2% given the intensity of the capitulation last week but will back off from there.
One reason rates may remain well behaved is the “smell of default in the air” call from Deutsche Bank. In the paragraph titled “Default rates move past 4%, headed to 10%“, the Business Insider article writes:
- “The issue has to do with cycle analysis. During the past 100 years, researchers Sebastian Raedler, Wolf von Rotberg and Andreas Bruckner note that when defaults have risen above 4%, they have typically continued to trend to near 10%, which plays out in a full default cycle. “This is because of the tendency for credit stress to become self-fueling: a rise in expected defaults pushes up financing costs, which tips some marginal borrowers over the edge, further increasing defaults and so on,””
Then you have Bill Gross using the R-word in his conversation with Maria Bartiromo on FBN on Friday:
- Maria: Does the US economy enter a recession this year?
- Gross: – I think perhaps next year; we should be looking at a nominal GDP of 2% while we need a 4% nominal GDP to service debt, create gross profits, meet expectations in equity markets
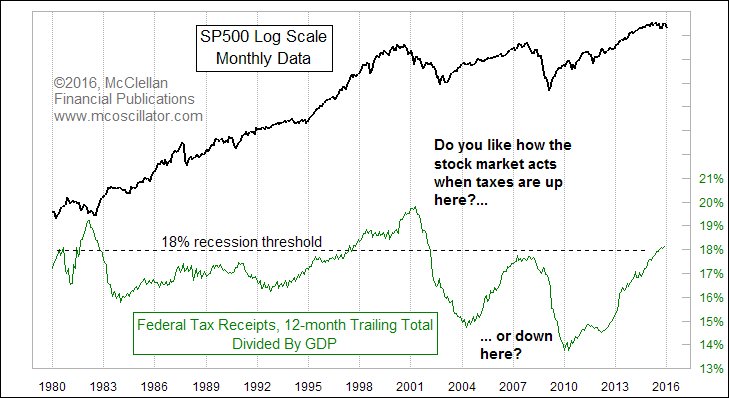
Tom McClellan is unequivocal:
- Tom McClellan @McClellanOsc – The Fed cannot fix THIS economic problem. Every time federal receipts go above 18% of GDP, we get a recession.
The above is why Bill Gross prefers a de-risked portfolio consisting, for individual investors, of closed end fixed income funds yielding 6-7-8% as he has in his own personal portfolio.
2. Treasuries
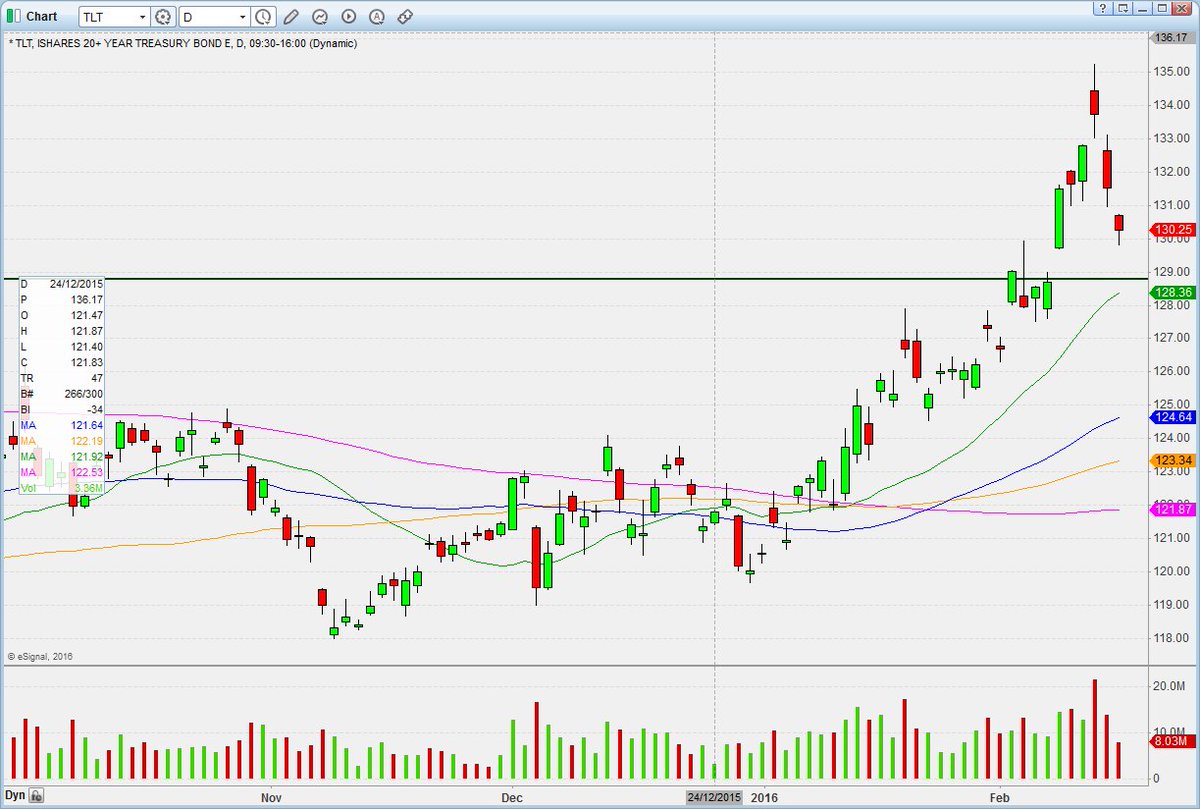
The case for Treasuries remains the same – weak economic data in the US & weak almost scary conditions in the rest of the world. Manufacturing & even housing data disappointed this week but labor data remained strong. So we wait again for the jobs number coming two weeks from now. Until then, we got technicals:
- HCPG @HCPG – Gap fill and 20sma on $TLT could start to merge– would be decent trade long on any reversal.
3. Equities
Art Cashin said that this rally is not for real unless it breaks above 1950. On the other hand, Richard Ross of Evercore ISI said the rally must be sold aggressively in the 1950-1970 range. His argument to CNBC FM was that this rally off of the 1810-1812 double bottom is just like the 2008 rally off of the double bottom in March 2008. He added that the decline after this rally ends will be like 2008 but much smaller, up to 1600. Ari Wald of Oppenheimer said this rally could get to 1965 but could see new lows after that. A graphical view suggests similar:
- HCPG @HCPG – Think we can get to the yellow zone– that will be much tougher nut to crack though. $SPY
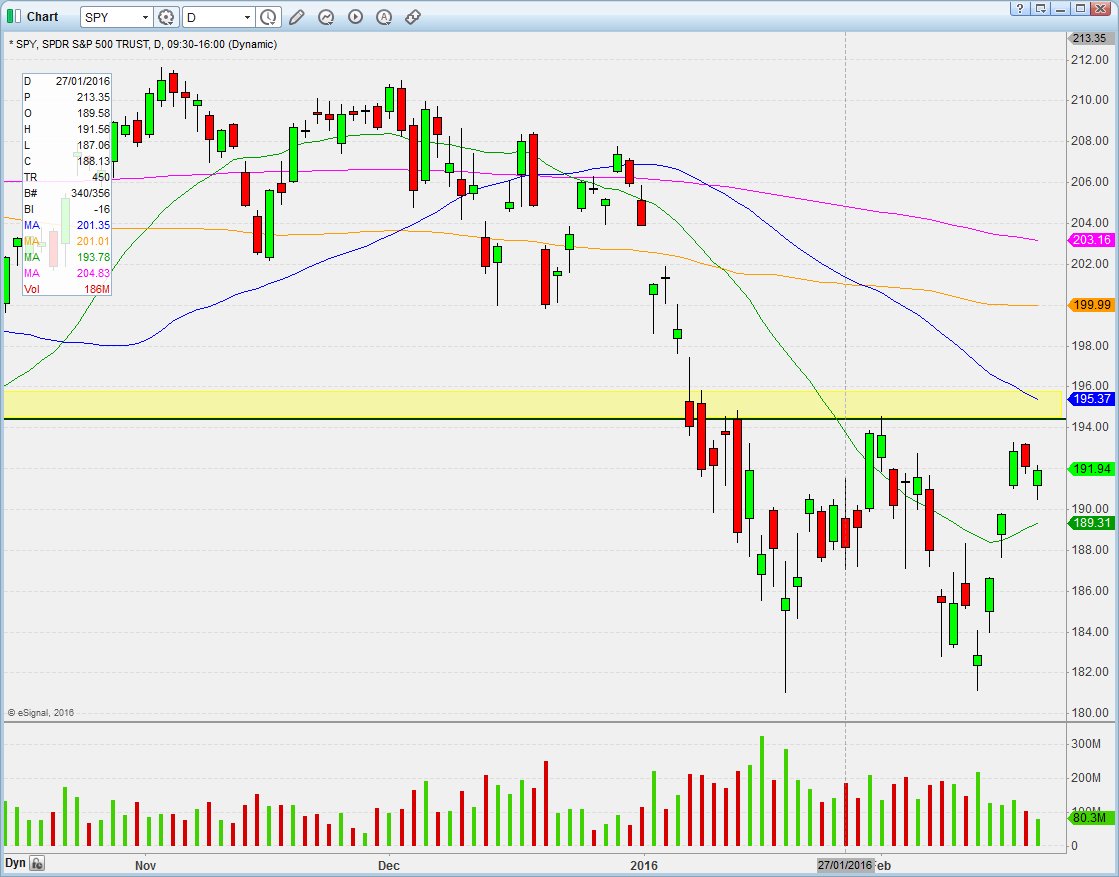
Has the S&P has managed to work off at least some of the overbought condition in the churning action of the past two days?
- stt2318 @stt2318 – $SPY 30 min view… relieving itself of the overbought condition quite nicely….
But what if this consensus wisdom proves to be wrong and the 1950-1970 level is decisively broken to the upside? What if the economic data in early March dispels the R-fear and Draghi acts & Fed speaks dovishly? Are conditions are place for a real move higher?
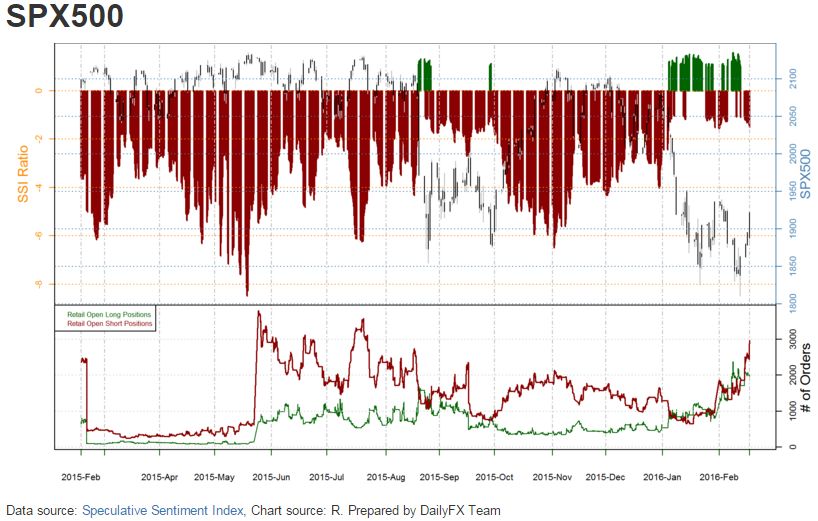
- John Kicklighter @JohnKicklighter
– Retail short $SPX500 positions heaviest since July according to SSI. More positioning data http://stks.co/yFDO
Ryan Detrick pointed out both last week and this week, “AAII bulls now lower than in March 2003 and March 2009“. Tom McClellan points to a “meaningful price bottom” in his article VXX Shares Outstanding Data Work Differently;
- Right now, VXX shares outstanding are at one of the lowest readings of the past couple of years, and such low readings are reliably associated with meaningful price bottoms for the SP500.
- Right now, both VXX and XIV shares outstanding data are showing us that there should be some more upward movement for the stock market before we get the next downturn toward the April low.
The rally has actually been stronger in emerging markets:
- Lawrence McDonald @Convertbond – Weaker Dollar + Higher Oil = Emerging market equities surging to a 6 week high From the Lows $RSX +21% $EWZ +14% $EEM +11% $INDA + 4%
Can you now ignore Oil when talking about S&P 500? Not after Ben Bernanke wrote an article about the positive correlation between S&P & Oil.
4. Oil
If the correlation between Oil and S&P holds and if the answer to the question below is yes, then the S&P could indeed blow past the 1950-1970 range.
- J.C. Parets @allstarcharts – Was That A Monster Failed Breakdown In Crude Oil? http://dlvr.it/KYJ1m2
- “Crude Oil is now on our watch list for this potential bullish whipsaw. If prices of Crude can get back above the 2009 lows, this is precisely what could be occurring here. In this chart we can see Crude Oil prices hanging out below the 2009 lows over the past 6 weeks. Notice how down below,momentum is putting in a bullish divergence. This is sign #1 that this could be a bullish whipsaw:
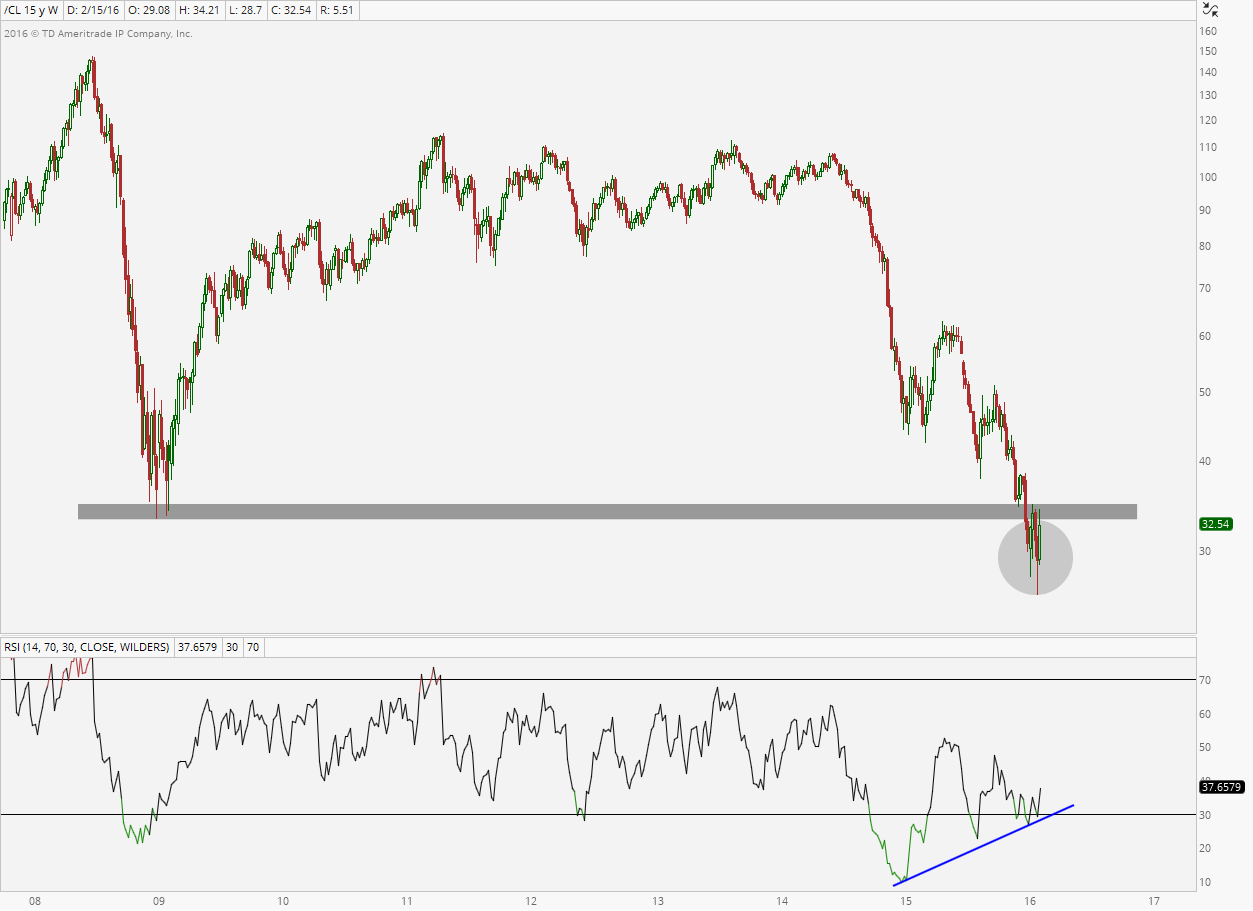
- The only thing we need now in order to enter is a rally back above the 2009 lows. This one is very simple. If you think this is a bullish whipsaw and you want to participate, you only want to be long only if prices are above the 2009 lows. If they are below that price then it is either not what we think it might be, or we have yet to see confirmation of it.
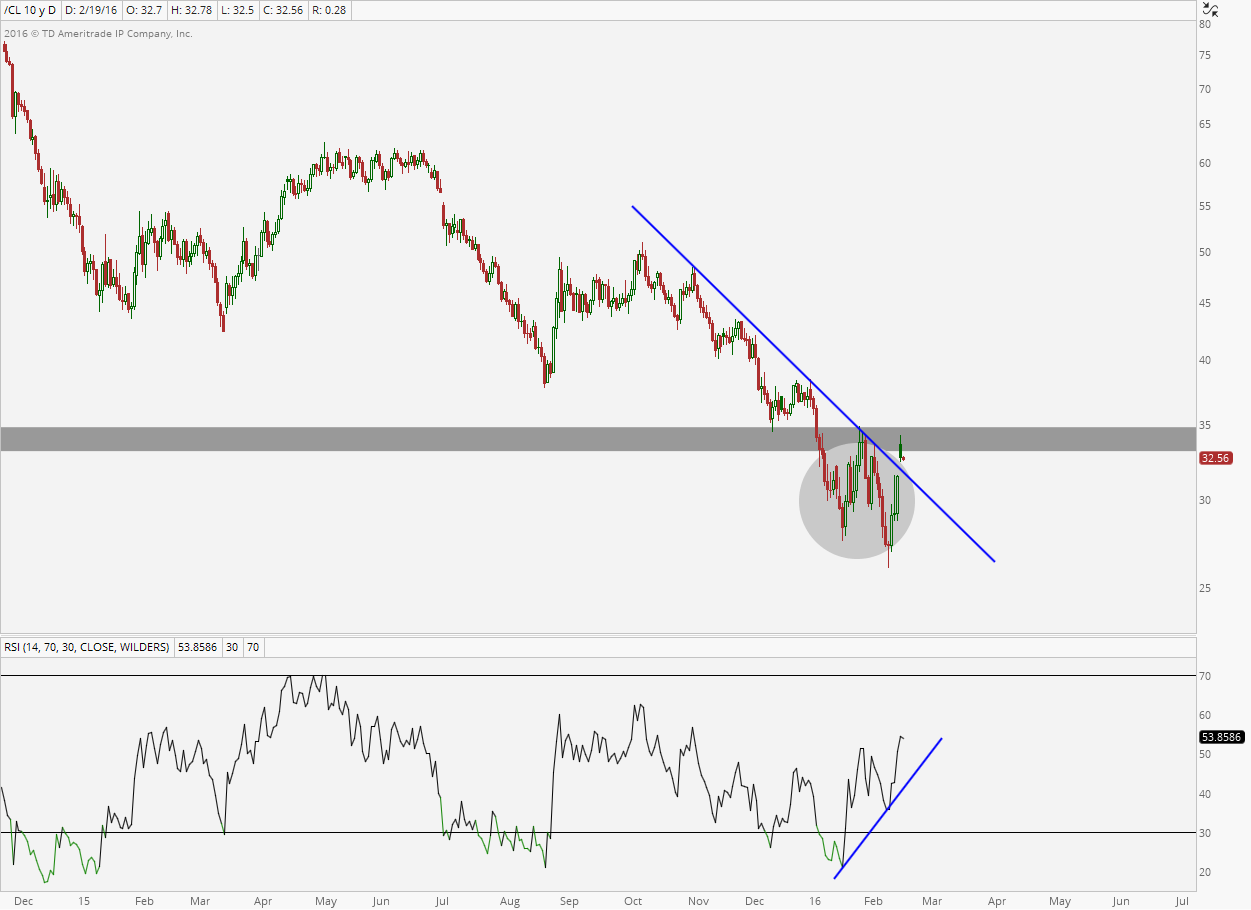
- Here is a daily chart showing this potential whipsaw. Again we’re seeing momentum divergence positively on these new lows. If we can get above/stay above the early December lows, we want to be all over Crude Oil. Below that and this one is not what we think it is, or at least not yet.
On the other hand, Ari Wald of OpCo was clear on CNBC in his call to sell pops in oil.
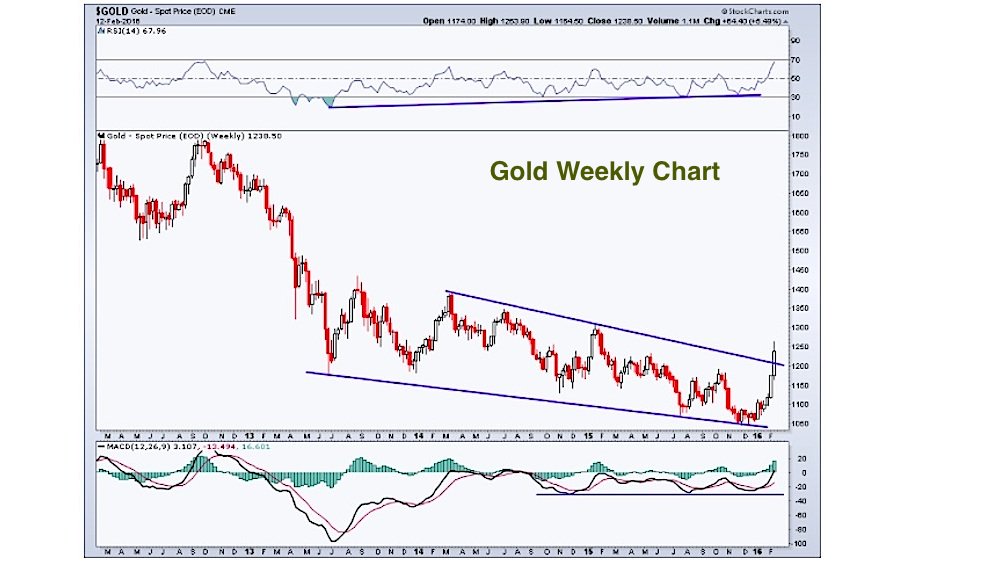
5. Gold
Last week, Tom DeMark said that gold should continue to rally. Gold seems to be listening to him.
- Peter Brandt @PeterLBrandt – $GC_F $GLD #GOLD successful retest of wedge bottom?
- See It Market @seeitmarket Is The Gold Bear Market Coming To An End? (3 charts to watch) http://www.seeitmarket.com/is-
the-gold-bear-market-nearing- an-end-3-charts-to-watch-gld- 15342/ … by @AndrewThrasher $GLD
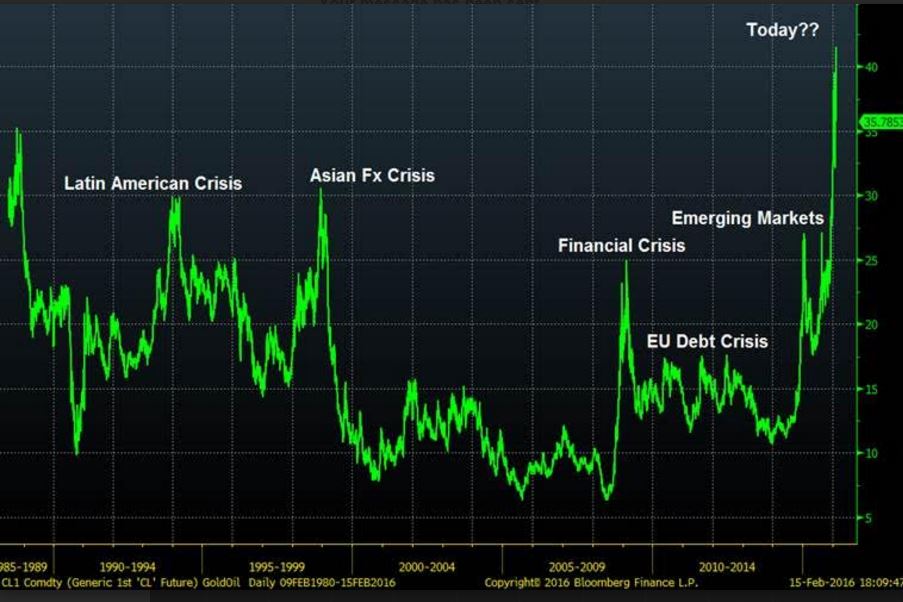
- Jesse Colombo @TheBubbleBubble – Why the gold/oil ratio could tip investors off to the next market storm: http://www.marketwatch.com/
story/why-the-goldoil-ratio- could-tip-investors-off-to- the-next-market-storm-2016-02- 16 … by @bkollmeyer
6. Supermodels
This week the 2016 Swimsuit issue of Sports Illustrated came out. These supermodels rang the bell at the New York Stock Exchange and appeared in TV interviews. Having never walked the plank, we have no clue what that entails. But, as Twitter showed us, the walk is not the preserve of the rich, wealthy supermodels. Kudos the photographer who shot this photo.
- Víkrám @gvicks 18 Dec 2015 – She walks like a supermodel. Only difference, supermodels don’t want to eat, and she doesn’t get to eat……
-
