Summary – A top-down review of interesting calls and comments made last week in Treasuries, monetary policy, economics, stocks, bonds & commodities. TAC is our acronym for Tweets, Articles, & Clips –our basic inputs for this article.
Editor’s Note: In this series of articles, we include important or interesting Tweets, Articles, Video Clips with our comments. This is an article that expresses our personal opinions about comments made on Television, Tweeter, and in Print. It is NOT intended to provide any investment advice of any type whatsoever. No one should base any investing decisions or conclusions based on anything written in or inferred from this article. Macro Viewpoints & its affiliates expressly disclaim all liability in respect to actions taken based on any or all of the information in this article. Investing is a serious matter and all investment decisions should only be taken after a detailed discussion with your investment advisor and should be subject to your objectives, suitability requirements and risk tolerance.
1.Out of ammunition?
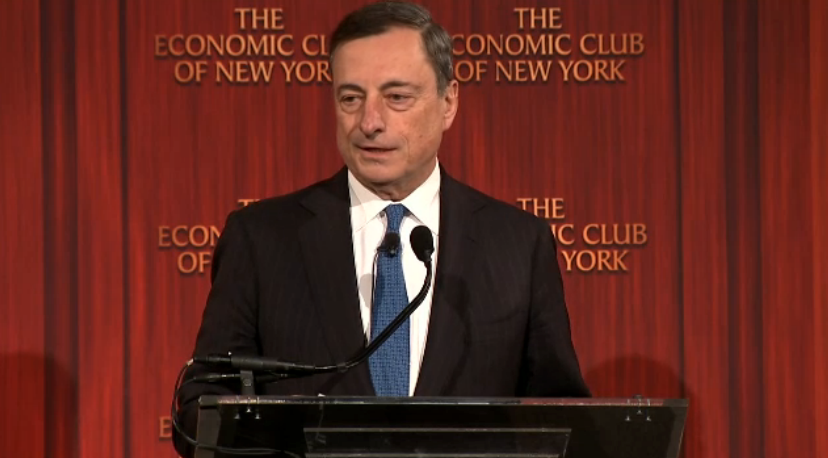
Recall what we wrote on Friday, December 4, 2015 & our caption for Draghi’s speech on that day:
“the capo de tutti capi of central bankers. Mario Draghi spoke with a deliberate & total assertion of power at the Economic Club in New York”:
- “no limitation on deploying ECB tools, can deploy further tools as necessary, bottom line QE is here to stay, if needed, it could be recalibrated – expansion of balance sheet is monetary policy, should be used to the extent it is necessary, no specific limitation; we have power to act, determination to act, commitment to act”
Le Roi, C’est Moi; L’Etat, C’est Moi – Super Mario as today’s Louis XIV
A number of people keep expecting Draghi to under-deliver on the built up expectations. Guess they still don’t get him. Since he donned his Super Mario cape in August 2012, Draghi has almost always over-delivered. He surpassed his own track record this Thursday.
- Holger Zschaepitz
@Schuldensuehner – Draghi defines his era as#ECB stimulus locked into next decade.http://bloom.bg/1M9MArd
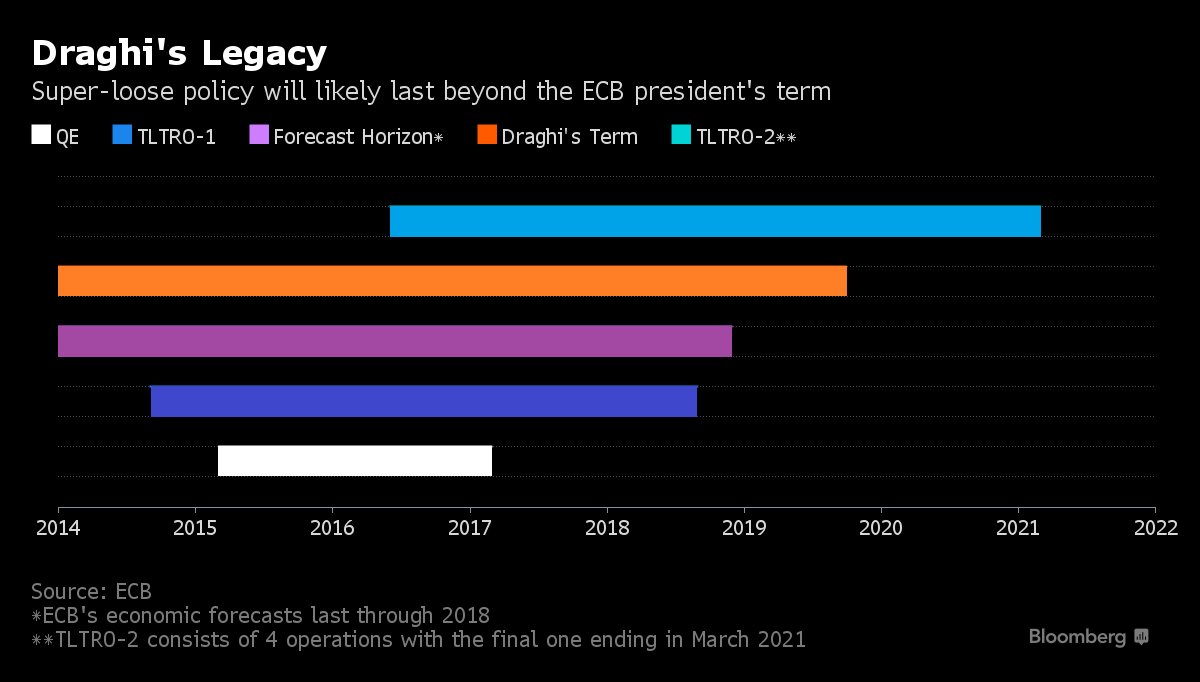
Draghi locked his stimulus into the next decade, well beyond his term. So if it blows up, it will be his successor’s job to clean up. What did he announce?
- [Draghi] “announced cuts to all three of the ECB’s rates, bringing the deposit rate to minus 0.4 percent, and a 20 billion-euro ($22 billion) expansion of quantitative easing that for the first time opens the door to purchases of corporate bonds. On top of that, he announced a new four-year loan program that potentially allows banks to be remunerated for taking the ECB’s money if they expand credit to the real economy, in a quartet of operations stretching to 2021“
Draghi virtually removed the risk that markets were frightened of a few weeks ago, the risk of Deutsche Bank & other European financials getting into balance sheet trouble. Just see the action in Deutsche Bank & European Insurance companies – up 6%-7% on Friday. And removal of that risk was directly responsible for a large portion of the 32 handle S&P rally. The other big factor was of course due to the new conviction that oil has bottomed for sure. And there was that little matter of the S&P bouncing off of 1970 on Thursday afternoon to close nearly flat.
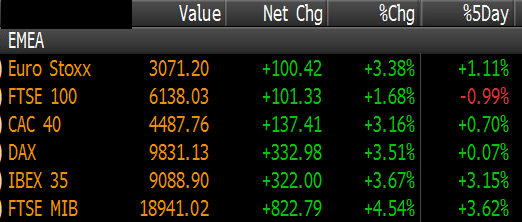
And the action in European indices?
- ForexLive @ForexLive – European stocks close the week up after Draghi http://news.forexlive.com/!/
european-stocks-close-the- week-up-after-draghi-20160311 …
European bonds
- Italy 1.33% -13bp
- Spain 1.49% -10bp
- Portugal 2.94% -19bp
- Germany 0.273% -3bp
- Greece 8.91% -21bp
2. Fed & Treasuries
The U.S. stock market broke decisively above the 2,000 big number resistance & touched the big resistance of the 200-day moving average.
- Ben Eisen @BenEisen – We made it to the 200-day moving average on the S&P 500. Good work everyone

And we all know what a strong move in the S&P does to Fed hike expectations?
- Bloomberg Markets @markets – Bond Traders Clear a Path for Fed to Lift Interest Rates in June http://www.bloomberg.com/news/
articles/2016-03-11/bond- traders-clear-a-path-for-fed- to-lift-interest-rates-in-june …
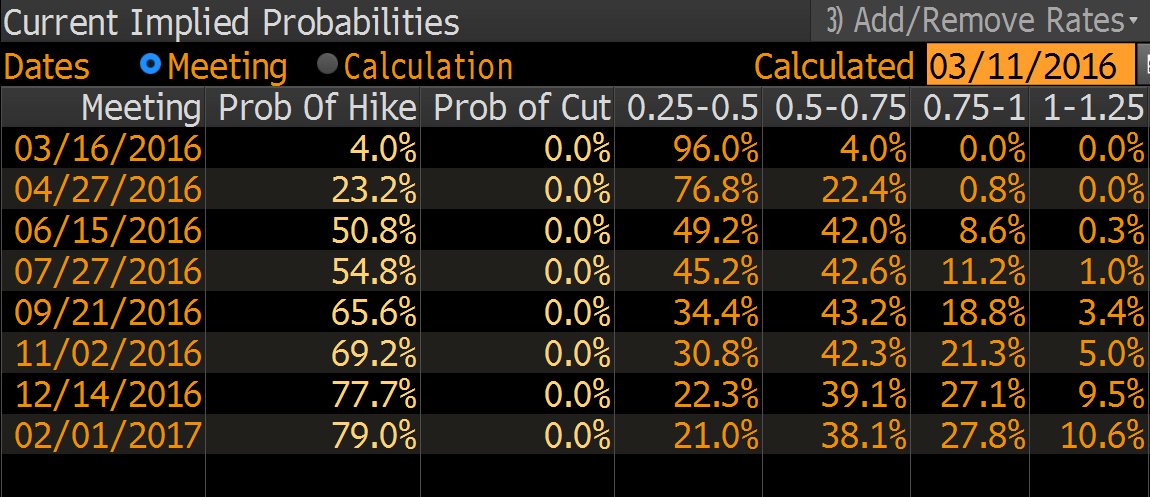
This is reflected in the belly of the curve with 2-year yield at 96 bps, 3-year yield at 1.16% & the 5-year yield at 1.49%. The 10-year yield at 1.98% is close to the 2% resistance level. The 30-5 yr & 30-10 yr spreads flattened by 6 bps this week. This has been typical as Larry McDonald pointed out on Friday and said “I would leg into them (TLT & 10-year Treasuries) here and start to buy them“.
His segment-mate technical analyst Craig Johnson of Piper Jaffray was bearish on TLT saying “I am not buying bonds ; there is double top in TLT … the bull market in bonds is over“. But technical analysis seems to be in the eyes of the beholder. Carter Worth, resident technician at CNBC Options Action,argued that Friday’s closing level of 1.98% on the 10-year represents little more than a 50% retrace of the fall in yield from 2.33% to 1.52% in February. This plus the message from his charts prompted Carter Worth to recommend buying TLT.
3.Stocks
Last week, we wrote about the overbought nature of the indices. And the S&P chopped around during the first four days of this week before exploding up on Friday. That brings the question of whether the overbought condition is a good or a bad one. A parallel question is whether a very high reading of the McClellan Oscillator is a positive sign or a negative one. According to Tom McClellan, this is another eyes of the beholder issue.
- “On March 3, the McClellan A-D Oscillator hit a reading of +332, which was its highest reading since the +386 reading seen on Jan. 6, 2009. … A really high McClellan Oscillator can sometimes mean strong upward initiation of a new uptrend, or other times it can mark a climax of a bear market rally … My interpretation is that the current market situation is still a downtrend, and thus that the recent +105 RAMO reading was a sign of a bear market rally’s climax“.
A number of technicians had pointed to the 1950-2000 range as a level where they would feel comfortable shorting the S&P. That hasn’t worked. So what is the next level that might act as a ceiling? Louise Yamada had pointed to 2050 last week. Jeffrey Gundlach said in his webcast on Tuesday that he saw a 2% upside & a 20% downside in the S&P. From Tuesday’s close of 1979, a 2% upside is 2019, a tad below Friday’s close of 2022.
Others point to 2040-ish level:
From Northmantrader.com – Next week: OPEX, BOJ, FOMC. Nothing else matters. Front run time:
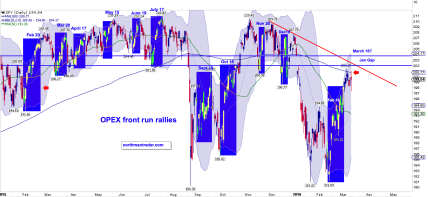
- David Larew
@ThinkTankCharts – SPX weekly – at the pivot point

- Northy
@NorthmanTrader – The magic uninterrupted weekly ramps…. What do they all have in common..

- HCPG
@HCPG – Here’s the visual — gap open or quick rip to 204$SPY would make us give it a go on the dark side

We must point out that, apart from the perma bulls, very few think this rally could go to new highs. Even bullish gurus offer a caveat or warning:
- Lawrence G. McMillan @optstrategist – The Stock Market 3/11/2016: In Summary… http://www.optionstrategist.
com/blog/2016/03/weekly-stock- market-commentary-31116 … $SPX

But what if the Crude Oil rally keeps going, what if the rally in Crude keeps rallying High Yield bonds & what if the Fed gives an unexpected dovish signal this week & the data keeps coming in OK? Could we see a bigger than anticipated rally into April & May? Of course, we don’t have a clue ourselves. But we do see a near total consensus that this is a rally in a bear market and that it will fail.
4. Oil
USO was up 5% this week after a 10% rally past week. It has rallied 48% in the last 20 trading days according to Bespoke. Does this continue into mid-40s from Friday’s close of $38.5? First the bearish views:
- Lawrence McDonald
@Convertbond – Oil Bears from February have become Bulls in March, run don’t walk the other way from this crowd
How bullish have they become?
- Benzinga.comVerified account
@Benzinga – Hedge Funds Now ‘Strongly Bullish’ On Oil$USO http://benzinga.com/z/7671049

But is that a reason to stay long until oil tells you get out? The view was posted by Thomas Bruni (@BruniCharting) on Monday on allstarcharts.com:
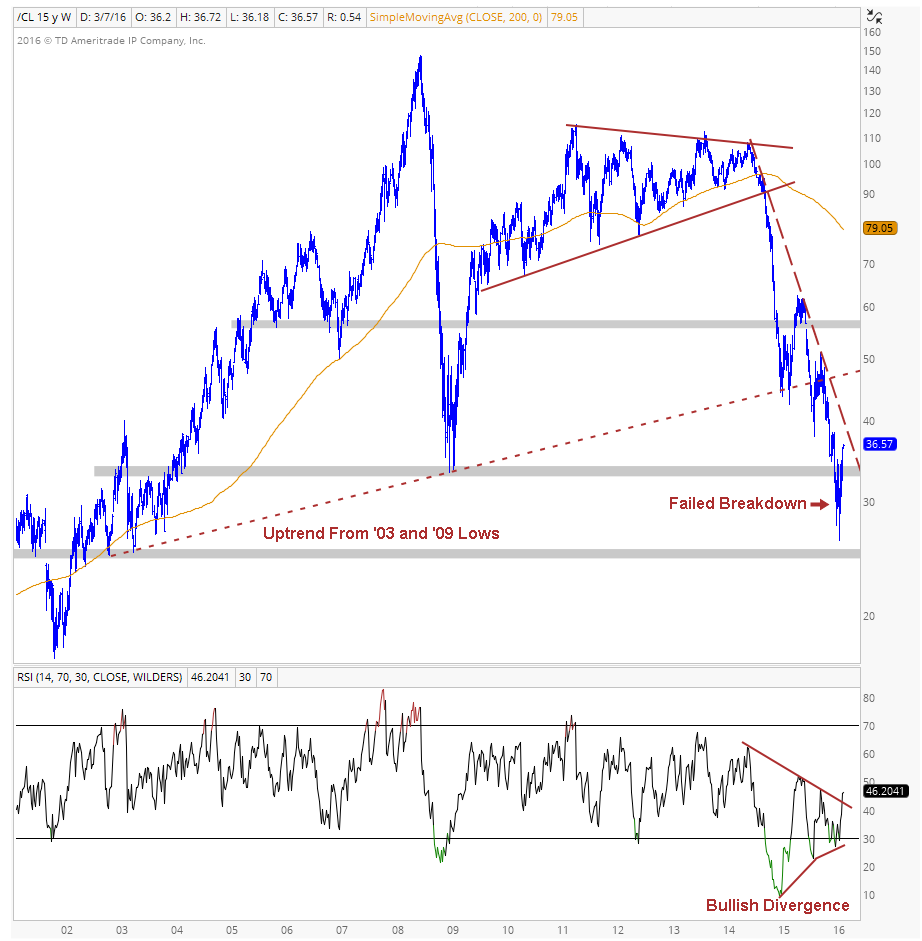
- It’s very clear that we only want to be long if Crude continues to close above the 2009 lows on a weekly basis.
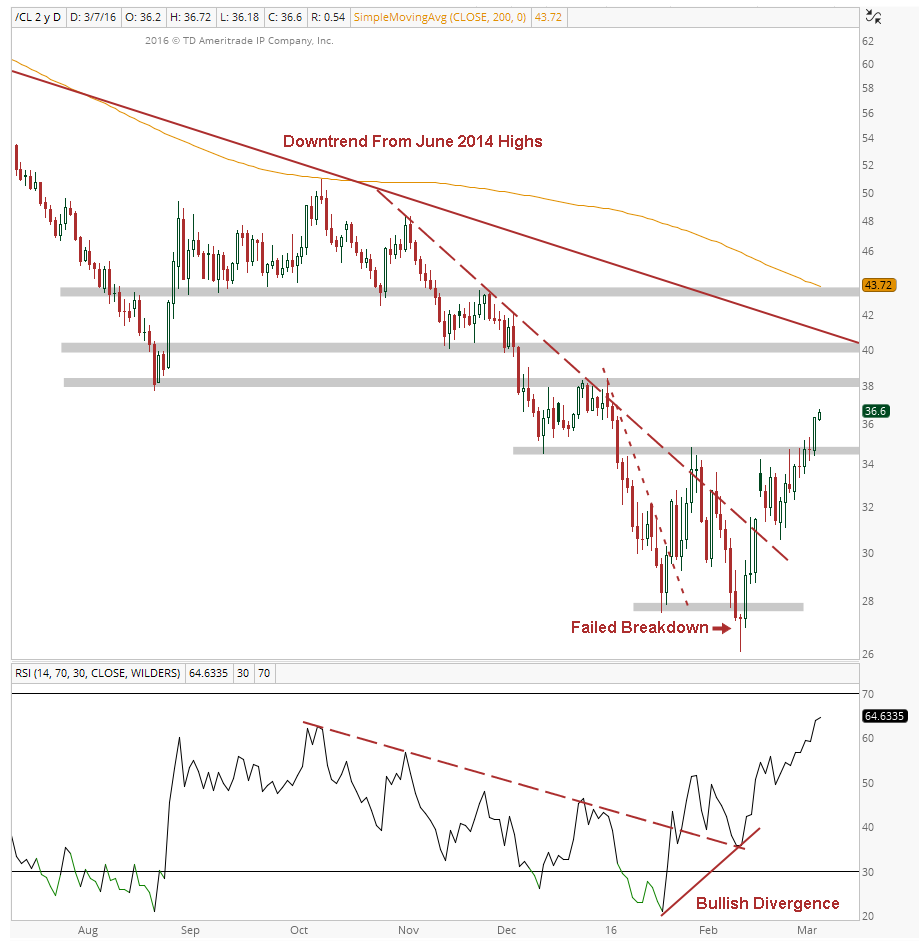
- “If prices can breakout of this falling wedge, it will likely be the start of a massive move to the upside. Price targets for falling wedge patterns are typically defined by the full-length of the wedge, suggesting that a resolution to the upside could result in a 66% rally in this ratio over the next few years”.
- “The Bottom Line: Nobody knows whether this aggressive rally off the February lows has marked ‘the bottom’ in Crude Oil, but the weekly close above the 2009 lows allows market participants to remain long from a structural perspective as long as we’re above those lows. Additionally, if Crude Oil prices continue to stabilize and move higher then the out-performance in energy stocks relative to the S&P 500 should really start to accelerate”.
5. Emerging Markets
The rally in Emerging Markets has been spectacular. How real it is depends on both the rally in S&P and in Oil. Conversely, if the EM rally is likely to fade, would that imply the same for oil?
- ValueWalk @valuewalk – Emerging Market Rally Is Coming To A Close: Goldman $EEM $VWOhttp://www.valuewalk.com/2016/
03/emerging-market-stock- rally/ …

- The GS analysts argue that the Fed has set the tone for emerging market “mini-cycles” as, based on the past three years, they observe that Fed meetings have coincided with nine of the ten major inflection points in the MSCI EM. The following graph highlights Fed meetings, denoting those the market interpreted as hawkish, dovish or neutral as gauged by the change in U.S. 10-year rates from one week prior to the meetings vs. one week after. The analysts highlight that a hawkish Fed meeting has marked the peak in four of the past five MSCI EM “mini-cycles”:

Send your feedback to [email protected] Or @MacroViewpoints on Twitter.