Summary – A top-down review of interesting calls and comments made last week in Treasuries, monetary policy, economics, stocks, bonds & commodities. TAC is our acronym for Tweets, Articles, & Clips – our basic inputs for this article.
Editor’s Note: In this series of articles, we include important or interesting Tweets, Articles, Video Clips with our comments. This is an article that expresses our personal opinions about comments made on Television, Tweeter, and in Print. It is NOT intended to provide any investment advice of any type whatsoever. No one should base any investing decisions or conclusions based on anything written in or inferred from this article. Macro Viewpoints & its affiliates expressly disclaim all liability in respect to actions taken based on any or all of the information in this article. Investing is a serious matter and all investment decisions should only be taken after a detailed discussion with your investment advisor and should be subject to your objectives, suitability requirements and risk tolerance
1.NFP – Will the real economy stand up?
The NFP number again surprised on the upside with a 255,000 print. Rick Rieder of BlackRock thought it was a solid report on BTV and a CNBC guest from Payden & Rygel called it “one of the best job reports of the cycle“. On the other hand, Professor D. Quinn Mills emailed the following comment to Rick Santelli:
- “The economy lost more than 1 million jobs in July. It is converted to an increase of 255,000 by seasonal adjustment … The economy has added 2.4 million jobs over the past year – a 1.7% increase. This is a very weak job report.”
Regardless of who is correct, the markets act on the headline number based on what is priced in before the NFP release. By that standard, this was a really strong report. By “really” we mean in comparison to the 287,000 jobs number on Friday, July 8. Why do we call the July 255,000 number stronger than the June 287,000 number?
Because Treasuries, TLT, Gold, Silver & Miners actually rallied and closed up on that 287,000 number on July 8 while Treasuries, TLT, Gold, Silver & miners all closed down hard on the 255,000 number this Friday. In fact, we did not see any bounce at all in TLT on this Friday.
Clearly this Friday’s number is taken as a more reliable evidence of strength and therefore capable of creating higher odds of a September tightening.
But which is the better indicator of the real economy – Q2 GDP print of 1.2% or the NFP number of 255,000. Clearly the latter either because hope springs eternal or because Q3 GDP is now trending at 3.8% rate. On the other hand,
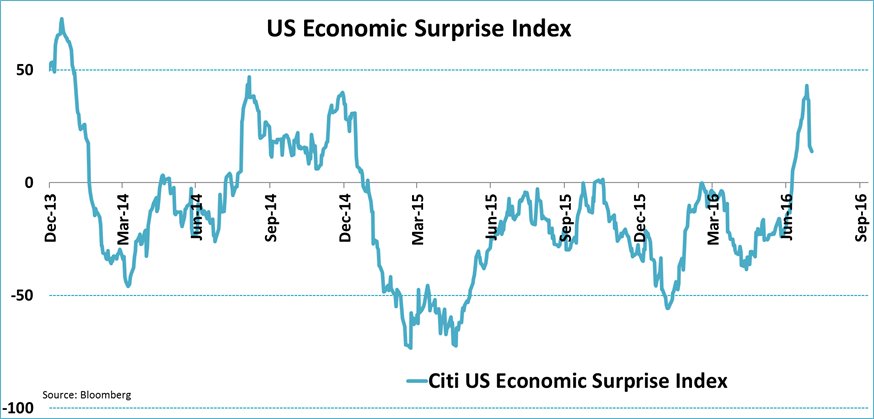
- jeroen blokland
@jsblokland Rolling over! Citi US Macro Surprise Index has peaked for now.
2. Central Banks
- Charlie Bilello, CMT
@MktOutperform – Update after today’s payrolls… Sep ’16: 18% Dec ’16: 45% Mar ’17: 51% Jun ’17: 61%
In contrast, in a pre-emptive move Governor Carney of the BoE cut rates by 25 bps and announced a QE including corporate bonds on Thursday. Gilts traded at new lows in yield on that announcement. And,
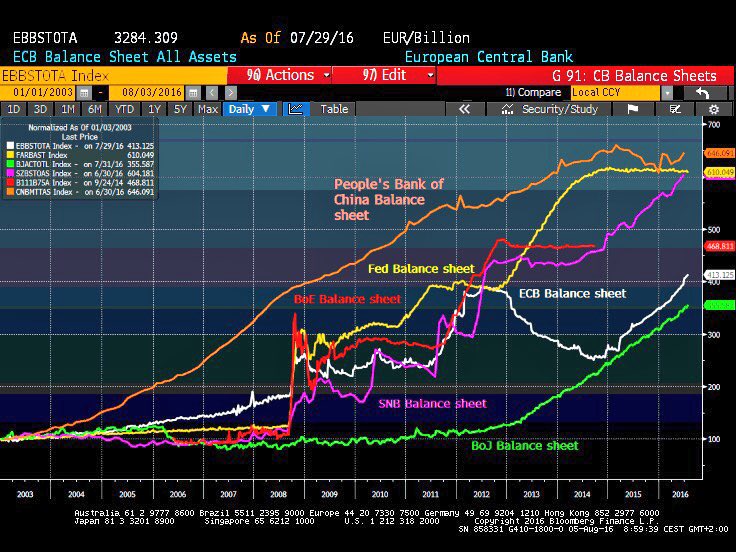
- Holger Zschaepitz
@Schuldensuehner – DB’s Reid: Global QE in early stages. I’d be stunned if CenBanks were not still buying govt bonds way into the 2020s
So we are back to monetary divergence between America & Europe and a resultant upward pressure on the U.S. Dollar that no one wants.
Treasuries had a bad week accentuated by the big rally on Friday July 29 after the 1.2% Q2 GDP number and the big sell off this Friday after the 255,000 NFP number. And the 10-2 year treasury curve bear-steepened by 7 bps. The rise of 13 bps in 30-yr & 10-yr treasury yields outpaced the 9 & 5 bps rise in 30-yr & 10-yr Bunds. High Yield credit sharply outperformed Treasuries with HYG up 16 bps while TLT & EDV fell by 2.6% & 3.1% resp. further confirming market acceptance of stronger growth ahead.
3. Asset Classes
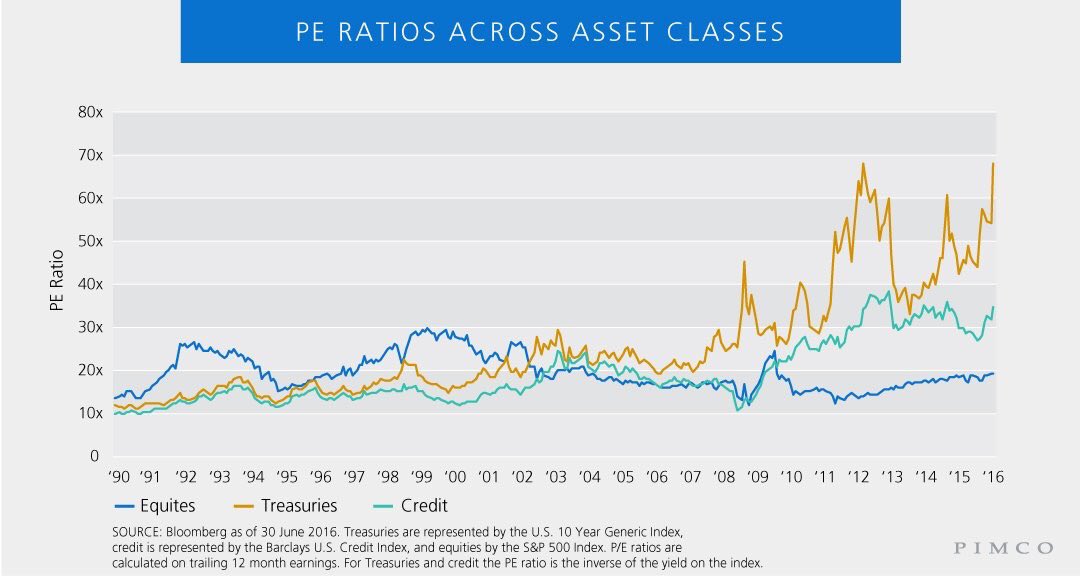
Both Bond Kings, Gross & Gundlach, dismissed Treasury bonds as unworthy of purchase. Of they both dissed stocks as well but stocks didn’t care as much. But which one of these is more richly valued & which one has been more volatile?
- David Schawel
@DavidSchawel – First time I’ve seen a P/E ratio for Treasuries
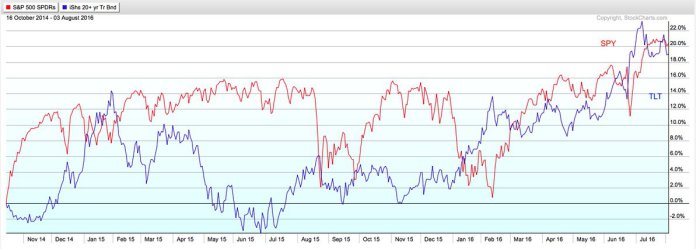
- Urban Carmel
@ukarlewitz From the Oct ’14 low, total returns on$SPY and$TLT the same. Along the way,$TLT more volatile
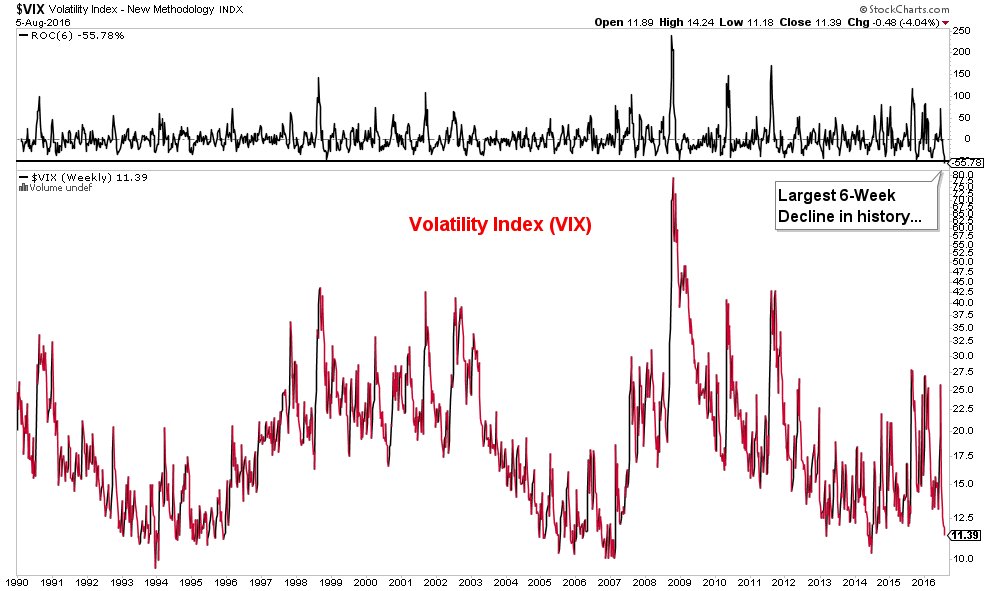
Speaking of volatility,
- Charlie Bilello, CMT
@MktOutperform – Volatility Index down 56% since Brexit, the largest 6-week drop in the history of the$VIX. 25.76 to 11.39
4. Stocks
Before we get to long term indicators that are givings their adherents diametrically opposite signals, a quick simple statement from Lawrence McMillan of Option Strategist:
- “In summary, there are no sell signals among our indicators at this time. Hence we remain bullish for the short term“
Trim hedges may look good in a garden but are they negative for the stock market? Possibly say Dana Lyons in his article Investors (Over?) Trim Their Hedges:
- On Monday, we looked at the NAAIM survey of active manager equity exposure which showed an average of over 100% exposure among its respondents for one of the few times in its history. Today, we look at another area of the market that is suggesting sentiment has finally begun to swing more aggressively to the bullish side: inverse equity ETF trading.
- on a 10-day basis, relative inverse equity ETF volume has dropped to its 2nd lowest level in more than 5 years.
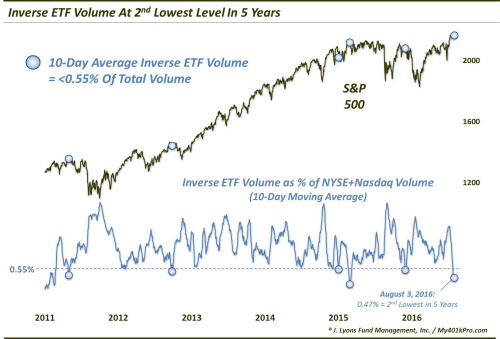
- As the chart indicates, there have been 5 previous instances over the past 5 years in which relative inverse ETF volume dropped down close to these levels: – 4/29/2011, 9/27/2012, 1/5/2015, 2/23/2015, 12/2/2015
- And whether it was just a few days or weeks, or a full-fledged intermediate-term correction, each of these instances preceded selloffs of varying degrees. Here is the aggregate performance of the S&P 500 following these 5 prior events.

- “If recent history is any indication, such a decline (of some magnitude and duration) is likely not too far off”.
A diametrically opposite table of performance comes from the Coppock Curve as explained by LPL Research in their article Famous Technical Momentum Indicator Triggers a Long-Term Buy Signal for Stocks.
- “The Coppock Curve tracks how fast the S&P 500 stocks are rising today versus 11 and 14 months ago … to effectively capture any changes in investor sentiment. The long-term nature of this signal increases the likelihood of identifying market bottoms and subsequent bullish price trends”
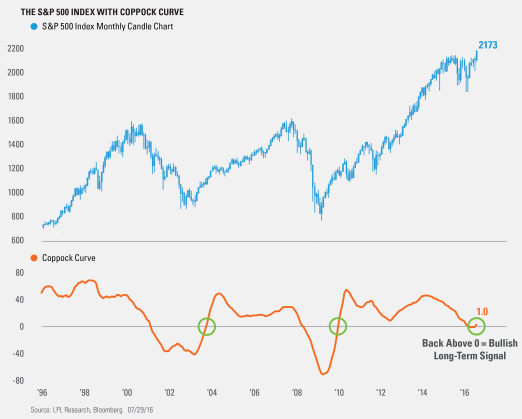
- On July 29, 2016, the S&P 500’s monthly Coppock Curve once again moved from negative to positive territory, recording a value greater than 1.0, and increasing the likelihood for a long-term bullish trend for stocks.
- Since 1950, this happened only 15 times. Six months later, the S&P 500 was higher 87% of the time, with average and median returns of 7.8% and 7.1%, respectively. Going out nine months, the returns are higher 93% of the time, with average and median returns of 11.1% and 14.0%. Looking out one year, the returns were higher 100% of the time, with average and median returns of 14.9% and 14.8%
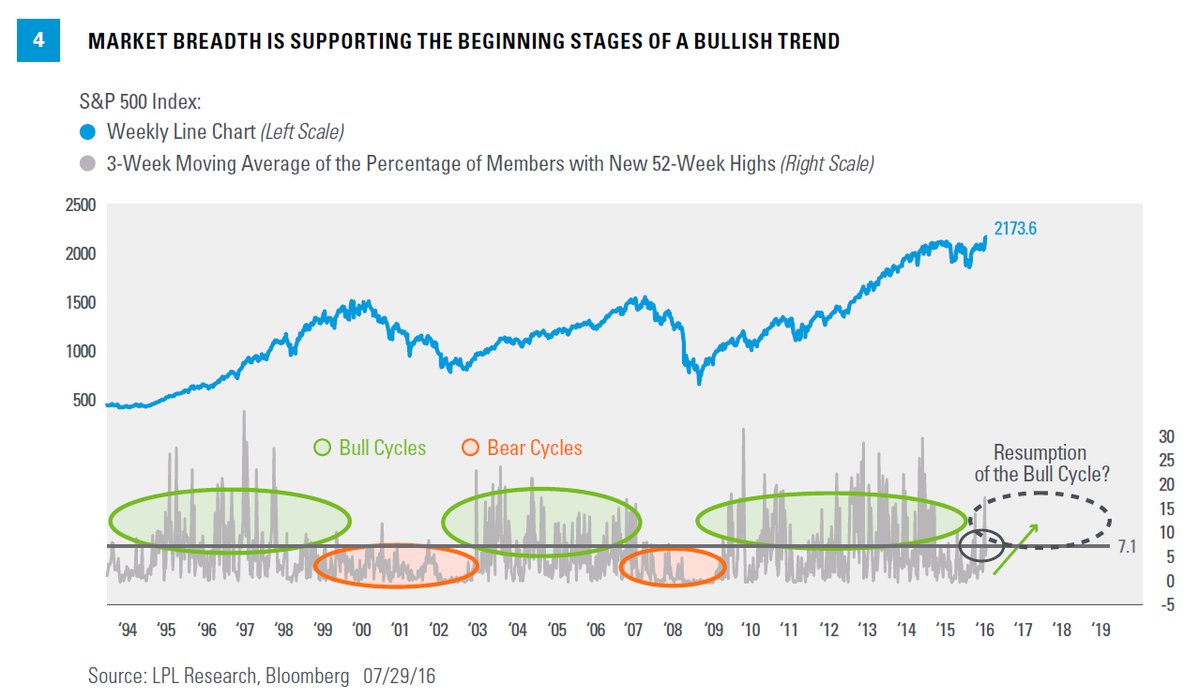
With stocks at all time highs & volatility at a low, could we be at beginning stages of a bullish trend? LPL Research says yes:
- LPL Research
@LPLResearch Market Breadth is Supporting the Beginning Stages of a Bullish Trend http://oak.ctx.ly/r/4x6gm@_BurtWhite@LPL
5. Gold, Silver & Miners
The previous two weeks demonstrated clearly that Gold, Silver & Miners are responding to one and only trigger – chances of monetary easing/tightening by central banks, especially the Fed. Given the stunning 255,000 NFP number on Friday, it should not surprise anybody that Gold, Silver & miners were all down this week, about 1-3%. After all, Gold is a form of currency and it should trade with easing/tightening signals.
And of course, both bond kings like Gold & miners while they don’t like stocks. So what happened this week? Gold fell & stocks rose. May be the anti-elite movement is catching up with financial markets!
6. “Just take one dip & end it” – George Constanza vs. Harvard Medical School
Below is a gift for those who haven’t heard of “just take one dip & end it”.
[embedyt] http://www.youtube.com/watch?v=RfprRZQxWps[/embedyt]
This week, Harvard Medical School got into this debate:
The researchers carefully analyzed bacterial contamination before and after a person double dips. Here’s what they found:
- Bacterial counts in the dip increased significantly after a person took a bite from a chip and then dipped again.
- The number of bacteria contaminating the dip varied depending on the dip – salsa had more bacteria after double-dipping compared with chocolate or cheese dips (perhaps due to differences in thickness and acidity of the dips).
They didn’t stop there. They gave a more responsible option for habitual double-dippers:
- turn the chip around to double dip from the unbitten end of the chip
What would Eliza Doolittle say to the faculty of Harvard Health?
- Is that all you blighters can do?
Send your feedback to [email protected] Or @MacroViewpoints on Twitter