Summary – A top-down review of interesting calls and comments made last week in Treasuries, monetary policy, economics, stocks, bonds & commodities. TAC is our acronym for Tweets, Articles, & Clips – our basic inputs for this article.
Editor’s Note: In this series of articles, we include important or interesting Tweets, Articles, Video Clips with our comments. This is an article that expresses our personal opinions about comments made on Television, Tweeter, and in Print. It is NOT intended to provide any investment advice of any type whatsoever. No one should base any investing decisions or conclusions based on anything written in or inferred from this article. Macro Viewpoints & its affiliates expressly disclaim all liability in respect to actions taken based on any or all of the information in this article. Investing is a serious matter and all investment decisions should only be taken after a detailed discussion with your investment advisor and should be subject to your objectives, suitability requirements and risk tolerance.
1.Not about the Fed at all?
So all the talk about Fisher, Rosengren, Brainard was for nothing? That is too much of a jump. After all Dr. Brainard played a major role in taking down September rate hike expectations to low single digits. The supporting role was played by weak retail sales/industrial production and by worsening sentiment. David Rosenberg gave voice to the weakness on Friday:
- Survey says – We have been on the receiving end of two separate business surveys that both reveal a soft underbelly to the U.S. economy
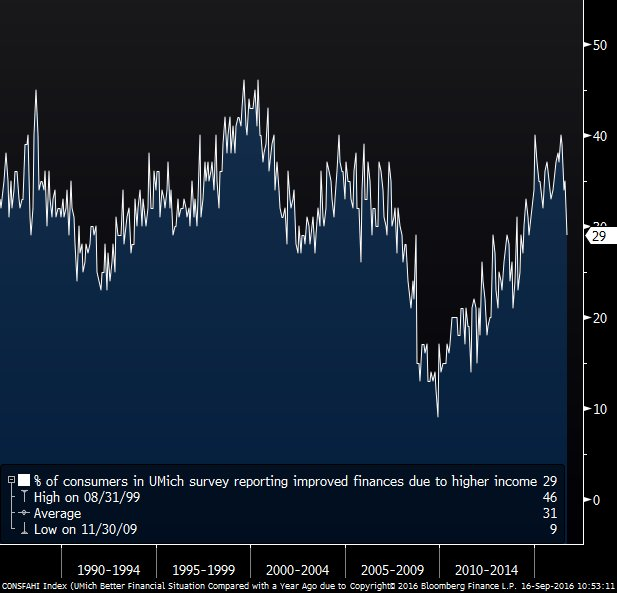
What about wages, the metric dear to Chair Yellen’s mind?
- Matthew B @boes_ – Consumers in the @UMich survey seem to really be souring on wages (biggest three-month drop in this # since Q4 2008)
Why would the Fed even consider raising rates in such an economy and with the election drawing even closer? The short end of the Treasury curve agrees. The 5-year yield fell 2.5 bps this week with the 3-year & 2-year yields falling by 2 bps & 1.6 bps resp.
So where is the nerve of markets? What created the maximum fear this week? It was the awful 30-year Treasury auction on Tuesday. Look at what happened when the results were announced a little after 1 pm on Tuesday and then look at the double bottoms/tops just after 3 pm.
VIX reached its peak of the week around 3 pm on Tuesday and closed the week down 12%. Kudos to those who sold vol on Tuesday afternoon:
- vader
@vader7x – selling some vol
The weekly peak in volatility on Tuesday afternoon suggests to us that the nerve of the markets lies in investor appetite of sovereign bonds, especially long duration Treasuries. We know that the 40-year JGB has been shot in the last few weeks. We know that German Bunds have been hit hard as well. But the safety of the world lies in stable appetite for 30-year US Treasuries. Because if investors turn their backs on the long end of the Treasury market, then goodbye to Market Chips.
What is the asset class most sensitive to bond appetite? Emerging Markets. So look at when emerging market equities (EEM) & sovereign debt (EMB) bottomed this week. 
We are reasonably sure the FOMC will do its part. Why? Because we trust Chair Yellen to favor discretion over valor. So why only “reasonably” sure? Because she faces a few Don Quixotes in the FOMC and because they all, including Chair Yellen, would love to raise rates next week to prevent another broadside from Donald Trump on Monday, September 26. However, a big sell off following a surprise rate hike on Wednesday would give much greater ammunition to Mr. Trump to attack the Fed. So we are reasonably sure Chair Yellen will do nothing and even speak dovishly on next Wednesday.
The real question is whether she will coordinate her message with BoJ’s Kuroda. Because the real danger to all global sovereign bonds lies in the market’s reaction to the BoJ meeting also on September 21. We have no clue and nearly zero empirical experience in the JGB market. So we make no comments about what Kuroda-san will say or do or how the Japanese bond market will react to that.
That brings us to the unique & pronounced action of the Dollar on Friday relative to the other asset classes:
DXY acted like the others until late Friday morning with its peak at about 3 pm on Tuesday and then baboom! What’s up with that?
2. TLT and High Yield
A brave soul stepped up during the tumult on Tuesday afternoon:
- RR Trades
@rr_trades –$TLT on bar 7 of a perfected daily#demark buy setup.RSI is extremely oversold. Near Brexit low from June (dbl btm). Maybe low on Thrus/Fri
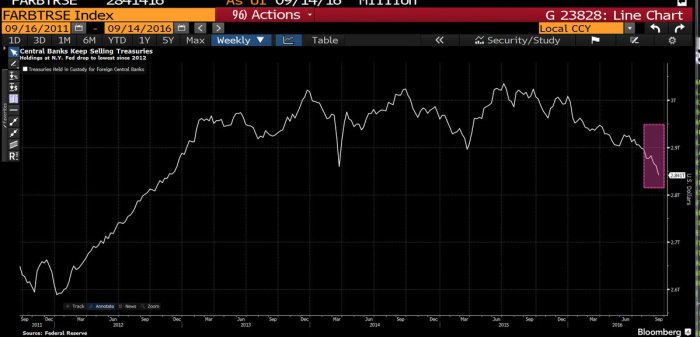
The positioning of some buyers seems suggestive of a bounce too:
- Lisa Abramowicz @lisaabramowicz1 – Foreign central banks have cut their Treasury holdings to the lowest since 2012.
Technicians like Mark Newton & Jeff DeGraff spoke against the guru-consensus that the lows in Treasuries are in. Paul Singer explicitly told the “Delivering Alpha” crowd:
- Looking ahead, Singer said that investors were being “very careless” about the threat of inflation. “There will come a time when inflation, despite growth-suppressive policies, can blow through targets and surprise everyone.” He recommended that investors sell long-term bonds
Jeff Gundlach has voiced a similar opinion with a target of 2% for the 10-year by year-end. That, as we understand it, was based on the Fed raising rates on Wednesday, September 21. Singer’s comments about inflation and the several warnings by Pimco about inflation seemed to come true this week with the PPI & CPI numbers. But, lo & behold, 30-year Treasury yield fell by nearly 4 bps on Friday instead of rising. What do they say about markets that don’t rise on good news, markets being the long duration Treasury yields?
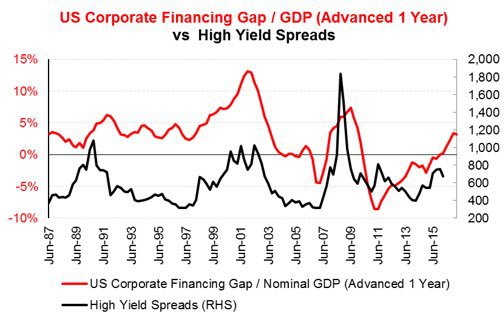
What about credit spreads?
- Worth W. Wray @WorthWray – “Every single leading indicator we have points to wider credit spreads.”@VrntPerception. http://tinyurl.com/h4pxhqz
Another way to say this is:
- Tom McClellan Retweeted – Jesse Felder
@jessefelder – High-yield bonds are pointing to a significant trend change for risk assets http://www.mcoscillator.com/learning_center/weekly_chart/mcclellan_oscillator_for_high_yield_bond_a-d_data/ … by@McClellanOsc
- When the High Yield Corporate Bond A-D Line crosses through a long trendline, it is a pretty darned good signal of a trend change. Some examples are shown in this … chart.
- This is important now because we have just seen such a crossing, this time below the rising bottoms line that dates back to the Feb. 2016 low. That line has been fairly authoritatively broken, and now this A-D Line is also threatening to close below its own 5% Trend (AKA 39-day EMA), an act which would add further confirmation of a trend change.
- High yield bonds had come back into fashion in 2016, as the central banks’ policies of zero or negative interest rate policy has pushed investors into more risky assets. The pendulum appears to be swinging back again, although it has swung really far already on the first push, as evidenced by the extremely negative McClellan Oscillator reading shown above. That says the initial down leg may have gone too far too fast all at once.
- But the broken uptrend lines says we are seeing a significant trend change getting started right now. Both messages are worth acknowledging.
3. Bill Miller Trade
- ValueWalk @valuewalk – Bill Miller’s Best Idea: Long S&P 500, Short 10-Year http://www.valuewalk.com/2016/
09/bill-millers-best-idea-long -sp-500-short-10-year/ … $SPY $SPX
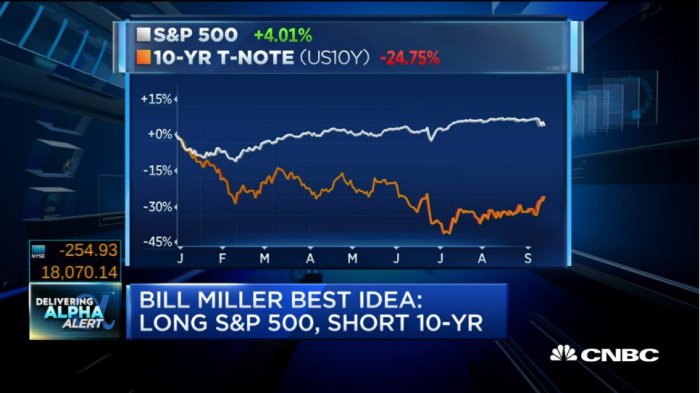
- One was September 2013. Remember Bernanke’s taper tantrum? SPY outperformed TLT by 14% from September 1, 2013 to December 31, 2013. Second was September 1987.
- The gap between SPY & long Treasuries reached its widest in October 1987 and then le deluge. The performance gap between SPY & the 30-year bond was already stretched too far by September and it broke in October 1987.
The big difference between both these years and now is the overwhelming reliance of both Stocks & long duration Treasuries on continued liquidity from not just the Fed but from the trio of Fed, ECB & BoJ. As we have seen this week, lack of appetite for long Treasuries creates an air pocket below stocks and credit.
So for the Bill Miller trade to work, the economy has to get into a higher gear and high yield has to rally. The economic data seems to be weakening and, as Tom McClellan points out, the A-D line of high yield bonds is breaking a long uptrend.
4. Volatility & Stocks
A prerequisite for the Bill Miller trade would be subdued volatility. That brings us to:
- Ryan Detrick, CMT @RyanDetrick – SPX w 1% moves 4 of past 5 days. As this shows, #volatility could just be getting started. https://lplresearch.com/2016/0
9/14/why-the-volatility-could- just-be-getting-
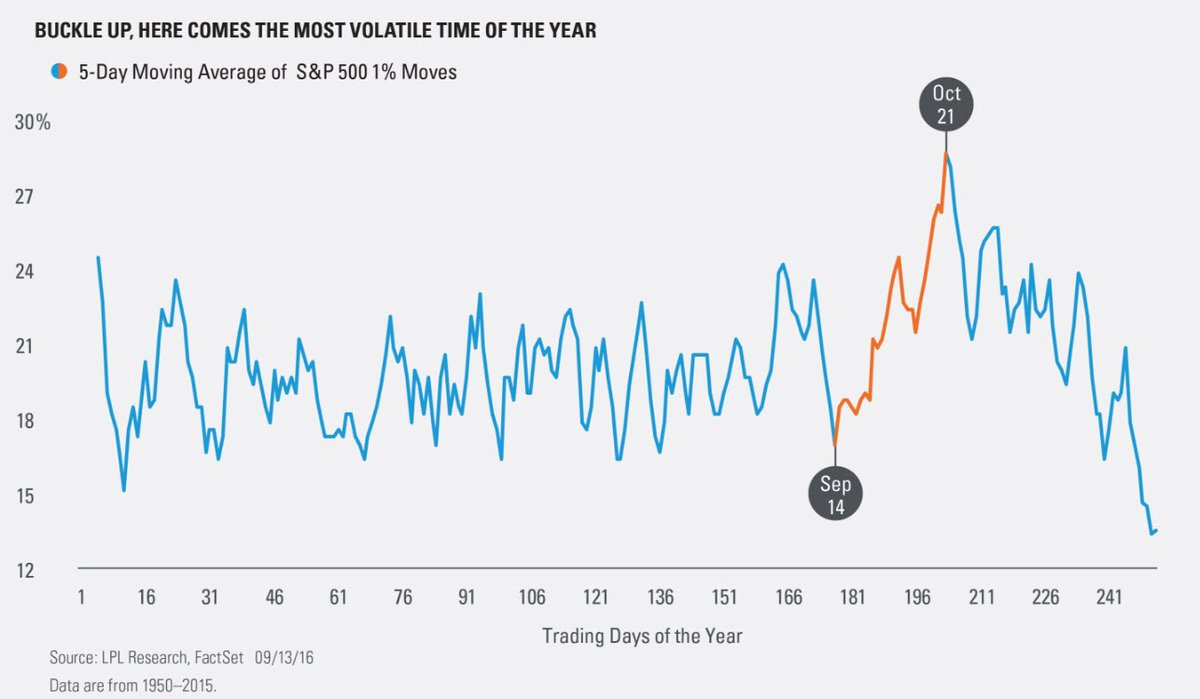
- Historically, this time frame is September 14 until October 21. In other words, the next five weeks are the most volatile time of the year and this recent volatility could only be getting started.
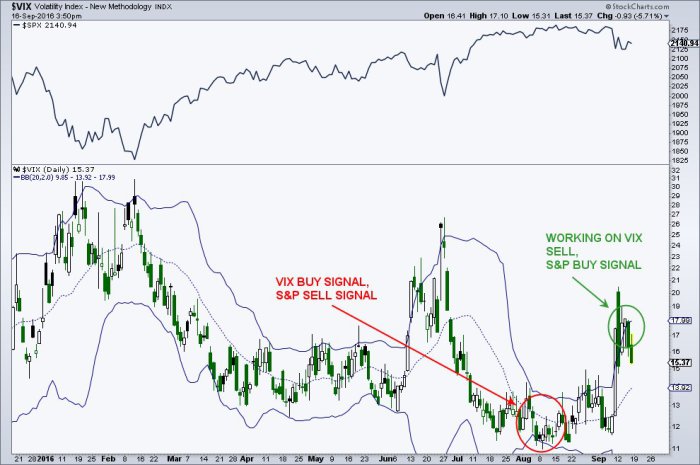
- StockTrader’sAlmanac @Almanac
Trader – S&P 500 down 22 of 26 during week after September options expiration, average loss 1.08% – Consistent with…
- Mark Arbeter, CMT @MarkArbeter – Updated Chart: Looks like we will get $VIX sell, $SPX buy signal at close. 3 day process.
5. Gold
Gold has traded both with volatility & the Dollar, Naturally Gold, Silver, & miners were all down on the week. So we don’t have much to say except look at an intermediate term indicator:
- Smaulgld @Smaulgld – India Heads into Gold Buying Season With Massive Pent-Up Demand
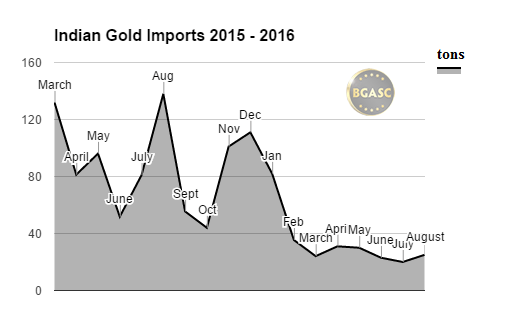
- “As India heads into its traditional fall gold-buying season there is probably enormous pent up demand. India relies almost entirely on imports to satisfy its gold demand. Gold imports into India in recent months have been down over 75%“.
That may well be the case but Indians are buyers on weakness. And the recent gold rally has kept them on the sidelines. Late October early November may be different. But we still feel that Gold is more dependent on global liquidity than fundamental demand. And Gold is going to the BoJ & Fed Wednesday oversold & sitting just above its 100-day.
Send your feedback to [email protected] Or @MacroViewpoints on Twitter