Summary – A top-down review of interesting calls and comments made last week in Treasuries, monetary policy, economics, stocks, bonds & commodities. TAC is our acronym for Tweets, Articles, & Clips – our basic inputs for this article.
Editor’s Note: In this series of articles, we include important or interesting Tweets, Articles, Video Clips with our comments. This is an article that expresses our personal opinions about comments made on Television, Tweeter, and in Print. It is NOT intended to provide any investment advice of any type whatsoever. No one should base any investing decisions or conclusions based on anything written in or inferred from this article. Macro Viewpoints & its affiliates expressly disclaim all liability in respect to actions taken based on any or all of the information in this article. Investing is a serious matter and all investment decisions should only be taken after a detailed discussion with your investment advisor and should be subject to your objectives, suitability requirements and risk tolerance.
1.Outcome vs. Process
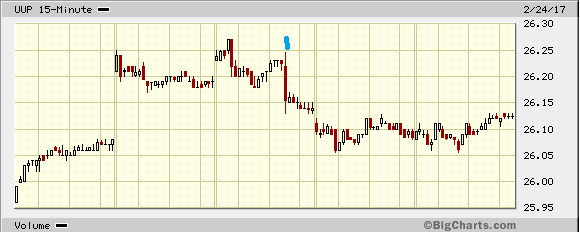
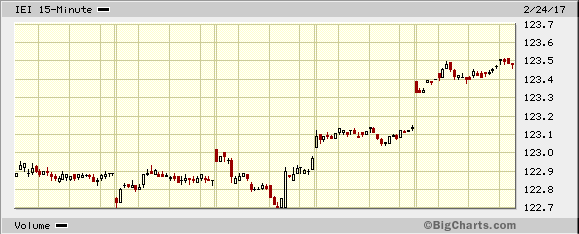
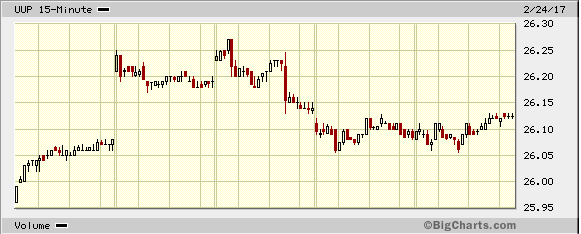
By process we mean reading the Fed statements or minutes and listening to the discussions on Fin TV about the Fed’s intentions. We have come to realize that much of that is pure speculation. We have begun ignoring this process & looking mainly at the outcomes, meaning the reactions of markets to the minutes or statements. That has worked better as it did on Wednesday afternoon. The discussions on Fin TV were non-conclusive & confusing while the outcomes were clear as crystal. Look at the 4 charts below.
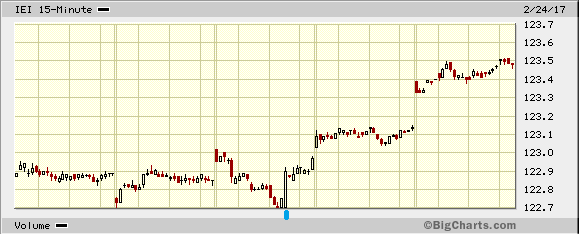
TLT IEI
GLD UUP
The market spoke clearly. Gold rose almost immediately after the Fed minutes and kept rallying the rest of the week. The Dollar fell almost immediately after the Fed minutes and kept falling until Friday afternoon when it rallied to close up. Both long duration yields & short duration yields fell almost immediately after the Fed minutes and kept falling the rest of the week. The 5-year yield fell 117 bps from just before the Fed minutes to the close on Friday.
Is this a Fed that is going to raise rates 13 trading days from today? The 5-year doesn’t think so. Gold rallied hard for the past two days to close up 1.8% on the week. Is this because the Fed is about to reduce liquidity? Gold says no. What about the fall of 10 bps in the 30-year yield post Fed minutes into the close on Friday? Is this an indication of a growthier economy with reflationary pressures? Not really.
The reaction in these markets was not just because of the Fed minutes. Steven Mnuchin, the Treasury Secretary, was just as responsible because of his doubling down on what the Fed minutes had suggested. He said that his aggressive target for Tax Reform was August 2017 and that would come after the Obamacare bill. He was even clearer in stating that the growth impact of his tax reform would not be felt until 2018 and that the 2017 economy was essentially Obama’s economy.
Poof went growth expectations and yields across the curve melted down with Gold spiking up. Yes, we hear that the Fed is almost gung-ho about raising rates 3 times this year and is signalling hard that the March 14 FOMC is a “live” meeting. Let us assume for the sake of hypothesis that the Fed does intend to raise rates 3 times this year regardless of what the markets are signalling. What would they cause? A more rapid steepening of the yield curve if the economy stays with a 2% handle.
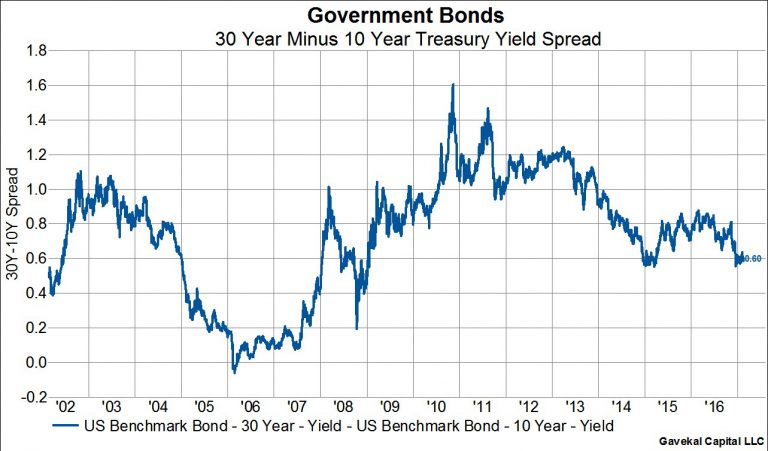
What about reflation? Just ask the 30-10 year yield curve, the best indicator of near term inflation pressures. Look what Gavekal said:
- “The spread between 30-year US treasuries and 10-year US treasuries has fallen to just 60 bps which is the smallest spread in about 2 years. The spread between 30-year bonds and 7-year bonds is down to 79 basis points, again basically at 2-year lows“
 But what about the remaining 1/3rd of the curve, the curve that the Fed influences?
- “What is interesting is that the spread between 10-year and 3-month bonds is well off the lows made in 2016. On 7/8/16, this spread was just 108 basis points. Today, it stands at 193 basis points“.
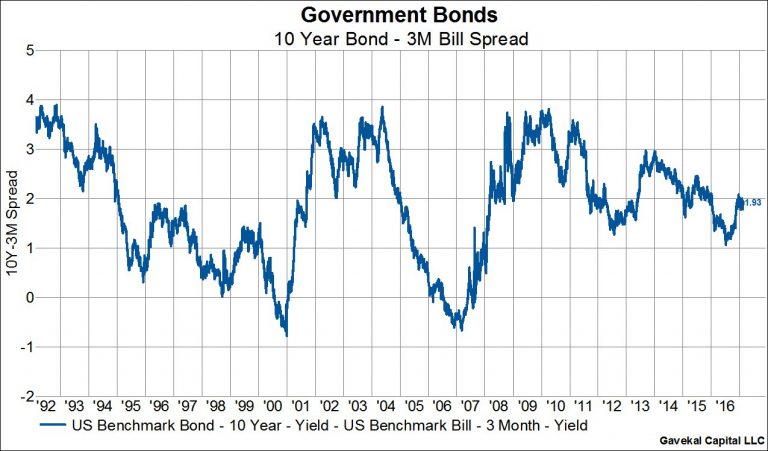 That means:
- “So since last summer the long-end of the yield curve has flattened by about 25 basis points while the front end of the yield curve has steepened 85 basis points“
Under these conditions, what would persuade the Yellen Fed to raise rates 3 more times in 2017? Only the prospect of a big deficit-destroying fiscal stimulus. But Secretary Mnuchin essentially dampened any prospect of that becoming effective in 2017 and he also said he will be meeting with Chair Yellen on a weekly basis. No wonder rates melted down on Thursday and Friday.
Of course, we could hear something totally different in the State of the Union speech on Tuesday evening. And the NonFarm payroll report could come in at 300K+ on March 10. And, of course, Chair Yellen could get uber-hawkish in her speech on Friday, March 3.
2. Treasuries & Bunds
German Bunds were the real stars of the week. The 30-year Bund yield fell by 13 bps; the 10-year Bund yield fell by 11 bps but the real star of stars was the 2-year Bund yield which fell 15 bps from minus 80 bps to minus 95 bps.
But given the Fed & Mnuchin triggers, we are not convinced that further declines in 2-year Bund yields are necessary for Treasury yields to decline. Already, the 2-year Treasury-Bund spread is 210 bps, a fearful number.
- Lawrence McDonald
@Convertbond – Would you Buy or Sell this stock?#ReflationTradeUnwind
 On the other hand,
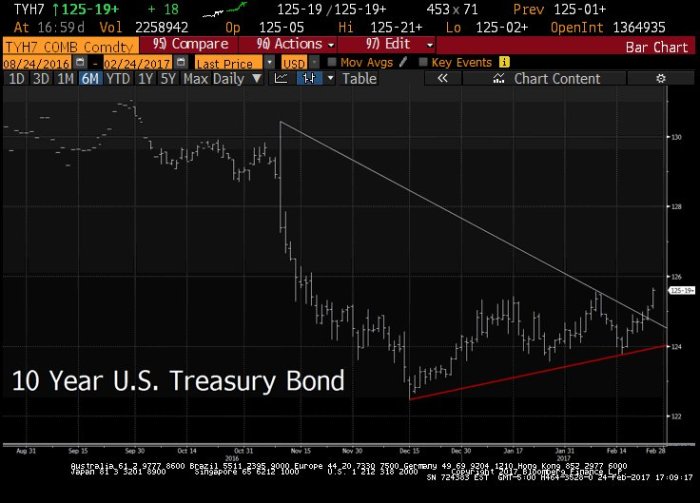
- Dana Lyons
@JLyonsFundMgmt – This is where yields should hold…IMO ~2.31% 10-Year$TNX$IEF
But what if 2.30% doesn’t hold? Can 2% on 10-year yield be far behind?
3. 1987-Stocks-Credit
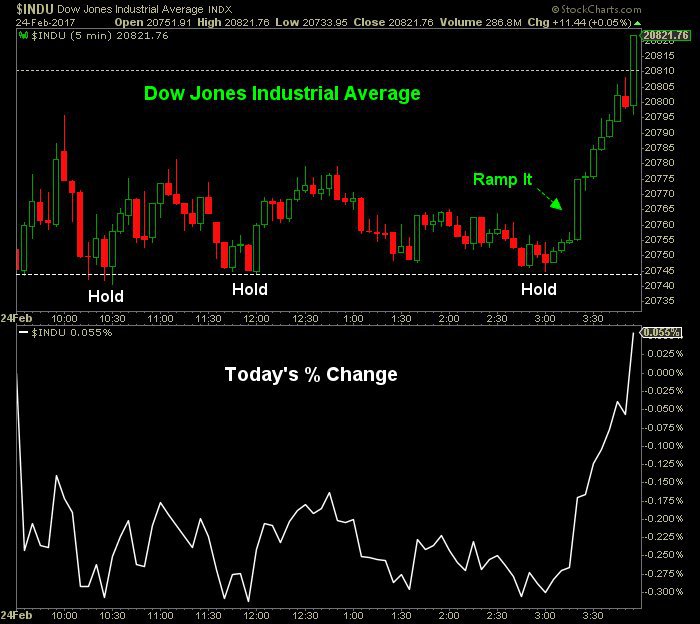
A lot of 1987 analogies this week, thanks mainly to the 11-day streak of positive Dow closes. The all-time record is 13 straight up days from January 2 to January 20 in 1987. Last week we felt as if Dow 21,000 was at hand. Breaking the 1987 record 13 straight up days should get us there by Wednesday. That would also mean a 21-day move from Dow 20,000 to Dow 21,000, twice as fast as the 42-day move from Dow 19,000 to Dow 20,000. And credit for that would go to the last 40 minutes this Friday:
- Charlie BilelloVerified account
@charliebilello – If we go on to break the record from 1987, today at 3:30pm was the Miracle on Ice moment. Slow clap…
Another parallel to January 1987 comes from:
- Bianco Research, LLC
@biancoresearch – The last time the Stock Market Newsletters were this Bullish was Jan. 1987, 30 years ago
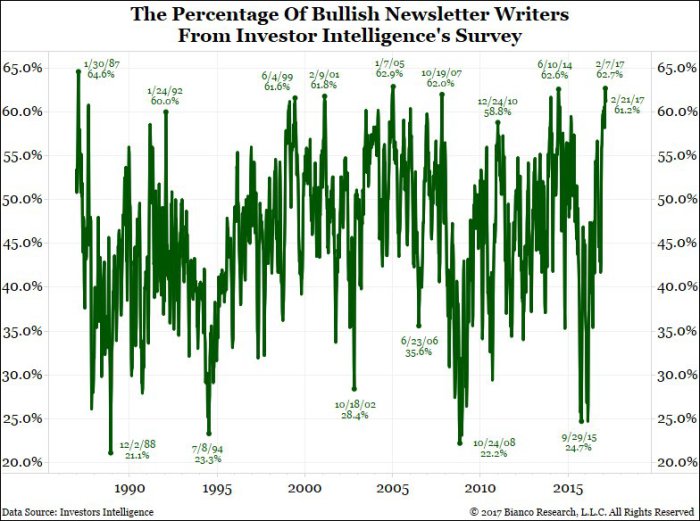 Those who fear the 1987 comparison should remember that the January-August 1987 period was one to celebrate. So far, the stock market hasn’t given us any of the divergences that 1987 provided. The biggest then was the steep divergence between the rising stock market and the falling 30-year Treasury bond. Interest rates began rising in April, 1987 and kept going up as the stock market kept going up.
Falling Treasury yields can actually become supportive of the stock market as long as credit spreads don’t shoot up. And credit spreads are actually shooting down:
- Charlie BilelloVerified account
@charliebilello – US Investment Grade credit spreads hit a 28-month low: 123 bps.$LQD
- Charlie BilelloVerified account
@charliebilello – High Yield credit spreads hit a 30-month low: 377 bps.$HYG https://pensionpartners.com/when-to-fear-high-yield/ …
- Charlie BilelloVerified account
@charliebilello – Emerging Market High Yield credit spreads are at their tightest level since October 2007: 457 bps.$EMHY
So it may be premature to worry about the end result of 1987. But 2011 may be another story. Why that year? Look at the chart below:
- Urban Carmel@ukarlewitz – Feb 22- When $SPX up in both Jan + Feb, it’s up the full year 27 of the past 27 times since 1945 by avg 24% (from CFRA)
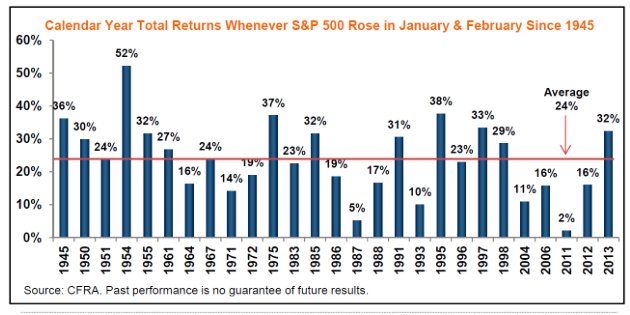 So would Europe be the catalyst for a sudden, fast correction as in 2011? Or would it be China as in 2015?
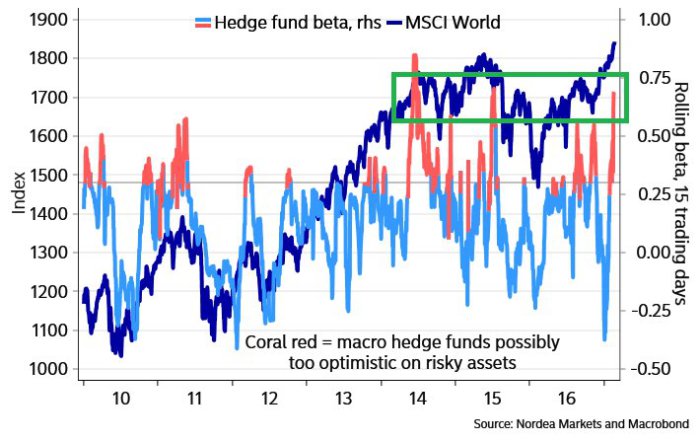
- Martin Enlund
@enlundm – Macro hedge funds finally all-in equities. Most long since July 2015. Back then, China-induced sell-off followed.
 After all of this, we still fall back to the boring but sound stance of Lawrence McMillan:
- “In summary, we may soon see sell signals from some overbought indicators. But we’ve seen that before, and it wasn’t enough to stop the rally. We would need to see $SPX break support and $VIX break out over resistance before we would abandon our current intermediate-term bullish outlook”
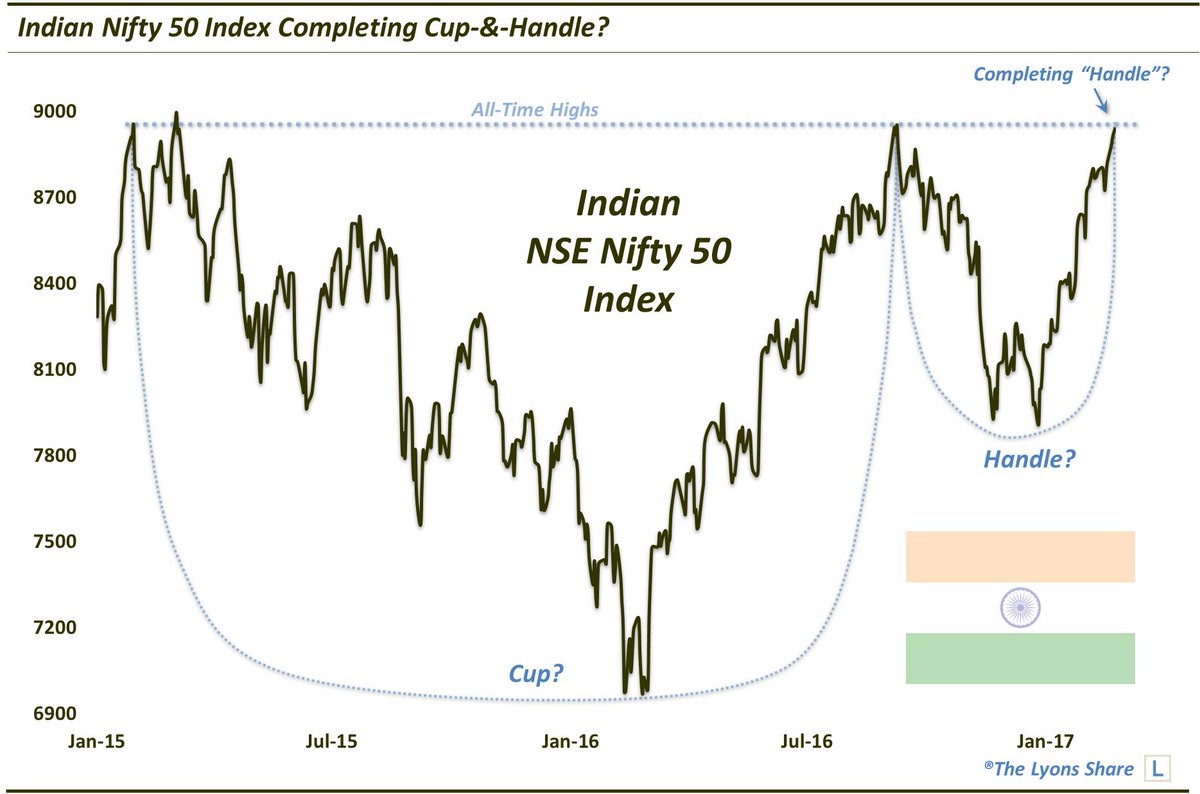
EM commodity markets got rocked on Thursday & Friday but one non-commodity EM market did OK and may do better, ideally after a consolidation, because of a completed cup & handle pattern:
- Dana Lyons
@JLyonsFundMgmt – ICYMI>ChOTD-2/24/17 Indian Stocks In Position For Next Big Advance?$INDY Post: https://lyonssharepro.com/2017/02/indian-stocks-in-position-for-next-big-advance/ …
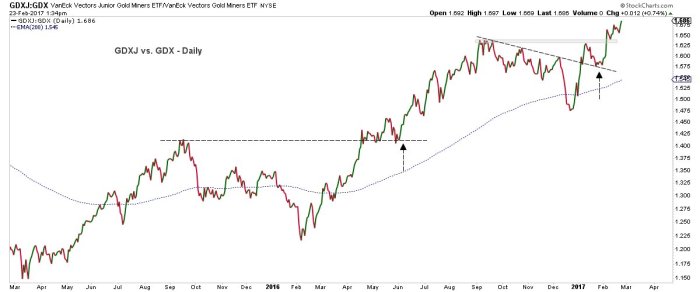
4. Gold & Miners
The week’s best performance came from Gold & Silver which were up 1.8% & 1.9% resp. Then why were GDX & GDXJ down 2.1% & 2.5% on the week? We don’t have a clue & we couldn’t find any one who could explain why. On the other hand, Gold’s action on Thursday & Friday won over many.
- Greg Harmon, CMTVerified account@harmongreg – Gold is Ready for Liftoff – Dragonfly Capital http://dragonflycap.com/gold-i
s-ready-for-liftoff/ … $GLD $GC_F

The miners may have sold off this week but their ratio is still bullish for gold:
- 3D Research@WhatILearnedTW – Feb 23 – GDXJ vs. GDX, often a leading-indicator for #gold and the #miners, is trading at new bull-market highs #WILTW
5. Oil
We really have no clue about how Oil trades and why it does the way it does. Energy stocks are usually easier but are they giving a false signal now? That is not our question but a question posed by Chris Kimble:
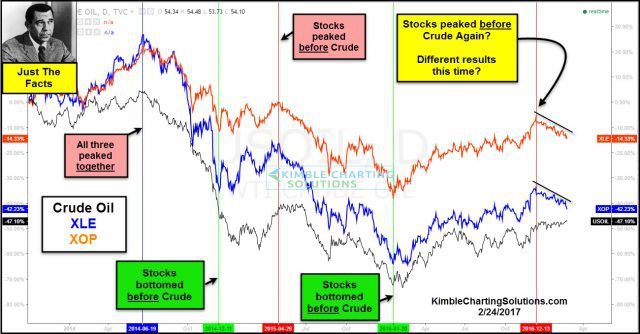
- At this time the intermediate trend in Crude Oil is up, as it has rallied the past year, creating a series of higher lows and higher highs. Since the highs in 2014, Crude remains at much lower levels.
- Joe Friday Just The Facts; Majority of the time since 2014, XLE & XOP have peaked or bottomed “before” Crude Oil! Of late XLE and XOP have negatively diverged against Crude Oil, creating a series of lower highs.
- Crude could be forming a bullish inverse head & shoulders pattern. Maybe that is the reason that Crude Oil traders, have established the largest bullish trade in it’s history. Last time the bullish bet on Crude Oil was this high, was at the highs back in 2014.
- Are XLE & XOP giving false signals this time?
Send your feedback to [email protected] Or @MacroViewpoints on Twitter