Summary – A top-down review of interesting calls and comments made last week in Treasuries, monetary policy, economics, stocks, bonds & commodities. TAC is our acronym for Tweets, Articles, & Clips – our basic inputs for this article.
Editor’s Note: In this series of articles, we include important or interesting Tweets, Articles, Video Clips with our comments. This is an article that expresses our personal opinions about comments made on Television, Tweeter, and in Print. It is NOT intended to provide any investment advice of any type whatsoever. No one should base any investing decisions or conclusions based on anything written in or inferred from this article. Macro Viewpoints & its affiliates expressly disclaim all liability in respect to actions taken based on any or all of the information in this article. Investing is a serious matter and all investment decisions should only be taken after a detailed discussion with your investment advisor and should be subject to your objectives, suitability requirements and risk tolerance.
1. Come in threes?
Remember the tweet we featured two weeks ago:
- SentimenTraderVerified account @sentimentrader – No worries – bond and stock volatility just hit an all-time low ahead of the Fed meeting.
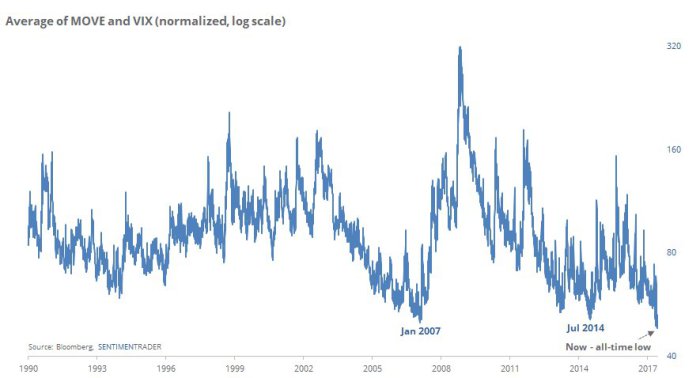
The chart doesn’t depict it but the first one to jump was currency volatility. But bond & stock volatility remained dormant till the beginning of this week. Then bond volatility jumped. And the place where it jumped was the same place where the Euro jumped. The catalyst was a speech by Draghi in which he said “deflationary forces have been replaced by reflationary ones.” That did it and the next day’s attempt to take back the damage was rejected by government bond markets.
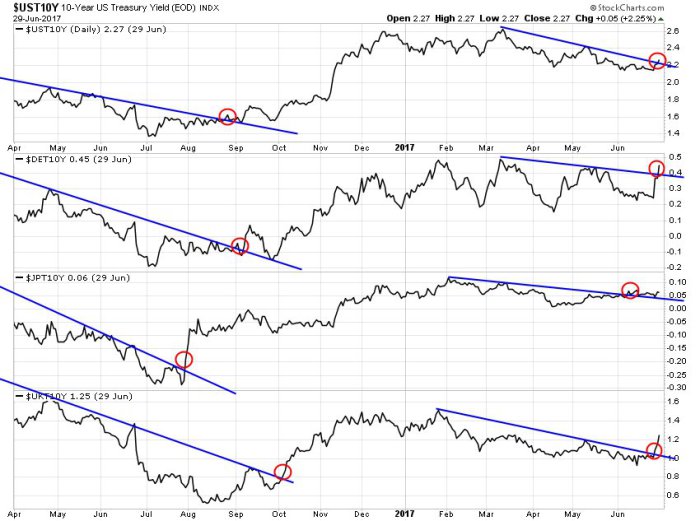
How forcefully was it rejected? German 10-year Bund yield exploded by 22 bps this week. The US 10-year yield followed by rising 15 bps. And the US 10-year yield broke through its 200-day moving average.
- Jeffrey GundlachVerified account @TruthGundlach – Outside week for US 10-year yield. Lower low than last week’s hit intraday Monday, then higher highs each day ending in weak close. Bearish!
- Jeffrey GundlachVerified account @TruthGundlach – US 10-year yield above 200-day moving average, broke downtrendline from March. Critical level now 2.32%, probably coincides with 0.50% Bund.
The key level for Rick Santelli was 2.27-2.29% for the 10-year yield. Friday was a weekly close breach of that level. What if the 10-year yield breaks Gundlach’s 2.32% level next week?
What Draghi & Carney intended to do we don’t know. But the results are for all to see:
- Jesse Felder @jessefelder – Global sovereign yields:
Remember how every one was so concerned last week about the relentless flattening of the 10-2 year curve? The curve took care of that concern by bear-steepening by 11 bps this week. So how did the 2-year yield behave?
- Jeffrey GundlachVerified account @TruthGundlach – Two year US Treasury yield at an EIGHT YEAR high, AND above the 1Q 2008 rally pivot point. Very hard to find a bull case for that puppy!
Among all of this, there was a divergence that no one commented on. While the 10-2 year curve steepened by 11 bps this week , the 30-5 year curve didn’t steepen at all and, lo & behold, the 30-10 year curve actually flattened by 4 bps. What gives? And while the 10-year yield broke decisively broke above its 200-day moving average, the 30-year yield remained below its 200-day and the TLT remained above its 200-day.
So the entire action was between the short end and the 10-year but not much beyond. Nothing is as sensitive to inflationary expectations as the 30-year yield & reflationary periods are characterized by steepening of the 30-10 year curve.
Does that mean the action this week had nothing to do with inflation and everything to do with Central Banker rhetoric? And if that is the case, is this steep rise in yields artificial & more about position squaring than fundamental?
Next week should prove really important both technically & fundamentally. If the NonFarm payroll report comes in strong, then rates along the entire curve should rise hard & what happened to the 10-year yield this week should happen to the 30-year yield next week.
In that case, will stock volatility jump to follow the rise in currency & fixed income volatilities? Have we already seen a dry run this week, not in the broad market, but in the leading sector?
- Jeff Kilburg @jeffkilburg – June 29 – The market is conditioning us to 100 handle moves in the #Nasdaq $QQQ This is a #hUge pick up in realized volatility specific to #Naz
- John Bollinger @bbands – June 29 – Another volatility event in the US stock market. At the lows S&P -1.4%, VIX +51.1%. This is going to get out of hand one day.
The “one day” qualifier of John Bollinger could be key. Because a strong but not too strong NFP number may stabilize the S&P and continue the rotation we saw this week into cyclical & beaten up sectors.
And that would mean:
- J.C. Parets @allstarcharts I don’t know about you guys, but this is how I answer the Stocks vs Bonds question right now:
$SPY$TLT
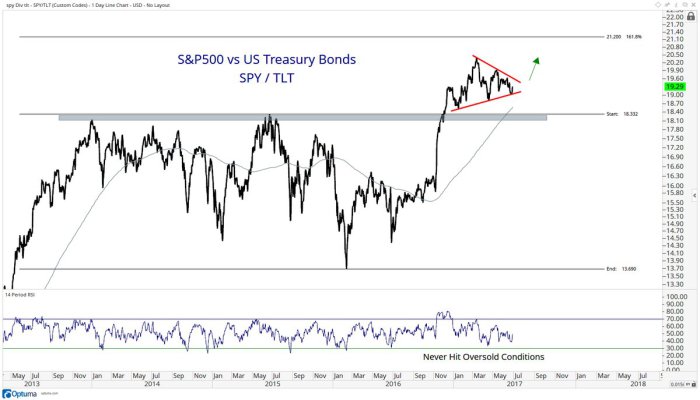
As we recall, the last leg of a bull market has often been marked by a S&P rise accompanied by a sell off in Treasuries and a rise in high yield credit. That is what happened in 2007 & in 2000 and it happened big time in Q3 1987. Coincidentally both HYG & JNK, US high yield ETFs, outperformed SPY by about 100 bps and blew away TLT by 300 bps this week.
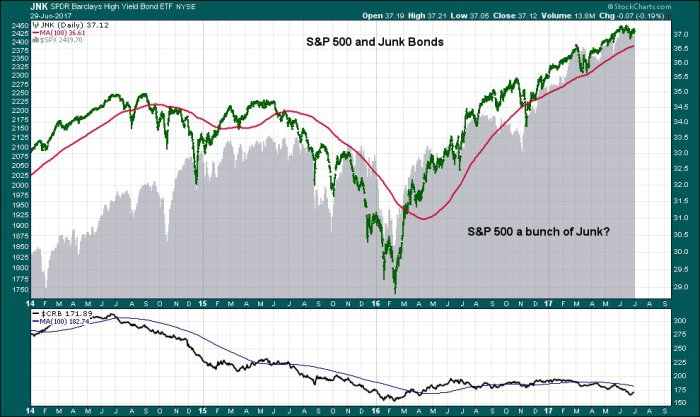
- David Larew @ThinkTankCharts Junk Bonds – Junk Bonds have never looked better LOL – needs a Bull-ard 2% growth to keep this going and oh yeah, Fed support
On the other hand, a leadership change rarely takes place within the S&P without a correction. So is a correction likely soon or is this reflation trade a temporary bounce in beaten-up sectors? We should get a clearer picture next week with important economic data including the payroll report.
Things do come in threes & so stock volatility should explode to join currency & Treasury volatility. But when? That’s why smart gurus like John Bollinger only say “some day”.
2. US Stocks
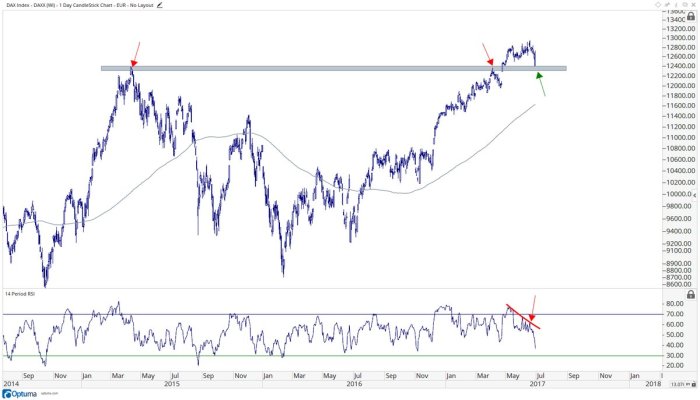
Since the currency & fixed income volatility began in Europe, should we first look at the DAX?
- J.C. Parets @allstarcharts I would argue that this is an extremely important retest of a breakout, for both European stocks and stocks as an asset class
$DAX
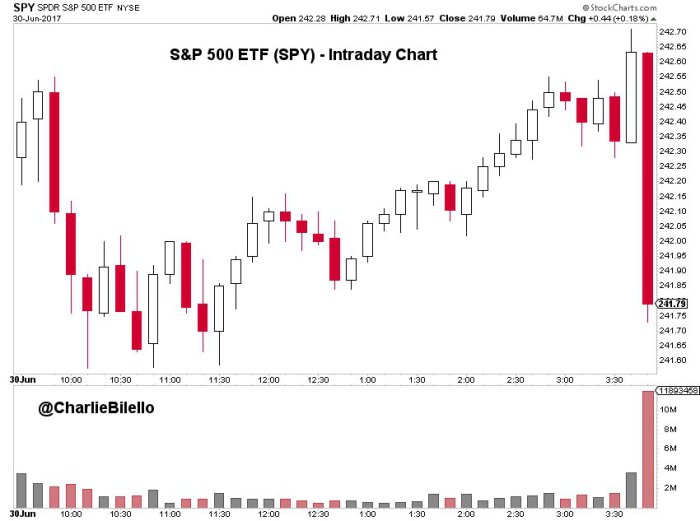
The S&P rallied into the close the week. But was that a real bounce from Thursday or was it mainly window dressing for the month & quarter? Does the fall at Friday’s close tell us anything?
- Charlie BilelloVerified account @charliebilello 3 hours ago- Been a while since we’ve seen a candle like that to end the day. I’m sure it’s nothing, just
@RampCapitalLLC hitting the golf course early.
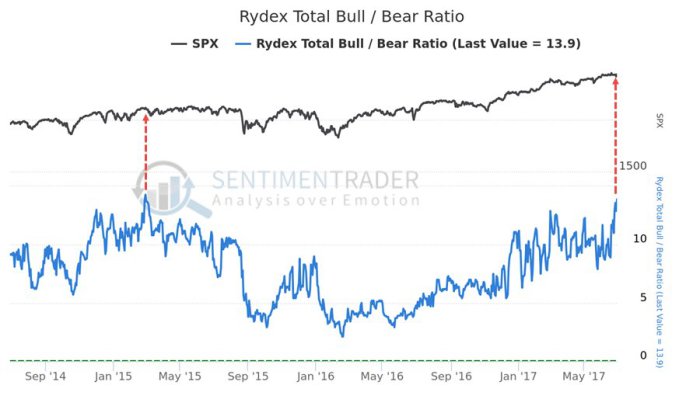
Has the hard selloff in FANG stocks & Semis done anything to sentiment?
- SentimenTraderVerified account @sentimentrader Rydex mutual fund traders have been more bullish on stocks only once before, March 2, 2015.
$SPX
But what about the longer view? Dragonfly Capital is decidedly bullish:
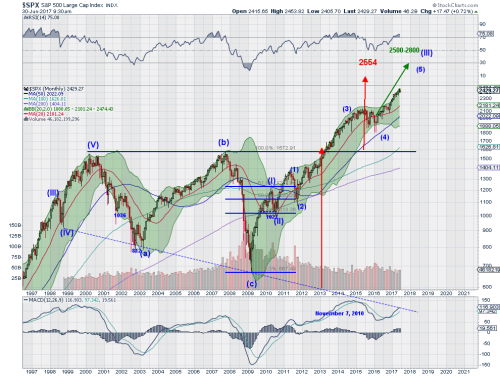
- “The monthly chart has two major patterns working out. The first is a simple triangle break to the upside. This pattern gives a target to 2554 on the S&P 500, still 100 points above the all time high. The second, an Elliott Impulse Wave, is a bit more complicated. The V Wave pattern started with the low in 2009. It made the smaller I Wave in early 2010 and pulled back to II later that year. Since then it has been building Wave III, typically the largest Wave. At the sub-level down it is building Wave 5 of Wave III, with a target between 2500 and 2800. … The big picture looks just fine right now”
The big story of the week has been the rapid rise in Treasury & Bund yields. So could there be a connection between Treasury & Bund yields and the US stock market. Yes writes Tom McClellan in his article Treasury-Bund Spread Gives Early Warning of the End. Don’t let the word “End” worry you. It is a distance away according to Mr. McClellan:
- This spread [between 10-year Treasury yield & 10-year Bund yield] peaked in May 1999, 7 months ahead of the DJIA’s Dec. 1999 peak, and 10 months before the SP500’s March 2000 top. The lead time was even longer ahead of the 2007 top. … Another peak in the Treasury-Bund spread arrived in April 2010, which was just a month ahead of the infamous Flash Crash, but 12 months ahead of a more significant top which came in April 2011.
- Now most recently, we have a peak in this spread in Dec. 2016, and only now in May and June 2017 is it really starting to decline. So we are likely still a year or more away from a final price top for the stock market. A top in mid-2018 fits well with the expectation offered by crude oil’s 10-year leading indication.
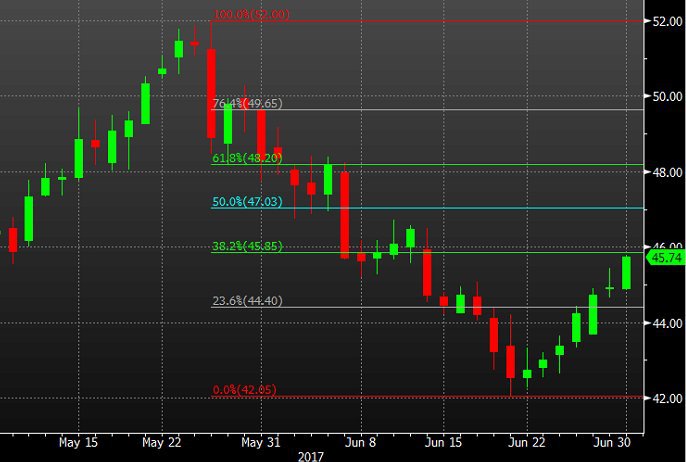
3. Oil
Oil was up 7% this week, a big rebound from its low of last week. Both USO & BNO rallied about 7% this week. It is now close to an important level:
- ForexLive @ForexLive – WTI now just shy of the 38.2% retracement of the May/June slump http://bit.ly/2s9D8Be
But both OIH (up 2.1%) & XLE ( up 75 bps) severely under performed Crude Oil on the week. That does not seem to be a particularly positive sign.
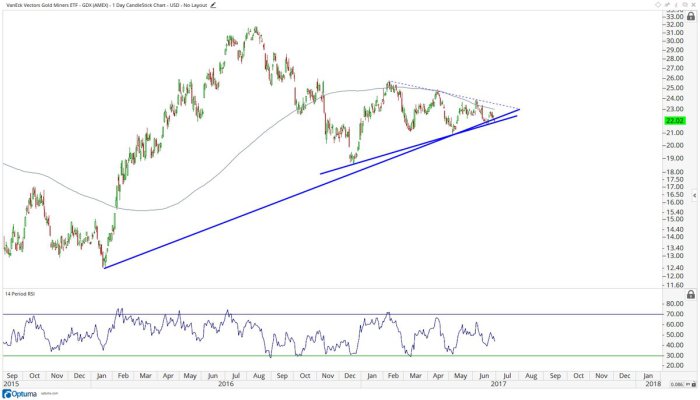
4. Gold
How could Gold rally when yields on sovereign bonds are shooting up? Unlike oil stocks, the performance of Gold Miners was rational. GDX fell by 3% as Gold fell by 1.2%.
- J.C. Parets @allstarcharts Gold Miners are flirting with disaster here imo. if this breaks it could be game over
$GDX
Next Friday could be a fun day.
Send your feedback to [email protected] Or @MacroViewpoints on Twitter