Summary – A top-down review of interesting calls and comments made last week in Treasuries, monetary policy, economics, stocks, bonds & commodities. TAC is our acronym for Tweets, Articles, & Clips – our basic inputs for this article.
Editor’s Note: In this series of articles, we include important or interesting Tweets, Articles, Video Clips with our comments. This is an article that expresses our personal opinions about comments made on Television, Tweeter, and in Print. It is NOT intended to provide any investment advice of any type whatsoever. No one should base any investing decisions or conclusions based on anything written in or inferred from this article. Macro Viewpoints & its affiliates expressly disclaim all liability in respect to actions taken based on any or all of the information in this article. Investing is a serious matter and all investment decisions should only be taken after a detailed discussion with your investment advisor and should be subject to your objectives, suitability requirements and risk tolerance.
1. The Good, the Bad & the Ugly – “those who dig”
Those who dig included a set of one in that iconic movie – Duco. That film & its dialogues are usually the province of simple & decidedly non-intellectual folks like us. That is another reason this Friday was so different. The case of Flynn being Duco was made on Friday by the uber intellectual Jonathan Turley with the highbrow title of Professor of Law at George Washington University. His article on thehill.com was titled The Good, the bad and the ugly of Michael’s Flynn’s guilty plea. We read about this in a Bill O’Reilly tweet and we concur with him about this article being a good read.
The ugly case concisely explains the near instantaneous fall to -350 of the Dow on Friday. The bad case is good in that it makes you understand why the decline stopped. And the good case by itself can explain why the Dow erased much of the ugly decline. In fact, Prof. Turley describes Friday’s action as a “serious downgrading” of the Russian investigation. Why?
- “This is a single count of making a false statement not a count of conspiracy or computer hacking or bribery connected to the Russians.”
Our belief has been that there just isn’t anything serious in this stuff that might affect President Trump. And that has actually been reinforced by Friday’s plea action of Michael Flynn. Remember it was Duco who dug the grave, not Blondie. The bad “AngelEyes” died and Blondie won.
The above is a “fundamental” explanation. A simple market explanation was provided by Art Cashin who said that all the underlying bids were pulled the moment the Flynn news broke. That drove the decline. But when sellers did not materialize, the decline was reversed.
Linking this back to the “fundamental” case, if sellers believed the good case above, then why would they or anyone of size sell this year & miss the proverbial year-end rally AND also miss the benefit of lower tax rates in January? May be that’s why the stock market comeback took force when Senate Majority Leader McConnell came & said they have the votes to pass the tax bill.
The selloff on Friday was the second fast & hard selloff of this week, a week in which the Dow rallied by 674 points (up 2.9%) to a new all-time record. What about Wednesday’s selloff in FANGs & Semiconductors? To quote Tom McClellan,
- “The high volume in QQQ was a sign of a concentrated moment of panic, which evidently washed itself out all at once.”
If he is right, then Friday’s summary of Lawrence McMillan makes sense:
- “In summary, there is a lot going on right now, but the main thing to consider is that the $SPX chart is positive and will remain so unless support levels are broken. The first of these is at 2600 (see Figure 1). Furthermore, the trend of $SPX is strongly higher. It has only closed below its rising 20-day moving average one time since last August! Yes, there are overbought conditions and they are going to produce some short-term sell signals. We will not ignore any signals since one never knows when a change of trend will happen, but for now it certainly appears that any sell signals would only have a short-term effect. The intermediate-term trend is positive as long as the $SPX chart is bullish.”
So how far could the S&P go in the intermediate term? Below is one opinion:
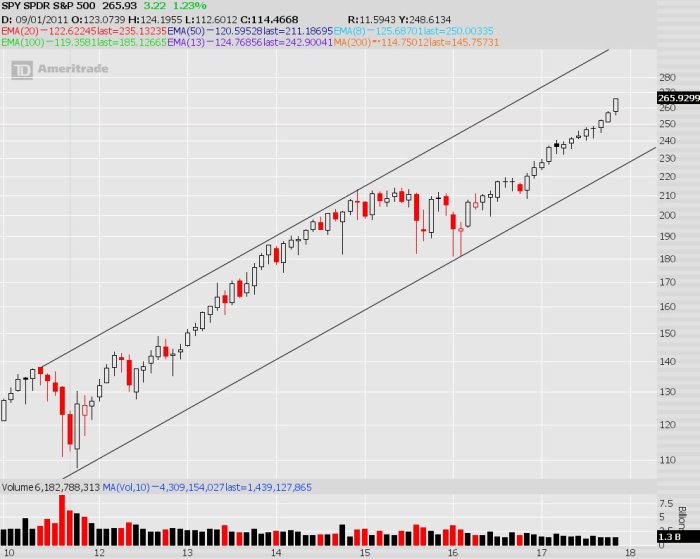
- Joe Kunkle @OptionsHawk – $SPY …210 breakout measured move remains 290…and aligns where this channel would likely bump into resistance
2. Not so fast …
This is not as famous as the quote above about Duco. But all college football fans know this line of Coach Lee Corso. And that is what a number of gurus we follow would say to the exuberance of Section 1 above. A few of these below:
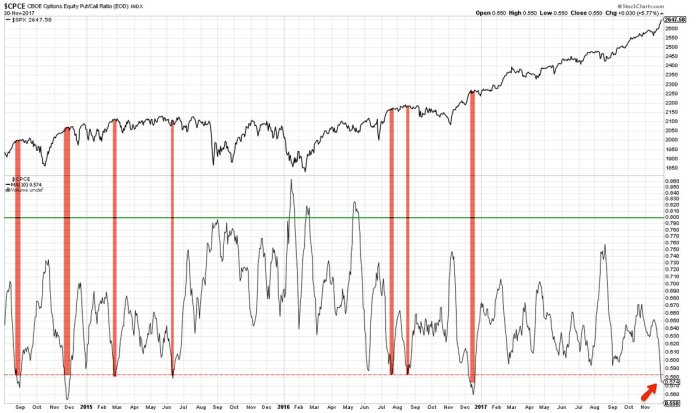
- Urban Carmel @ukarlewitz – 10 day equity put/call at 1 yr low. Preceded last December’s 1.5% pull back and a flat period lasting to late January. Generally, not a lot of upside $SPX
 What about Trend exhaustion?
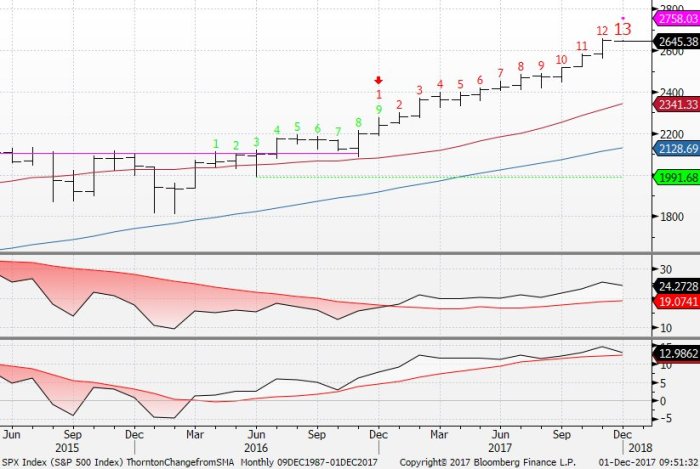
- Thomas Thornton @TommyThornton – As we have been anticipating for months on Hedge Fund Telemetry… $SPX monthly DeMark Sequential upside red 13 exhaustion triggered today.
And what has been the track record of these signals?
- Thomas Thornton @TommyThornton – There have been 7 monthly upside $SPX DeMark exhaustion signals. 6/7 worked since 2005. Forward 2-6 month returns -6%, -7.5%, -20%, -19%, -5%, -9%.
Last week, we featured the “1/2 short AMZN position” tweet of @TommyThornton based on DeMark exhaustion signal. That worked well this week.
Last week we also featured a cautionary tweet about red hot semiconductors. That caution of @PeterGhostine paid off this week. Did we see anything cautionary about this week’s white hot sector?
- Mark Newton @MarkNewtonCMT – Transports still lower by 0.80% today after having rocketed back to near upper channel resistance, which looks to be important
![]() What about a red hot overseas market?
What about a red hot overseas market?
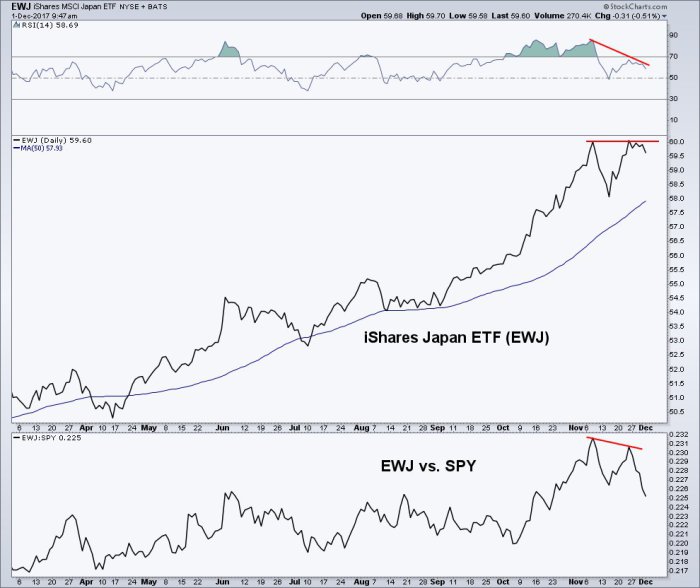
- Andrew Thrasher, CMT @AndrewThrasher – Japanese equities seeing bearish divergence in momentum and relative performance w/ a potential double top on the daily chart of $EWJ
 Not only did high flying Nasdaq 100 underperform S&P this week, Emerging markets gave up weeks of out performance in this one week. Against a 1.5% rally in the S&P, EEM fell by 3.6%. Brazil, China and India all suffered badly.
All this also raised a question about a European leader:
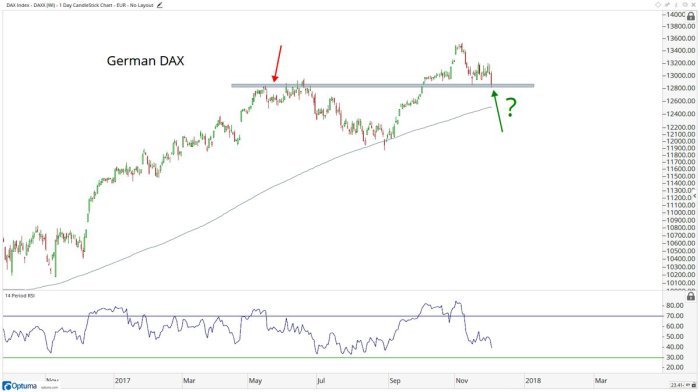
- J.C. Parets @allstarcharts – is former resistance in German Stocks going to turn into support? $DAX
3. Treasuries
The 2-year yield broke above 1.81% on Friday almost dragging the 3-year yield close to the dreaded 2% level mentioned by Jeffrey Gundlach. The 10-year yield had broken past the 2.42% level when Flynn news broke. As the Dow tumbled, so did Treasury yields. The 10-year yield dropped to 2.32% below last week’s low before recovering to 2.37% at the close.
As stocks recovered, so did Treasury yields. But stocks closed near the high while Treasury yields closed nearer the lows of the day. One saw this as a question about the uptrend in yields:
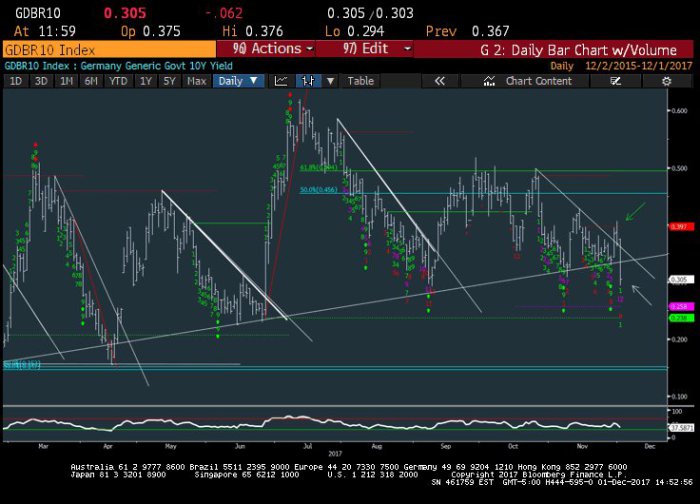
- Mark Newton @MarkNewtonCMT – #Bund and Gilt yields along w/ #Treasuries experienced a fairly wild about-face which certainly has not been recouped, casting doubt on recent breakout attempts for yields $TNX
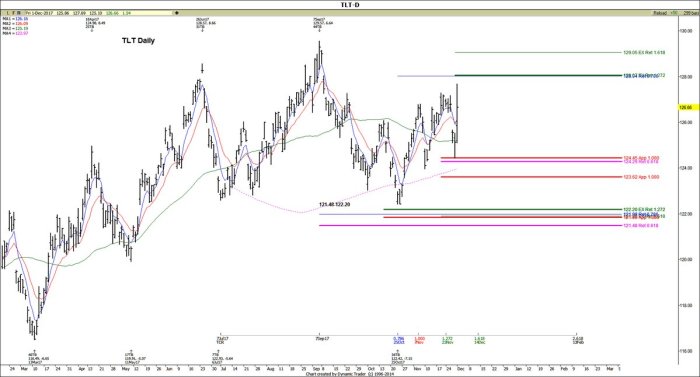
Yields along the 2-10 year curve rose by about 3-5 bps on the week but the 30-year yield closed unchanged. What did one say about the action in TLT?
- Carolyn Boroden @Fibonacciqueen – $TLT held that zone beautifully…128.07 is target 1 if we get the full move…you already got a big piece of it!
 What about our ‘inexorable force”? The rise in the short end & in the belly of the curve has indeed been inexorable. This actually feels like the action in 2013 & post election action in 2016. In both cases, the inexorable rise in yields in Q4 led to a big buying opportunity in January of the following year.
Is there anything in the economy that suggests a repeat of 2013-2014 & 2016-2017?
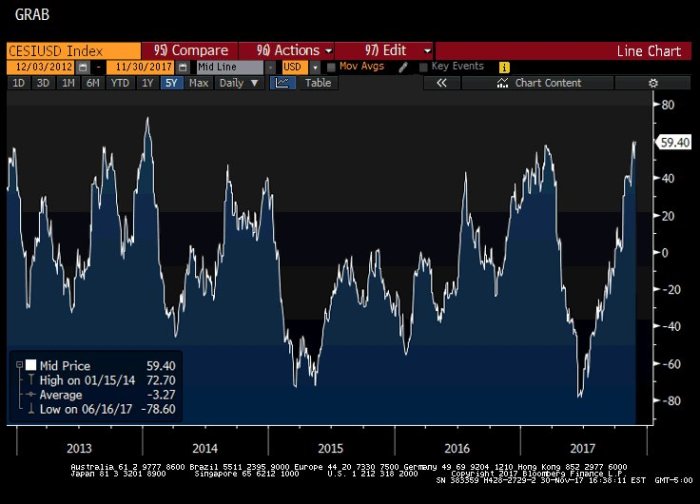
- steph pomboy @spomboy – Hmmmm…. i wonder what direction this will go next? (Citigroup Economic Surprise Index)
4. Current Cross-Asset bet
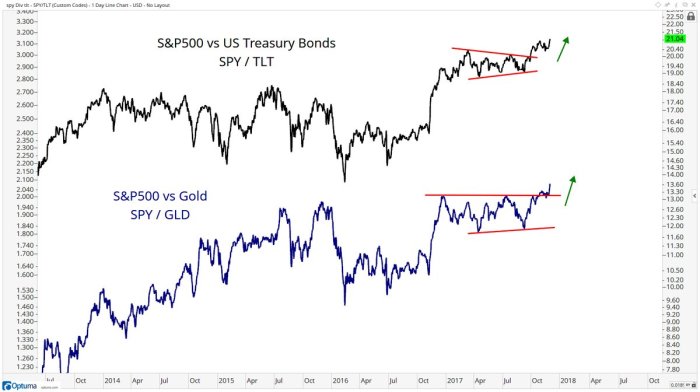
- J.C. Parets @allstarcharts – Here’s the S&P500 breaking out of a huge base relative to Treasury Bonds while the S&P500 is also breaking out of a huge base relative to Gold. Am I the crazy one? Do you guys see something different? $GLD $SPY $TLT
Send your feedback to [email protected] Or @MacroViewpoints on Twitter