Summary – A top-down review of interesting calls and comments made last week in Treasuries, monetary policy, economics, stocks, bonds & commodities. TAC is our acronym for Tweets, Articles, & Clips – our basic inputs for this article.
Editor’s Note: In this series of articles, we include important or interesting Tweets, Articles, Video Clips with our comments. This is an article that expresses our personal opinions about comments made on Television, Tweeter, and in Print. It is NOT intended to provide any investment advice of any type whatsoever. No one should base any investing decisions or conclusions based on anything written in or inferred from this article. Macro Viewpoints & its affiliates expressly disclaim all liability in respect to actions taken based on any or all of the information in this article. Investing is a serious matter and all investment decisions should only be taken after a detailed discussion with your investment advisor and should be subject to your objectives, suitability requirements and risk tolerance.
1.Break above on Friday afternoon?
Last week, we wrote about the need for the S&P to break above its 20-day moving average and why that might not be so easy because of the congestion above. We saw that for the first 4.5 days of this week. Some people seemed to give up on Friday afternoon:
- HCPG @HCPG – Day 6 of playing with 50sma — looks like verdict won’t come out until next week.
$SPY 50sma/20sma games
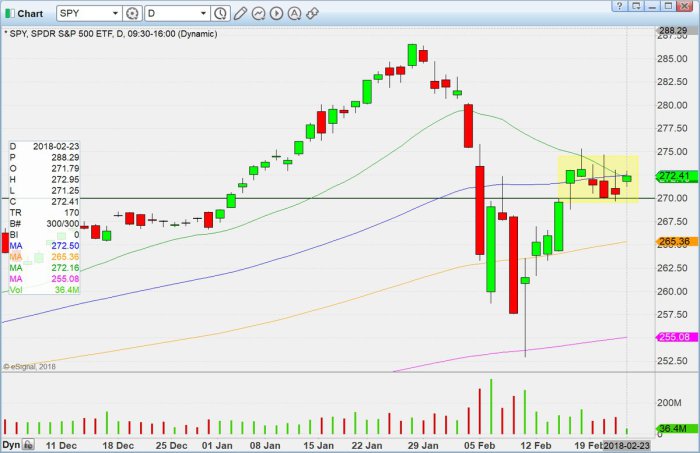 And then we all saw the hard rally begin and explode right after the Trump press conference into the close.
 The break above the 20-day was crisp & hard. But now comes the 2750 level. Lawrence McMillan of Option Strategist highlighted this level on Friday intra-day:
- “In summary, the market is at a crucial point right now. If $SPX can close above 2750 and $VIX can close below 17, that would be an all-clear sign for the upside, in my opinion. But the longer the market goes without achieving those levels, the greater the probability that there will be a retest of the lows.”
We would also expect congestion at 2800, the level from where the S&P fell hard. But move up into the close on Friday was broad as well as fast. What was it driven by? The sense that the Mueller investigation is increasingly about financial dealings of lower level staff, the fall in VIX below 17 on Friday afternoon or the hard fall in Treasury yields?
- Mark Newton @MarkNewtonCMT – WHY did stocks accelerate this afternoon? Much of it WAS technically driven- led by the bond market’s rally around 2pm. This S&P chart shows why 2730 had such importance as this downtrend from the last week intersected right at the breakout point– Visit http://newtonadvisor.com
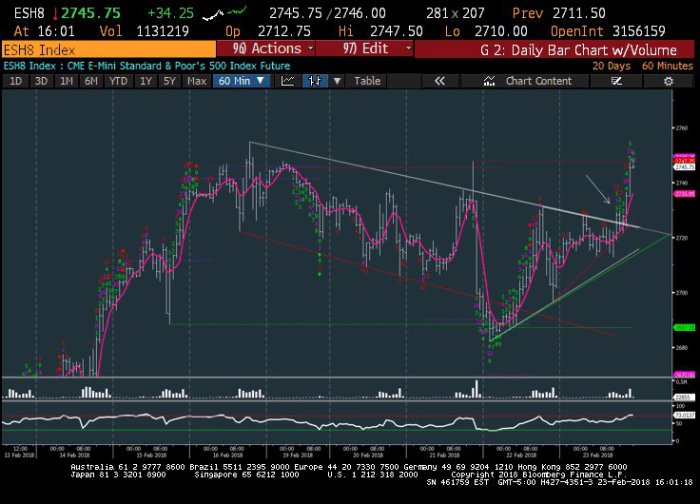 Clearly the fall in Treasury yields was a trigger for the S&P rally on Friday afternoon just as the steep rise in Treasury yields after the Fed minutes was a trigger for the hard fall in stocks on Wednesday afternoon. That brings us to the next direction of Treasury yields.
2. Treasury yields
The entire world knows by now that the Fed is hellbent on raising its Federal Funds rate to combat inflation that is around the corner. No wonder the Daily Sentiment Index for Treasuries broke below 20% this week. And what do non-commercial speculators do when the direction is so crystal clear?
- Jesse Felder @jessefelder – JPMorgan’s Quants Warn Risks Are Growing for Bond Short-Squeeze http://www.bloomberg.com/news/articles/2018-02-23/jpmorgan-s-quants-warn-risks-are-growing-for-bond-short-squeeze …
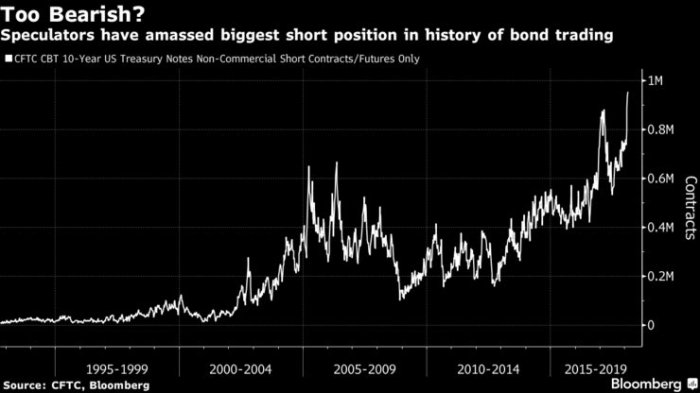 The article quotes the well known quant-whisperor Marko Kolanovic of JP Morgan:
- “When there is such a large short position, there is always risk of profit taking, or worse, a proper short squeeze,.. We also note extreme sentiment swings and the media playing into fears of inflation, while largely ignoring important points such as those most recently voiced by the Fed’s Harker and Bullard,”
Hmm! Weren’t the non-commercial speculators rampantly short another asset a mere 3 weeks ago? The term “short squeeze” doesn’t quite seem right for their crushing in the VIX explosion. But for a short squeeze to materialize in Treasuries, shouldn’t the trade location be right & shouldn’t some divergence show up?
- Mella Andrews @Mrs_Northy
$TNX – Weekly RSI relatively high, neg div on macd. Price at neckline.
 Positioning & technicals are fine. But is there any historical support from inflation expectations?
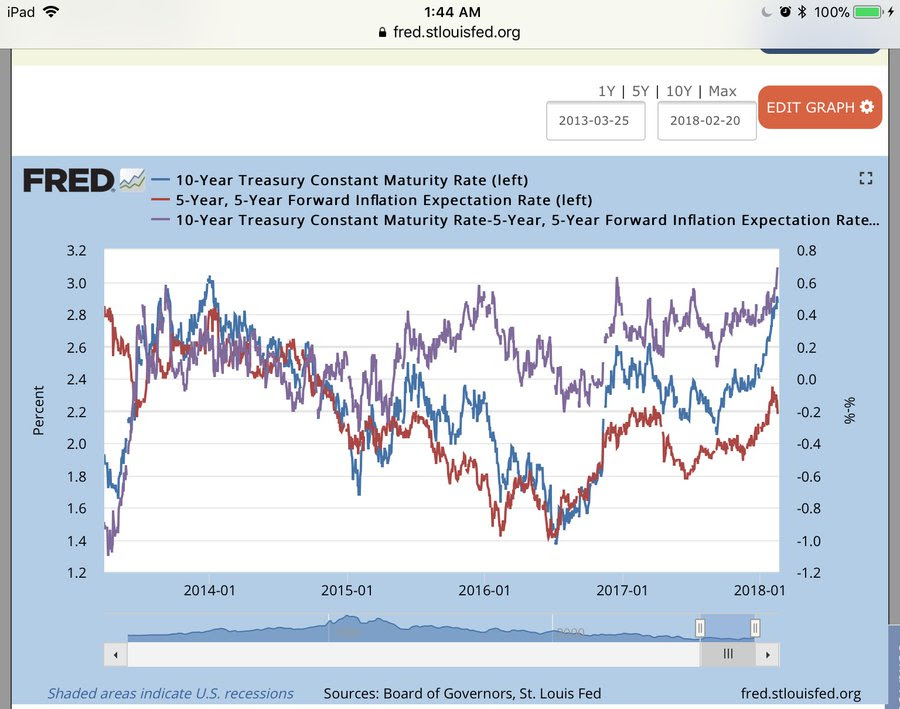
- Anil @anilvohra69 – Feb 22 – Gap (purple)between 5y5y inflation forwards (red) and 10y rates (blue) is at elevated levels. Past peaks in the gap (purple) were followed by drop in 10y rates (blue)
OK, but what about Jeffrey Gundlach who was so spectacularly right about being a bond bear back in 2017? Guess what? Gundlach came on CNBC FM 1/2 on Friday and said this is a terrible trade location for shorting Treasuries. He pointed out that the 6-month long rate rally has broken all the trend lines except one. The one being the 30-year line that sits as 3.22%. Regarding the 10-year yield, he said it was at fair value calculated as the average of nominal GDP (say 5%) and the German 10-year yield (say 70bps) = 2.85%.
So if the hitherto correct bond bear is unwilling to short here, then is there a potential for a short covering rally? Of course it would help if we had an emotional blow off in Treasury rates that had already reversed a bit.
Didn’t we see that in the crazy thin afternoon explosion in Treasury yields after the Fed minutes on Wednesday? The 10-year yield shot up to 2.95% – 2.96% in that emotional frenzy and closed lower by 5 bps at 2.90%. Gundlach pointed out that the 30-year yield shot up to touch 3.22% on Wednesday and reversed.
All that sounds good but is there any one who says definitively that yields have reversed from Wednesday’s top?
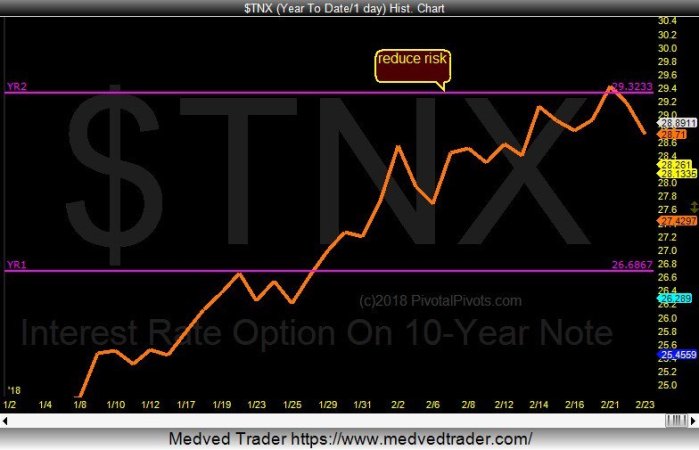
- Jeff York, PPT @Pivotal_Pivots – 10 Yr ylds
$TNX are pivoting at the Yr2 Pivot @ 2.93%. The high for the year is now in, and yields could fall to 2.66%(Yr1)@PivotalPivots
 All the above is fine but what happens to Treasury rates in the near term depends much more on what new Fed Chair Powell says in his Congressional testimony on Tuesday. If he says the wrong thing, “all hell could break loose” to use an Art Cashin expression.
3. Utilities
If Treasury yields fall, then rate sensitive sectors of the S&P should benefit. One of them is already catching the eye of some technicians:
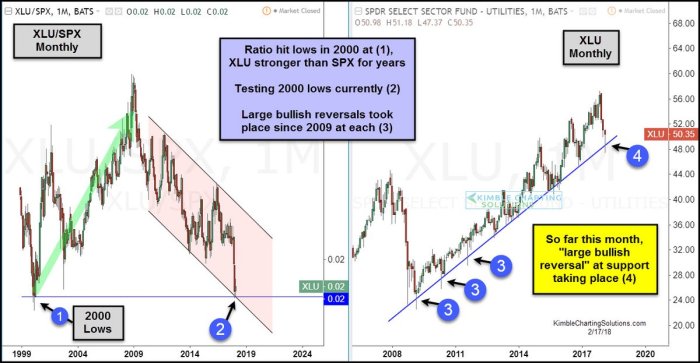
- Chris Kimble @KimbleCharting –Largest bullish reversal in 7-years taking place at 9-year rising support this month. While ratio testing 2000 level!
$XLU$SPX$TLT
4. Emerging Markets
The strength in EM stocks on Friday afternoon was something to watch. Perhaps that persuaded J.C. Parets to publish a bullish post about BRICKS on Friday after the close:
- “Brazil just closed at an all-time daily and weekly closing high. These are not things we normally see in downtrends. Russia’s MICEX also closed at new all-time highs. There is some serious strength coming from Emerging Market stocks and the data is still suggesting there is a lot more upside left out of this group. I think we’re just getting started“.
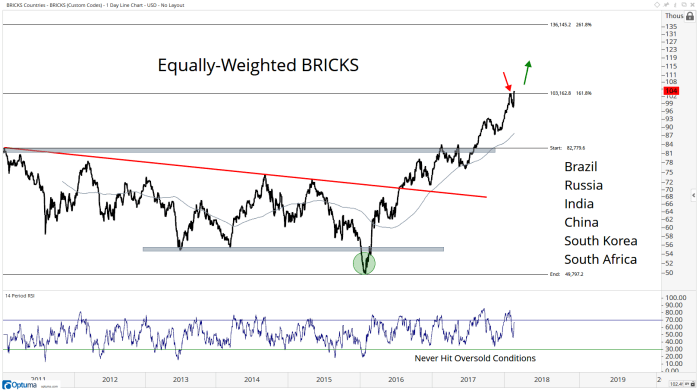
- “This year, Emerging Markets have been once again been outperforming both the S&P500 and the $EFA which is basically Europe & Japan by a lot.”
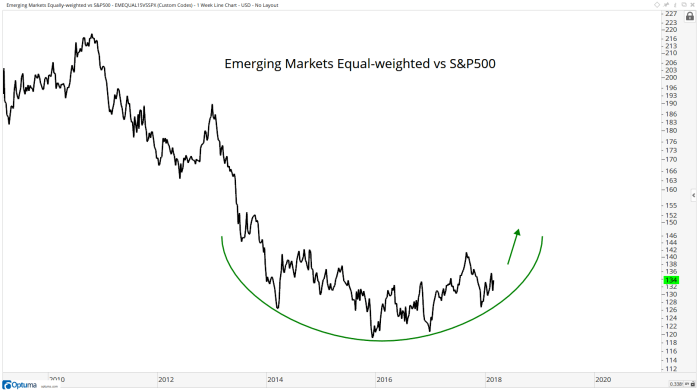
- “Hedge Funds see this. They are looking for 2 things: momentum and relative strength. It seems clear that Emerging Markets are showing signs of both.“
5. Dollar, Commodities
Gundlach remains bearish on the U.S. Dollar. He said Dollar trend is persistent and tends to go on for 6-8 years. This downtrend began in 2016 & could go on for some time in his view. But is there a bounce ahead? Hard to say:
- J. C. Parets @allstarcharts – Here is the Broad Traded US Dollar Index. Is this a massive double top? So sell rips in USD? Or is this a buy down here playing for a breakout to new highs?
$TWEXB$DXY$UUP
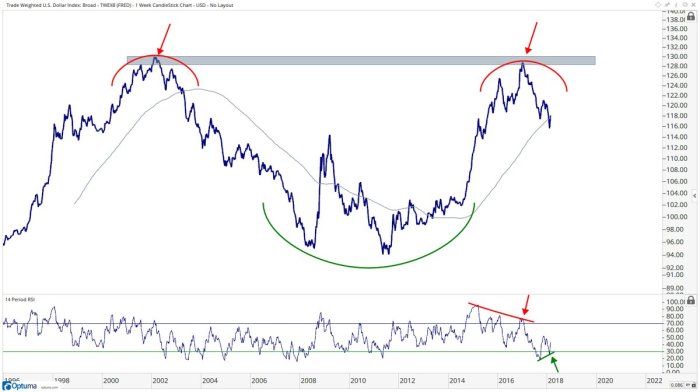 Once again, the best determinant will be what Chairman Powell says on Tuesday.
Getting to Gold & Silver, a fall in Treasury yields & resultant decline in real rates should be positive for Gold & Silver. And these are oversold at this stage:
- Chris Kimble @KimbleCharting – Silver rallied at least 20% 4 diff times past 20-yrs when at this support. Its back, big test!
$GLD$SLV$GDX$EURUSD https://kimblechartingsolutions.com/2018/02/silver-rallied-2 0-past-20-years-says-joe-frida y/ …
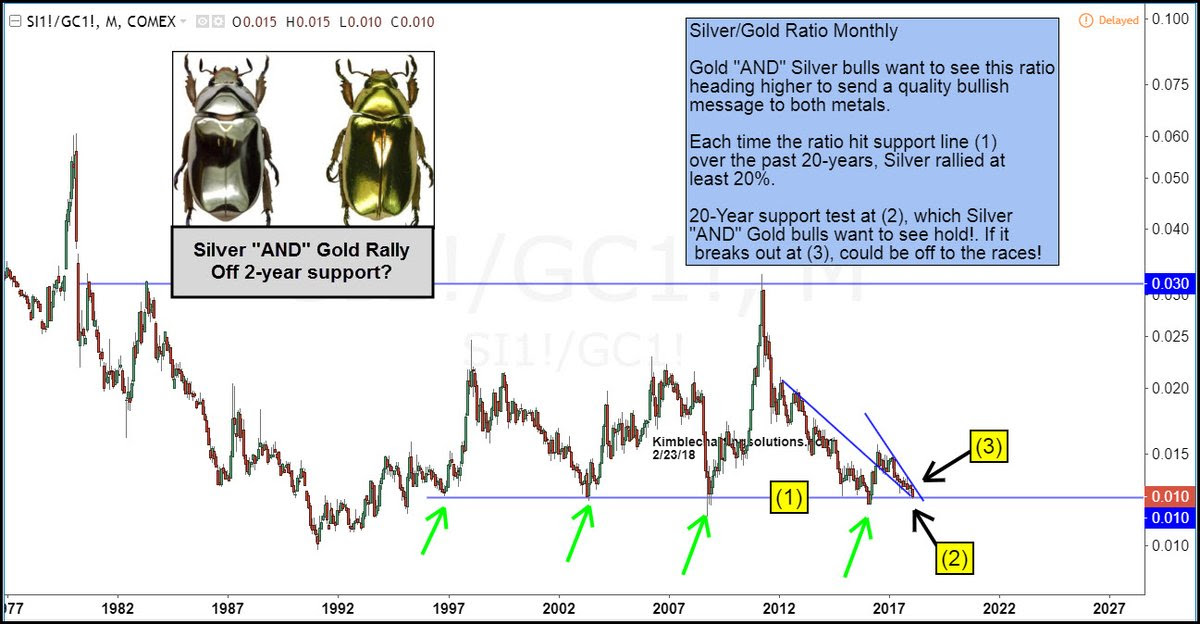 What about the weak action in Gold miners?
- fred hickey @htsfhickey Gold stocks didn’t lead in 2000 (gold stocks subsequently soared 1600%) and they didn’t lead in 2016 (gold stocks up 180%). Gold led both times and gold is in a bull market and less than 3% away from a major breakout.
Send your feedback to [email protected] Or @MacroViewpoints on Tuesday