Summary – A top-down review of interesting calls and comments made last week in Treasuries, monetary policy, economics, stocks, bonds & commodities. TAC is our acronym for Tweets, Articles, & Clips – our basic inputs for this article.
Editor’s Note: In this series of articles, we include important or interesting Tweets, Articles, Video Clips with our comments. This is an article that expresses our personal opinions about comments made on Television, Tweeter, and in Print. It is NOT intended to provide any investment advice of any type whatsoever. No one should base any investing decisions or conclusions based on anything written in or inferred from this article. Macro Viewpoints & its affiliates expressly disclaim all liability in respect to actions taken based on any or all of the information in this article. Investing is a serious matter and all investment decisions should only be taken after a detailed discussion with your investment advisor and should be subject to your objectives, suitability requirements and risk tolerance.
1.Worst Ever!
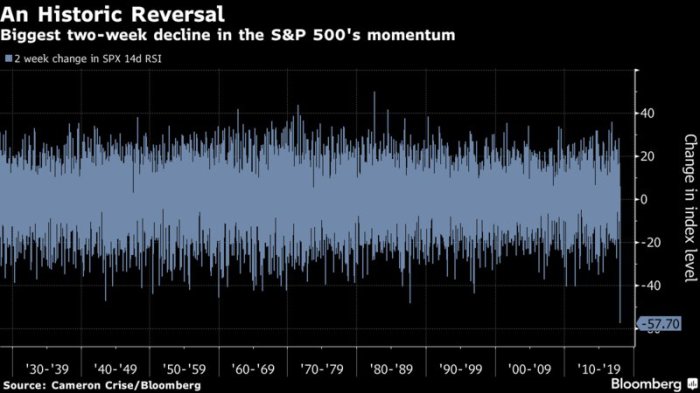
Our Elevator term of last week looks so insipid compared to what happened this week. By some measures, this 2-week decline was the worst in history. First from Ryan Detrick:
- “This is the first time in history the S&P 500 went from a new all-time high to 10% correction in 9 days or less.”
What about loss of assets?
- SentimenTraderVerified account @sentimentrader –
$SPY has lost $23 billion in assets over the past week, $10 billion more than any other 5-day period in its history. As a % of assets its about 9%, the most since August 10, 2011.
Can all this happen without momentum?
- Jesse Felder @jessefelder –This Is the Worst Momentum Swing for U.S. Stocks in History https://www.bloomberg.com/news/articles/2018-02-09/this-is-the-worst-momentum-swing-for-u-s-stocks-in-history … ht
@trevornoren
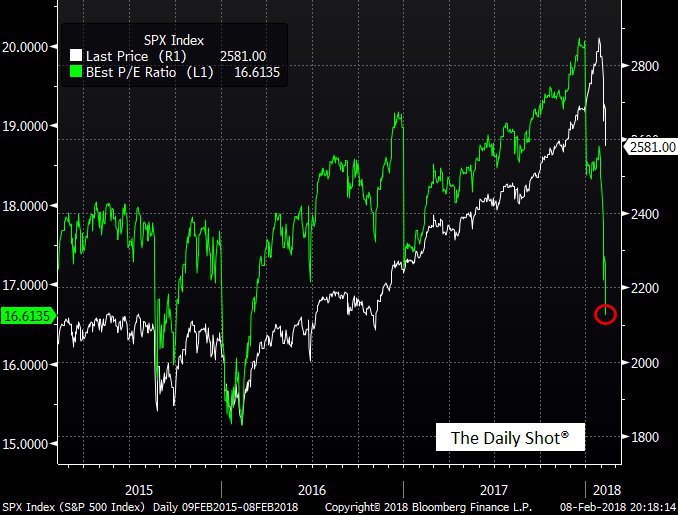
 Such extremes have to lead to some good outcomes, right?
- (((The Daily Shot))) @SoberLook – Chart (
@TheTerminal): S&P 500 valuations (based on forward P/E) have improved dramatically this month –
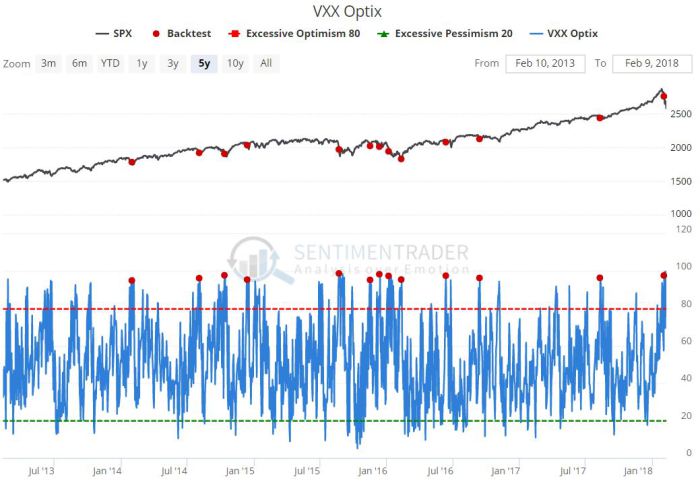
So what happens a few days later?
- Andrew Thrasher, CMT @AndrewThrasher – When
$VXX Optimism Index via@sentimentrader gets above 95, the S&P 500 is higher 15 days later 75% of the time over the last 5 years. Current reading is 99.
While such an outcome is devoutly to be wished, the real question is whether this two-week decline is just a sell off or is this the precursor to a regime shift?
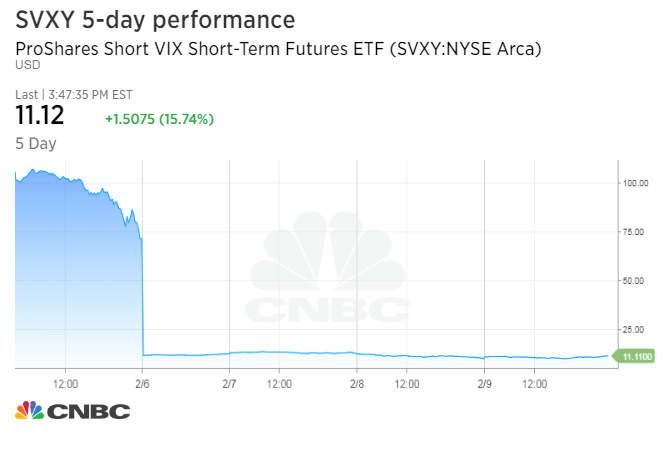
We think it is evident to all that two major factors triggered this fast steep fall in stocks. The first was the steep rise in Treasury yields due to strong economic & wage growth. The second was the collapse in XIV, the inverse VIX note, and the resultant explosion in VIX.
It is possible that, once again, the rate picture changed dramatically on Thursday just after 1:10 pm after a bad 30-year Treasury Auction and then, 24 hours later, the VIX reached its local extrema just after the S&P 500 breached its 200-day moving average.
2. VIX and S&P 500 on Friday:
Take a look at these two charts:
Those who watched this in real time would recall that 38.28 was a pivot that led to a quick turn down in VIX just before noon on Friday. But the VIX rebounded quickly and then decisively crossed above this pivot around 12:15 pm or so. As VIX crossed above the 38.28 pivot, the S&P fell hard. VIX reached its peak of around $41 & then turned down. It broke below the 38.28 pivot just after 1:00 pm and then fell vertically. In contrast, SPY kept falling after 1pm and broke below its 200-day. Then it reversed & flew up mimicking the vertical fall in the VIX.
The VIX began its final steep fall of Friday just around 2:10 pm and the SPY began its final steep rise about an hour later, around 3:10 pm. Unfortunately, we are not expert at curve fitting like Tom McClellan. But. at least empirically speaking, the above makes it clear that it was the VIX that led and the SPY followed.
If that pattern continues, then you have to watch the VIX on Monday rather than the SPY. It is really instructive to see how the VIX term structure has totally inverted from its lower left to upper right graph two weeks ago on January 26, 2018 to Friday’s upper left to lower right graph. In fact, Friday’s close of 29.06 collapses to 20.425 in March to 18.935 in April.
Will the S&P follow the lead of this downward falling VIX by rallying next week or will another collapse in another short VIX product create a reversal rally in VIX?
We have to wonder whether Fidelity’s action on Friday to halt “buy orders of three leveraged ETFs “to protect customers from outsized risk during the current market environment,” will end up being described as closing the barn door after the horse has bolted.
 We also wonder whether this ban by Fidelity on short VIX instruments will NOW become a signal to do precisely that, meaning short the VIX.
3. Local Maxima in Interest Rates? Yield Curve Change?
To his credit, Rick Santelli said late morning on Thursday that the very high volatility in Treasuries has usually suggested a buying opportunity. He proved right about 90 minutes later. Look what happened to the 5-year yield within about 10 minutes of the disappointing 30-year auction on Thursday at 1:00 pm:
Early Thursday morning was the top in 5-year yield but the definitive fall in the 5-year yield began around 1:10 pm after the 30-year auction. It fell to about 2.46% just before the big drop in VIX and closed at 2.54%, down 4 bps on the week. The big outlier was the 2-year yield that fell by 7 bps on the week to 2.077%.
Contrast this to the 30-year yield action after Thursday’s auction:
 So the 30-2 curve steepened by 16 bps this week with the 30-year yield rising by 9 bps and the 2-year yield falling by 7 bps. This is dramatically different action and one that makes us wonder. We recall a statement attributed to Chairman Powell in January that he was opposed to a flattening yield curve. One way to achieve that would be to get less strident on the number of rate hikes in 2018 thereby leading the 2-yr yield lower and allow the strong economy to grow with a higher debt load due to the budget & the tax cut thereby leading the 30-year yield higher.
If true, that would herald a totally different monetary regime than the 2016-2017 Yellen regime and have consequences for sector allocation within S&P & real assets. But no point thinking about this unless this action persists during the next week & up to Chairman Powell’s testimony on February 28.
4. Stocks – Near Term & Later
How far could Friday’s bounce in the S&P go?
- Peter Ghostine @PeterGhostine –
$SPY … At some point, a recovery shouldget underway, targeting this week’s recovery high of ~272. http://www.61point8.com/Portals/0/article%20images/20180207/20180207SPY1.png …
Forget about leadership change during this bounce?
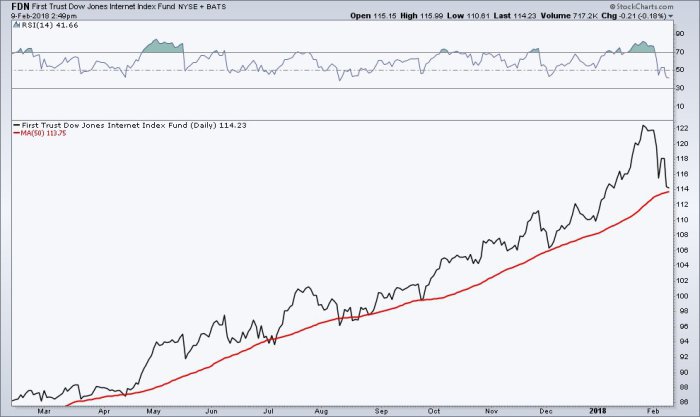
- Andrew Thrasher, CMT @AndrewThrasher –Here’s probably one of the best looking charts right now: Internet Index. momentum still in a bullish range while never becoming ‘oversold’ & price is holding above its 50-day moving average as its uptrend is still intact.
And post bounce?
- Peter Ghostine @PeterGhostine –
$SPY … Per my current estimations, the forthcoming bounce should set the stage for a much more severe decline targeting 218-220. But this in turn will likely offer the best buying opportunity since 2011 and 2015/2016.
Kinda in this camp is Ruchir Sharma, Chief Strategist of Morgan Stanley Investment Management who called this week’s decline as the “first crack”. He told CNBC Squawk Box that stock markets are in the process of making a major top and will be “directionally lower” over the next 12-18 months. His main thesis is that global economic growth is unlikely to accelerate much from here and will actually disappoint in the second half of 2018. As far as we can recall, Sharma does think this current decline is mostly over.
As far as we are concerned, the biggest headwind for markets will be the tightening actions of Global Central Banks, not just via raising rates but more so from reducing/ending their buying of bonds, otherwise known as contracting their balance sheets. But all that is for another day. First order of next week is a further fall in the front month VIX to take the selling pressure off.
Send your feedback to [email protected] Or @MacroViewpoints on Twitter