Summary – A top-down review of interesting calls and comments made last week in Treasuries, monetary policy, economics, stocks, bonds & commodities. TAC is our acronym for Tweets, Articles, & Clips – our basic inputs for this article.
Editor’s Note: In this series of articles, we include important or interesting Tweets, Articles, Video Clips with our comments. This is an article that expresses our personal opinions about comments made on Television, Tweeter, and in Print. It is NOT intended to provide any investment advice of any type whatsoever. No one should base any investing decisions or conclusions based on anything written in or inferred from this article. Macro Viewpoints & its affiliates expressly disclaim all liability in respect to actions taken based on any or all of the information in this article. Investing is a serious matter and all investment decisions should only be taken after a detailed discussion with your investment advisor and should be subject to your objectives, suitability requirements and risk tolerance.
1.Back to the Old World
Or not so old, meaning the Euro turmoil world of this decade.
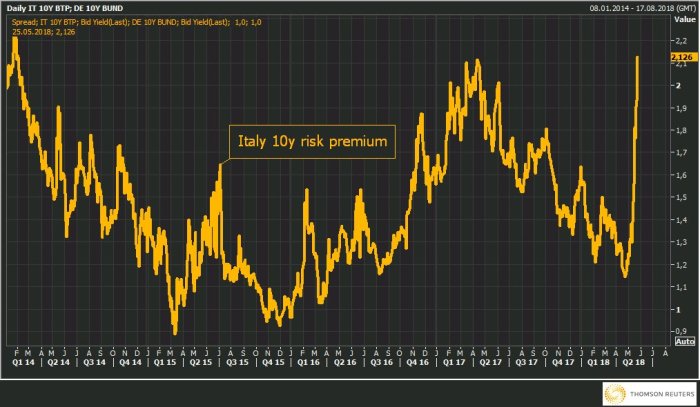
- Holger Zschaepitz @Schuldensuehner – Bund yields drop like a stone as European pol concerns regarding both
#Spain &#Italy is weighing on sentiment. As we head into weekend, it makes sense to adjust positions given high likelihood of headline risk, Citi says. BTP-Bund spread is now at 214bps, the widest since 2014.
 That’s fine until someone mentions the “S” word:
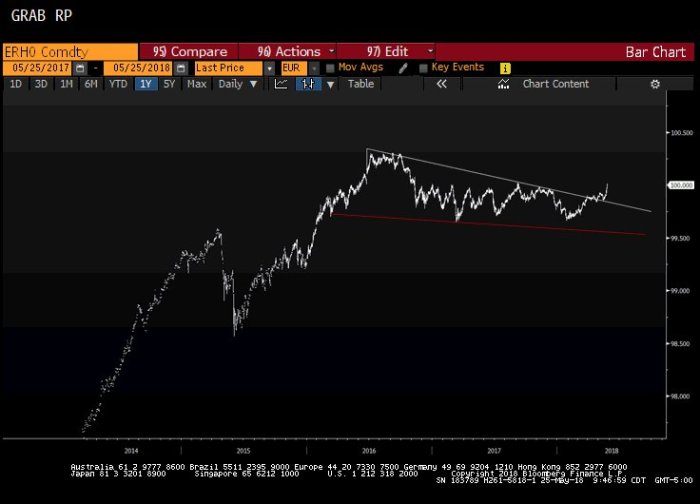
- Raoul PalVerified account @RaoulGMI – 3/ And March 2020 Euribor futures have broken out. Suddenly things have gotten serious in Europe at a systemic level….
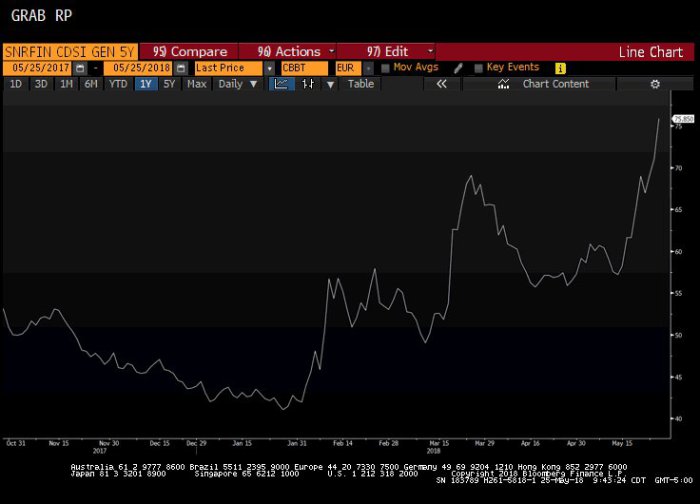
Do the CDS of Euro Financials reflect this risk, either in magnitude or speed?
- Raoul PalVerified account @RaoulGMI – 2/ The EU Financial CDS is giving some signals in the speed of the move…
 All this sounds like a body blow to the gut of Europe:
- Raoul PalVerified account @RaoulGMI – Sod it. One more chart… German 10 yr bund yields have broken their trend. New yield lows await, most likely.
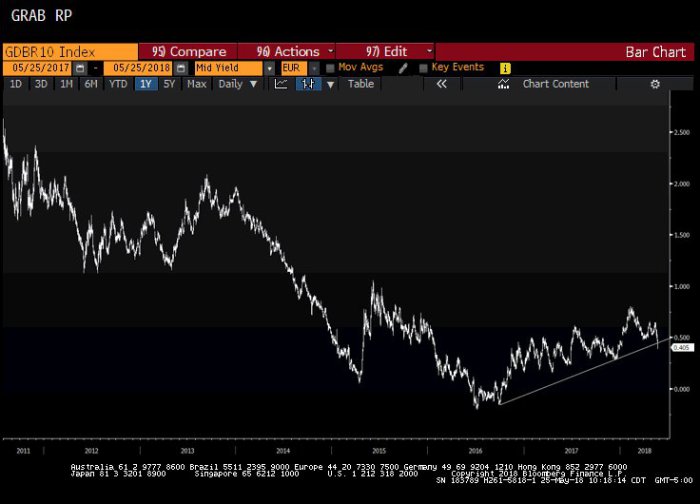 The 10-year German Bund yield hit 63.7 bps on Thursday, May 17, a mere 6 trading days ago. On this Friday, it closed at 40.3 bps, a plunge of 23.4 bps. The US 10-year yield closed at 3.115% on that Thursday & the 30-year yield closed at 3.25%, above the 3.22% Gundlach level. On this Friday, the US 10-year yield closed 18.4 bps lower at 2.931% and the US 30-year yield closed 16 bps lower at 3.09%, decisively lower than the 3.22% level.
If the 30-year yield does not go up & cross above the 3.22% level, then the breakout on Thursday May 17 would become a failed breakout. And those tend to fail with some power & momentum.
But aren’t US & Germany so different and isn’t the UST-Bund yield trend so strong?
- Charlie BilelloVerified account @charliebilello – Spread b/t US and German 10-yr yields at a record high. ECB now not expected to hike off of negative rates until June of next yr. Fed expected to hike 3-4 more times by that point.
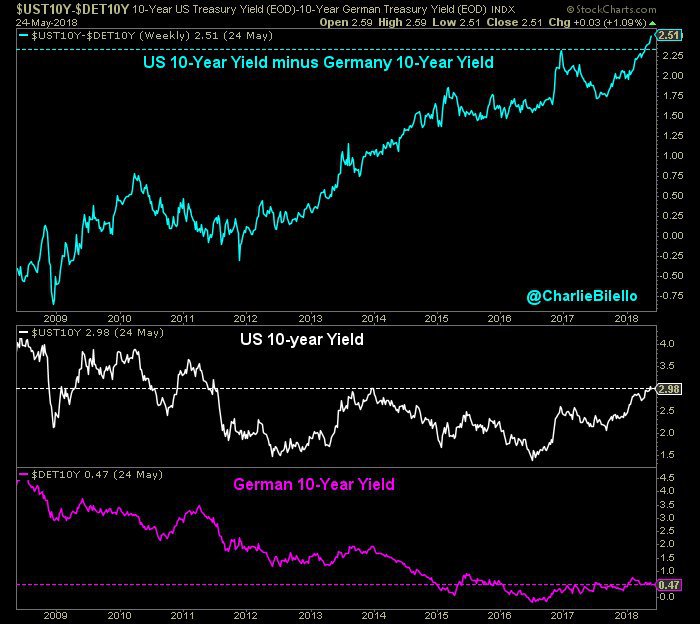
Well! Didn’t somebody say something about unsustainables eventually becoming unsustained? The last time unsustainable US-Germany difference became highly & speedily unsustained was in October 1987.
Remember Gundlach’s equation of US 10-year yield = Average of German 10-year Bund & US Nominal GDP! At 3% real GDP & 2% inflation, the nominal GDP becomes 5% & with 40 bps Bund yield, Gundlach’s equation gives us 2.70% as fair value of US 10-year yield. What if real US GDP comes in at 2.5%, then nominal GDP with 2% inflation becomes 4.5% and with 40 bps Bund yield, the Gundlach equation gives us 2.45% as fair value of US 10-year yield.
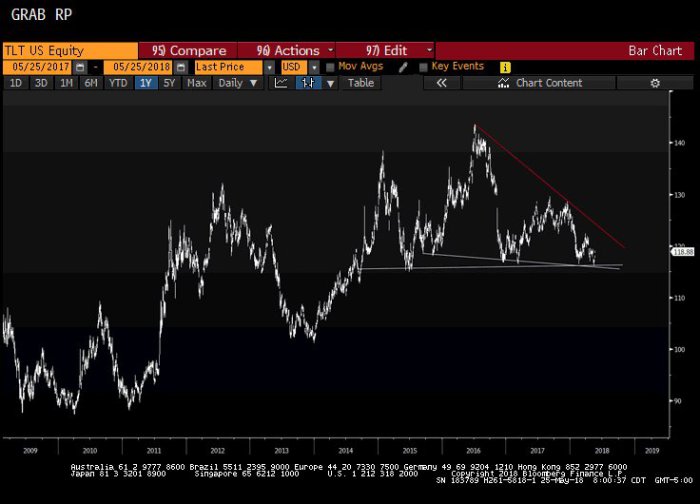
That should make TLT or Long Duration Treasuries a good buy, right? Raoul Pal came to the same conclusion both technically & fundamentally:
- Raoul PalVerified account @RaoulGMI –
#bonds$TLT US bonds are looking to me like they will rise sharply. The TLT chart, which everyone and his dog thought was a head and shoulders top, is likely to be a wedge, wrong-footing everyone. Again. I am bullish. Its a perfect risk/reward set up.
 And fundamentally:
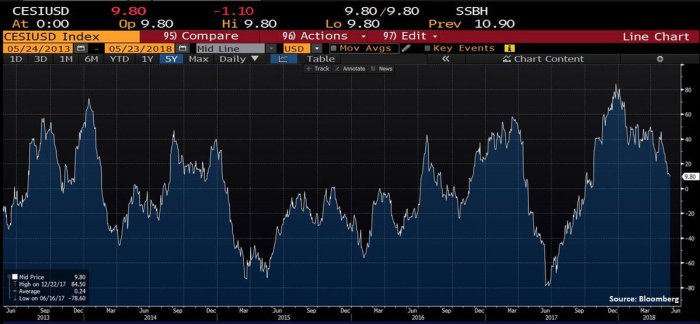
- Raoul PalVerified account @RaoulGMI – Higher dollar, lower oil, funding stress in Europe, Italy/Spain fears, EM stress, slowing China, falling CESI, ISM that has peaked, etc – all paths lead to lower US bond yields. Seems like the highest quality trade in the world right now and low vol in
$TLT makes it even better.
Going back to the Charlie Bilello chart of UST10-Bund10 yields, notice that this spread actually widened this week despite the plunge in Bund yields & Treasury yields. So for this unsustainable rise in this spread to reverse, the US 10-year Treasury yield will have to decline faster than the 10-year Bund yield. Can that happen if the Fed remains dedicated to raising rates? That brings us back to the New World.
2. Fed
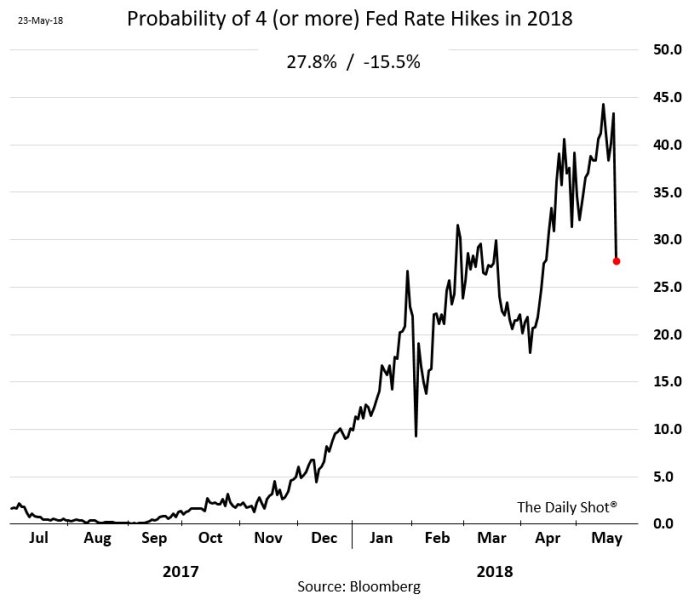
Don’t forget it was this Wednesday’s Fed minutes that stopped the momentum of rise in the US 2-year yield. In addition,
- (((The Daily Shot))) @SoberLook More – Chart (
@TheTerminal): The probability of 4 rate hikes in 2018 (3 in addition to the one in March) dips sharply after the dovish FOMC minutes –
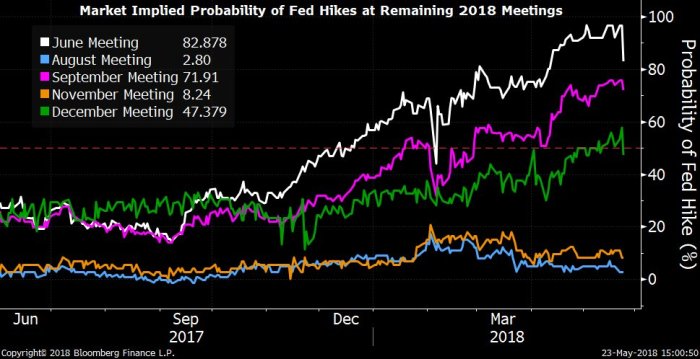
 Not just the December rate hike. Take a look at the June rate hike odds drop in the chart below:
- Michael McDonough @M_McDonough – Market Implied Probability of a 4th 2018 Rate Hike in December, Back Below 50%: {
@TheTerminal Chart Link: https://bloom.bg/2qthWWZ }
Whether the expected June rate hike is actually implemented depends a great deal of what happens in Europe over the next 3 weeks. Will Chairman Powell go through with a rate hike if Europe looks as if it is falling into another systemic risk episode? We don’t think so.
And the US is not looking so hot either:
- David Rosenberg @EconguyRosie Thu May 24 – Question for the Fed: How does the Citigroup economic surprise index rolling over to 7-month lows jive with the view that “economic fundamentals were currently supporting continued above-trend economic growth”?
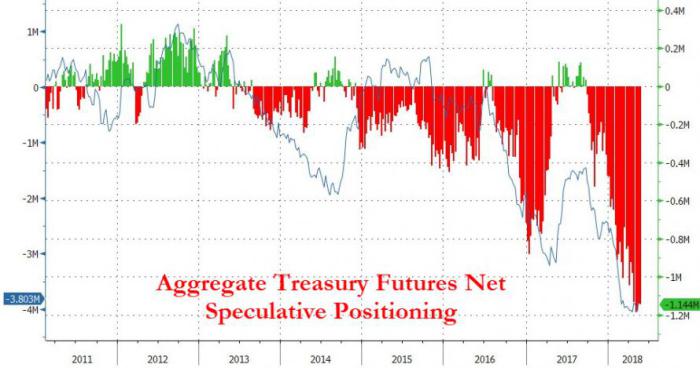
 That makes next week’s economic data critical. Strong economic data could indeed propel US rates higher. But weak data or not so strong data may indeed cause rates to fall. After all, not much momentum is needed to make the ginormous shorts sweat a little:
- Kieran McCabe, CFA @kmccabe0214 – Replying to @RaoulGMI – Wrong-footed indeed! Huge spec net short.
All this is fine, but is there a technician gutsy enough to say Buy TLT or Long Duration Treasuries? Indeed,
Todd Gordon, founder of TradingAnalysis.com, made an Elliott Wave case for TLT to get to $122 by June 15, 2018.
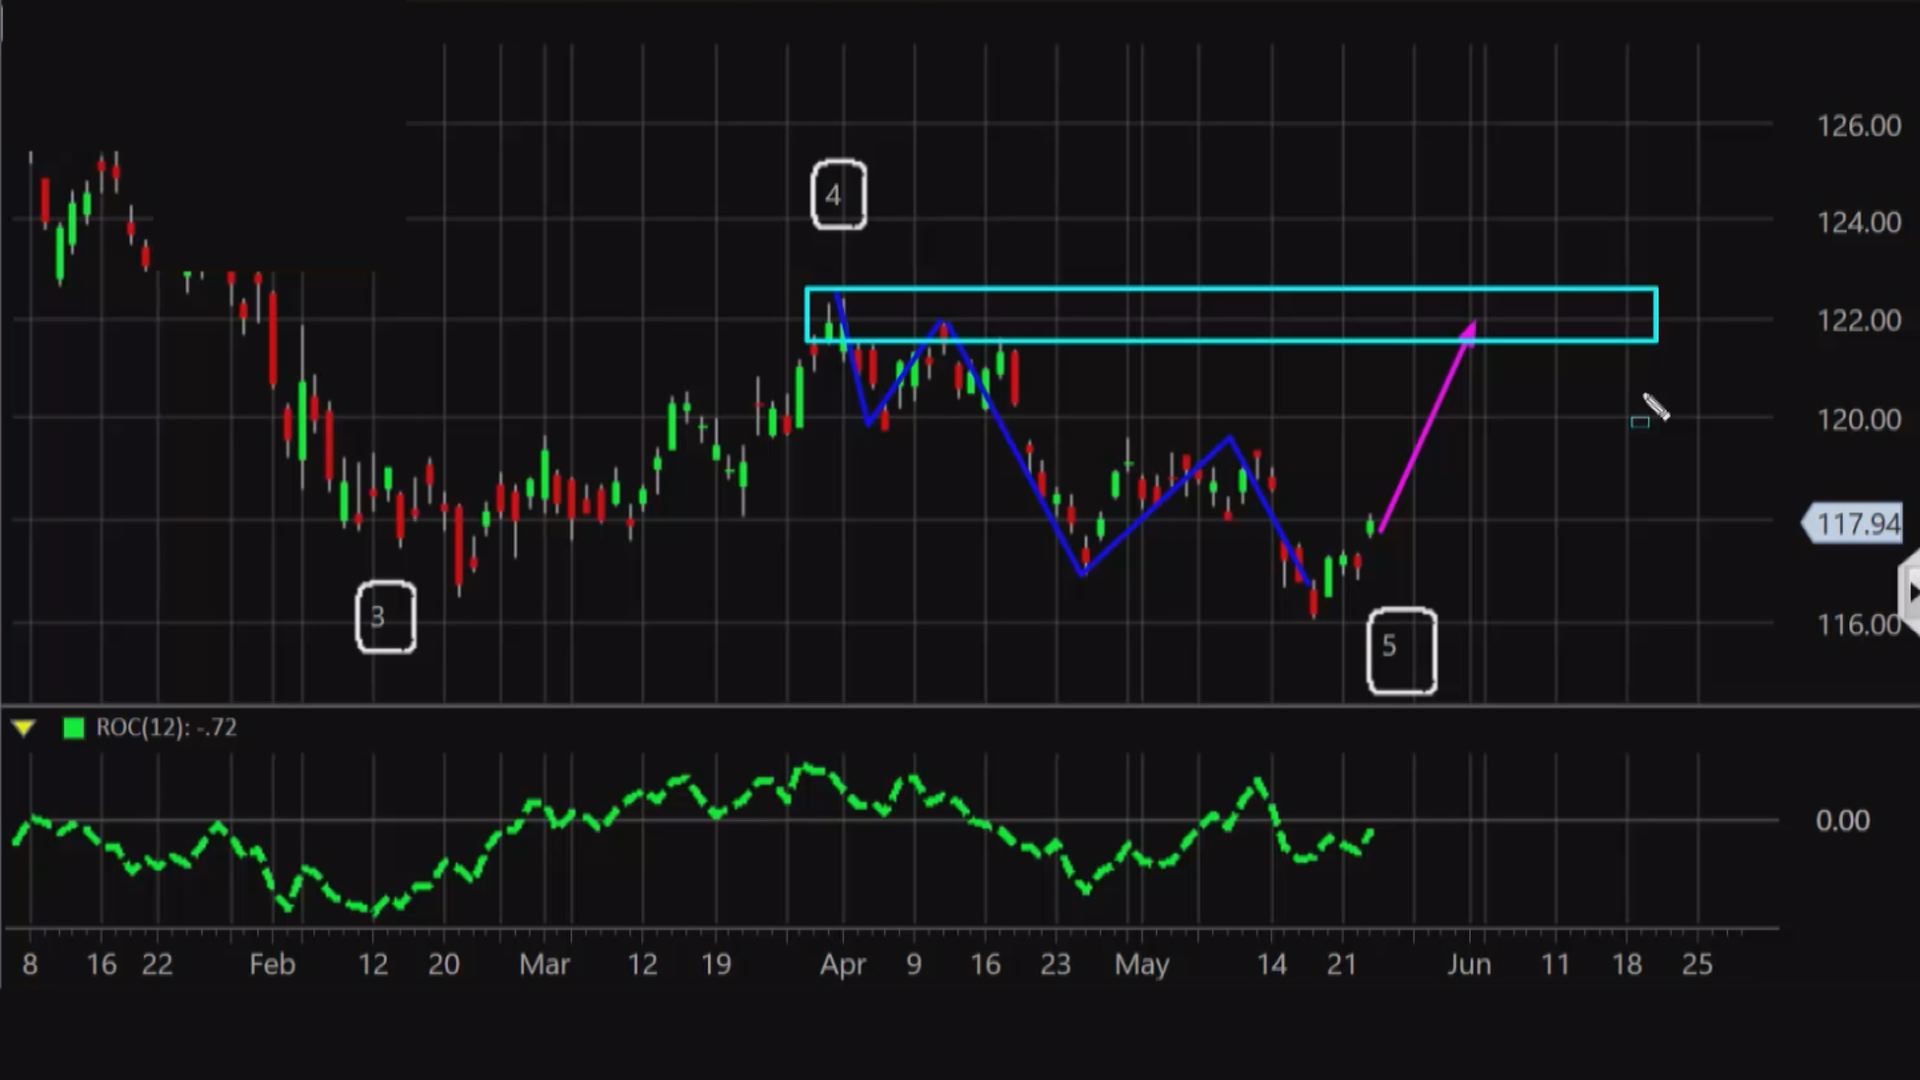
Remember Todd Gordon was the technician who called the upturn in the Dow from 2599 on Thursday, May 3, 2018. If he proves enough 1/2 as right as he did on that Dow reversal, then his $122 target for TLT should be within reach.
Stocks have done great since March 2009 and Stocks have done really well since President Trump’s election while Long Duration Bonds have had their worst first half ever in history. Any body who only knows that would be stunned to see the tweet & chart below:
- Charlie BilelloVerified account @charliebilello Total Returns, last 20 years… S&P 500: +252% Long-Term Bonds: +258%
$SPY$VBLTX
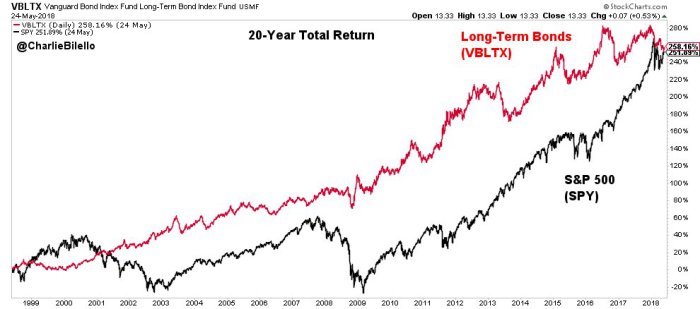 These past 20 years include the 1999-2000 tech-telecomm bubble, the 2004-2007 credit-housing bubble and the post March 2009 QE led huge move. Despite that, the Long Bond index still leads the S&P!
This outperformance may well end in the next few months as inflation rises, global economy grows & rates in US spike up. But what if we get another bout of Euro slump in addition to what is going on in Emerging Markets?
We do remember June 2006 & 2007 when onset of inflation was a guarantee & rates were rising fast & when “global liquidity, global growth” was the CNBC war cry. Hopefully, June 2018 will be decidedly different. For that Europe has to get its act together fast. Italy is NO Greece and Spain is NO Cyprus. And after 2 years, Brexit is still on paper or in fantasy.
3. Stocks
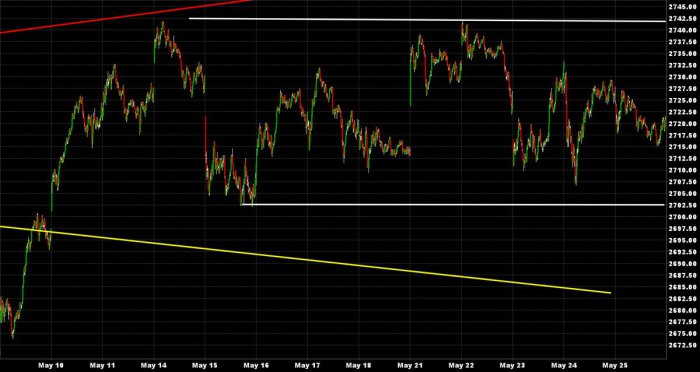
The tweet below is this week’s best representation of market action:
- Kate’s Dad @KASDad – Please, someone, anyone, tell me how they can have a strong opinion based on anything they see, but most particularly this range of over 2 weeks.
$SPX$NDX$IWM
Of course, the energy sector was the big outlier in dramatic action. Oil was down 5% on the week, while Brent was down 3%. The hardest hit was the OIH, Oil Services ETF, which fell 7.4% on the week.
- Thomas Thornton @TommyThornton – Energy sector had extreme sentiment, lot’s of DeMark upside exhaustion signals, overly bullish COT positioning, and inflows… The bullish crowding is even worse with the FANG like stocks.
The rest depends on what happens to interest rates & economic data. We don’t really have anything else to say except feature some tweets-charts we found interesting:
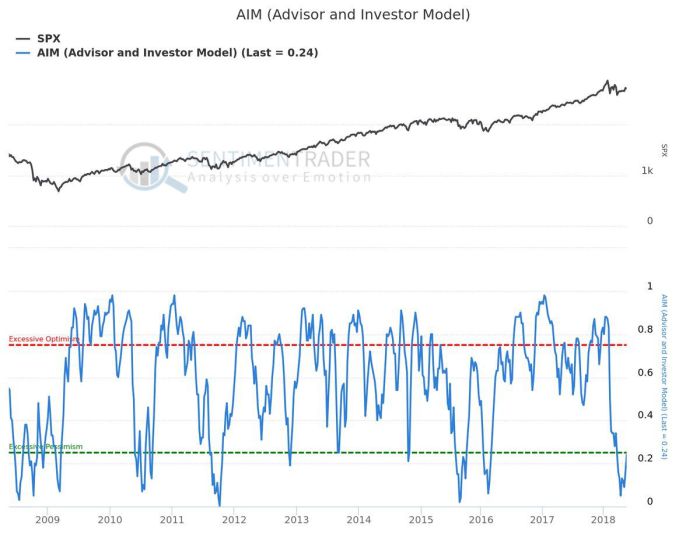
First a semi-bullish tweet-chart:
- Cam Hui, CFA @HumbleStudent –(New post) Bear markets simply don’t start this way
$SPX$SPY@sentimentrader https://buff.ly/2GIBrRL
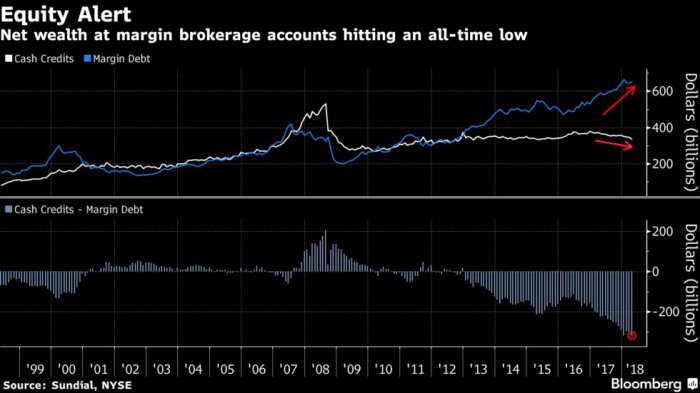
 Then not so bullish:
- Jesse Felder @jessefelder – The net cash deficit in equity brokerage accounts just reached $317 billion, the widest ever. https://www.bloomberg.com/news/articles/2018-05-25/leverage-alert-ringing-as-cash-drains-from-stock-broker-accounts … ht
@lisaabramowicz1
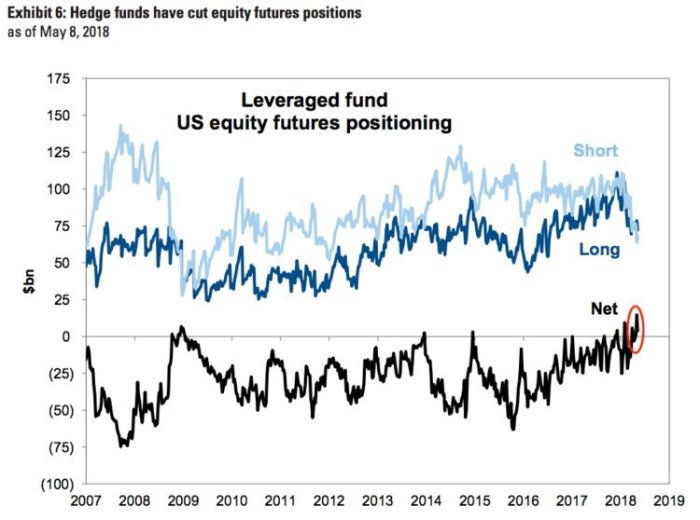
 And,
And,
- Babak @TN – “the first time since the start of 2009 that leveraged funds have had a substantial net long position in US equity futures” http://www.businessinsider.com/hedge-funds-altering-investment-strategy-what-it-means-for-you-2018-5 …
4. Majestic Indeed
We remember reading a story in our childhood about an ancient (pre-human) war between birds & animals. We hardly remember any details except that it came down to Eagle vs Tiger. We remembered that when we saw the photo below in an article about AG (First Majestic Silver Corp).

The above is a great photo but nothing beats the photo below in sheer majesty. It was the National Geographic Photo of the Year:
 From nature’s majesty to a momentous day .
5. Happy Memorial Day

Send your feedback to [email protected] Or @MacroViewpoints on Twitter