Summary – A top-down review of interesting calls and comments made last week in Treasuries, monetary policy, economics, stocks, bonds & commodities. TAC is our acronym for Tweets, Articles, & Clips – our basic inputs for this article.
Editor’s Note: In this series of articles, we include important or interesting Tweets, Articles, Video Clips with our comments. This is an article that expresses our personal opinions about comments made on Television, Tweeter, and in Print. It is NOT intended to provide any investment advice of any type whatsoever. No one should base any investing decisions or conclusions based on anything written in or inferred from this article. Macro Viewpoints & its affiliates expressly disclaim all liability in respect to actions taken based on any or all of the information in this article. Investing is a serious matter and all investment decisions should only be taken after a detailed discussion with your investment advisor and should be subject to your objectives, suitability requirements and risk tolerance.
1.”Best communicator … ever seen …“
thus spake Rick Santelli. Santelli’s complete sentence described Fed Chairman Jay Powell as “best communicator I have seen running the Fed & I have been monitoring it since 1978“. We concur and offer a simplistic explanation. Jay Powell is the only investor to have run the Fed since we began watching the Fed. And we have always preferred doers over non-doer analyzers. As Rick Santelli & Vincent Reinhart said in their clip below, Chairman Powell is far more comfortable with markets setting prices than Yellen or her predecessors. That only comes from experience in doing.
In their conversation about Draghi’s comments on Thursday morning, Santelli gave the trader’s summary:
- “we can’t buy any securities because there is not a whole lot left & in terms of raising rates it will never fly right now“
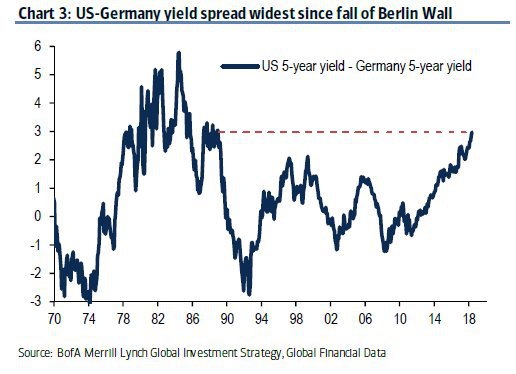
Powell will raise about 3-4 times till July 1, 2019 while Draghi will not raise at all since then. So how should the 5-year US rates & 5-year Bund rates behave? Exactly as they have:
- Nicholas Glinsman @nglinsman – US-GERMAN 5 year yield spread widest since the fall of the Berlin Wall
There is also a deeper story here. QE was an invention of Bernanke who designed it to fit the US economy, US monetary structure & US Treasury market. When copied blindly for Europe & Japan, it didn’t work so well. The only market where it worked somewhat was the other Anglo economy – UK. Unfortunately, that market doesn’t count for much these days.
- Holger Zschaepitz @Schuldensuehner – Ratios of central bank balance sheet growth to GDP growth show that QE in general did not work very well. BUT every $ spent on QE looks to have worked much better for the Fed than every ¥ spent on QE by the BoJ or every € spent by the ECB. (Chart via BofAML)
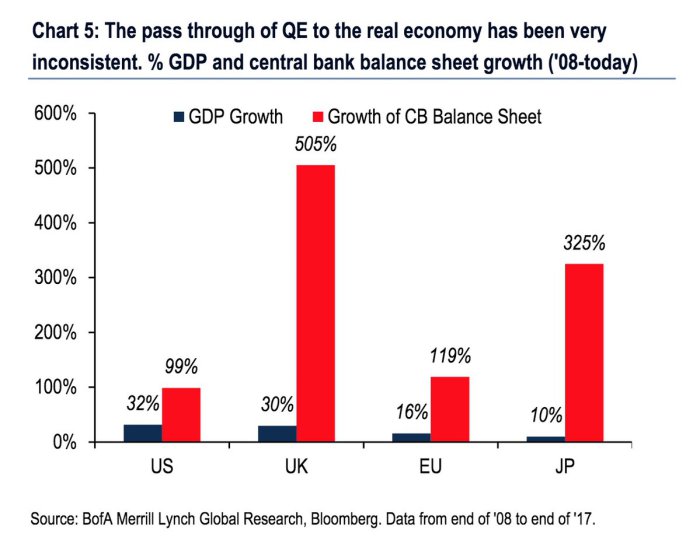
So you have hardly any inflation in EU and you have no inflation at all in Japan. Isn’t that terrific for America?
- Ryan Detrick, CMT @RyanDetrick Why is it called a “Goldilocks” economy? This chart sums it up. Economic growth and very little inflation yet. https://lplfinancial.lpl.com/content/dam/lpl-www/documents/asset-library/weekly_economic_commentary.pdf …
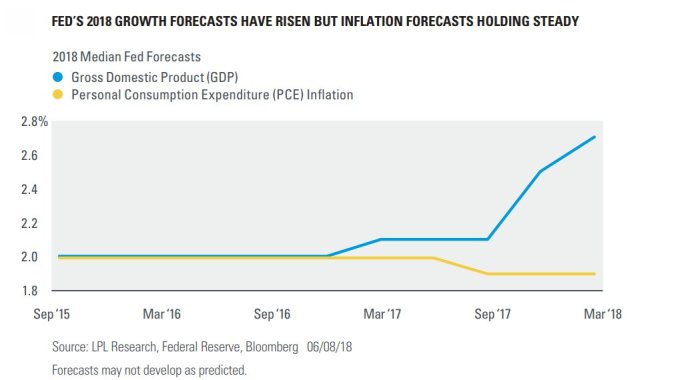 As, Jim Paulsen of Leuthold Group said on Friday, while Real Q2 GDP would come in 4.5%, the second half might decelerate to 2.5%. In other words, Q2 GDP could be the peak quarter for 2018. Add to that low inflation being imported from EU, Japan & even from slowing China, what should you get? What Hedgeye termed on Friday as “lower high for 10-year yield, CRB & Oil“.
In more detail, Hedgeye wrote on Friday morning:
- “INFLATION EXPECTATIONS PEAK? – We know the story on inflation data this week. CPI and PPI in May ran hot and would SEEM Hawkish in isolation based on communicated FED rhetoric. The market reaction from inflation gauges like 10yr nominal yields and oil were underwhelming to say the least. The next question we would float is whether or not the combination of 1) rising inflation expectations, 2) policy expectations, 3) rising nominal yields momentum also out of steam?“
Tim Seymour of CNBC FM seemed to advocate a re-inflation view on Friday evening but admitted – “Commodities got destroyed today & Steel companies got taken out”
2. Treasuries & Credit
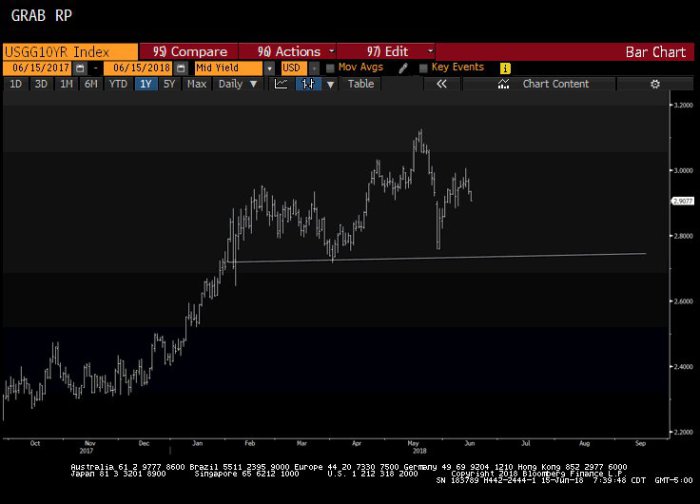
The Treasury yield curve flattened hard this week with 10-30 year rates falling and 2-5 year rates rising. The 2-3 year curve rose 5 bps + in yield while the 30-year yield fell by 3.9 bps and the 10-year yield fell by 1.6 bps. The 30-5 year spread closed below 25 bps and the 30-10 year spread closed at 12 bps. The latter is the best indicator of future inflation expectations.
How does a macro guy express this?
- Raoul PalVerified account @RaoulGMI With the velocity of this dollar move and the yield curve flattening with the Fed focussed on hiking more to head off cyclical inflation pressures, I can’t see any other outcome except for bonds to rally. Long dollars, long bonds seems to be the best game in town.
How is this expressed in chartist terms?
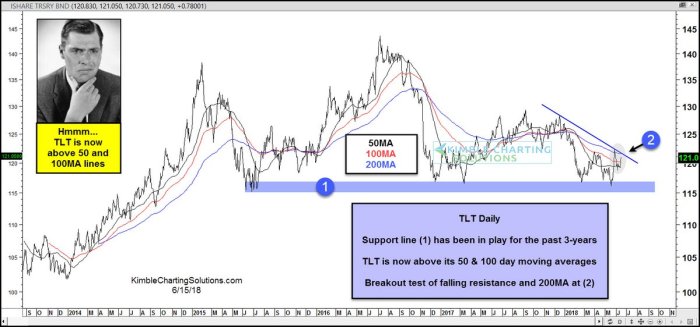
- Chris Kimble @KimbleCharting – Despite rising rates of late,
$TLT has held above 3-year support and is now above its 50 and 100 ma lines.$SPY
The macro view seems more emphatic:
- Raoul PalVerified account @RaoulGMI – Jun 14 – If you accelerate rate rises, have a stronger dollar and are in late cycle, then future growth and inflation expectations will come down. This is why we have a flatter curve. This is why 10 yr + bonds bonds will rally. This is probably a H&S top in yields forming.
 The US high yield ETFs, HYG & JNK, rallied by about 55 bps this week. What is the message for High Yield from comparisons with other asset classes? Mixed seems to be the answer:
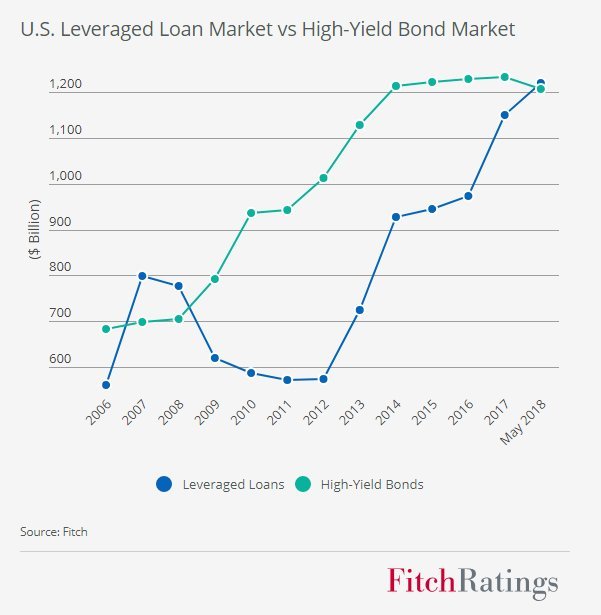
- Tracy Alloway @tracyalloway – The US leveraged loan market has surpassed junk bonds for the first time since 2008. Now stands at $1.22 trillion, according to data from Fitch. https://www.fitchratings.com/s
ite/pr/10034245 …
 On the other hand,
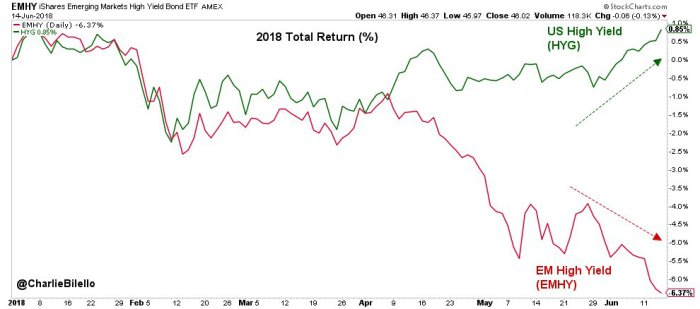
- Charlie BilelloVerified account @charliebilello – US High Yield Bonds strengthening, Emerging Market High Yield Bonds weakening. Divergence to watch.
$HYG$EMHY
What does this say for EM stocks? More on that later.
3. US Stocks
Last Friday, the stock market “seemed unstoppable” to some and the gurus we featured were almost uniformly positive. The story is different for this Friday. After a churning week in which NDX, Russell 2000 & Transports closed up about 1%, the Dow closed down 90 bps and the S&P 500 was flat, most of the commentary we find is negative to cautiously optimistic.
The stock market, in our view, survived a more hawkish than expected Powell, a dovish Draghi & same as old Kuroda. It also survived its biggest threat on Friday morning. The Dow was down 200 points pre-open apparently because of tariffs on $50 Billion of Chinese exports by President Trump. This is probably the biggest non-monetary-policy threat to the stock market. And we could see a repeat of Friday morning’s decline on Monday morning if China retaliates hard over the weekend.
Our own view is that a China-US trade war is likely to be more noise than anything else. The Chinese could put on a show for domestic consumption but they know the reality:
- MacroQuant @MacroQuantCTA – Bruises to the US economy but a total collapse of China’s economy. China is sitting on debt time bomb without reserve currency. A minor spark, like the trade war, can set off Minsky moment. China stocks reflecting the stress.
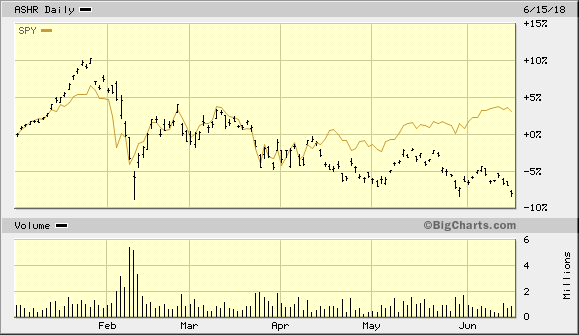
Shanghai market closed at a new 52-week low on Friday. The YTD performance tells the same story, especially since mid-April:
 With this reality, we are persuaded that at least a portion of Friday morning’s decline was due to Option Expiration shenanigans. In any case, GOOGL was only down 7 bps on Friday, Netflix was only down 23 bps while Amazon & FB were down a hard 48 bps. And, wonder of wonders, Brazil’s EWZ actually closed up 1% on Friday.
Forget simpletons like us. How does an experienced steady hand express his view?
- Lawrence McMillan of Option Strategist – In summary, the various indicators have remained bullish and now the $SPX chart is making steps towards joining the crowd. There have been some news-oriented declines in recent days, but the technical factors still remain very strong.
Tom McClellan drew a bullish message from the Treasury-Bund Spread on Thursday:
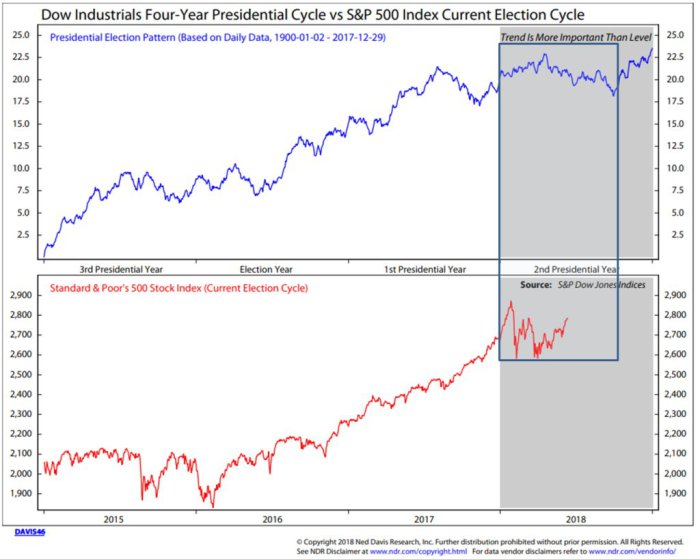
- “This Treasury-Bund spread also has the interesting property of giving us an early warning of major secular tops in the U.S. stock market. … The message now from seeing a continuing rise in the Treasury-Bund spread is that we are at least several months away from the big final end to this decade’s long bull market. But again, that does not mean we cannot have a scary correction, as is typical during the second year of a presidential term.”
Speaking of second year of Presidential cycle:
- Babak @TN we are in the second and weakest year of the four year long Presidential Cycle, which would suggest it is wise to curb our collective enthusiasm for equities chart from NDR showing Dow Jones Industrial 4 year Presidential Cycle
 What about breadth?
- Andrew Thrasher, CMT @AndrewThrasher – NYSE Adv-Dec Line has been slowly trending lower most of June. There’s still a lot of strength in specific names but broadly speaking we aren’t seeing the same degree of broad participation as what would be desirable.
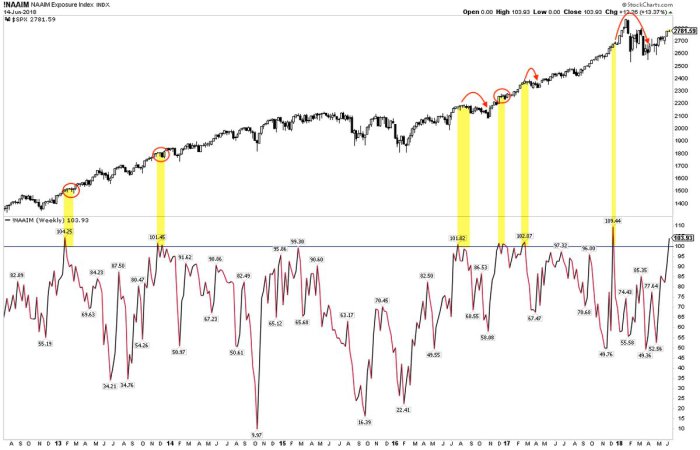
What about positioning?
- Urban Carmel @ukarlewitz Sentiment: Active managers now levered long. Pretty uncommon. Either multi-week consolidation (circle) or, if higher, those gains given back (arrow). Like the
$CPCE chart$SPX
Does all this lead to exhaustion?
- Raoul PalVerified account @RaoulGMI – With monthly, weekly and daily DeMark tops in the SPX, maybe the stock market is going to have to price in some very real political instability going into the mid-terms, be it the escalating geopolitical risks of tariffs or the escalating domestic political scandal…
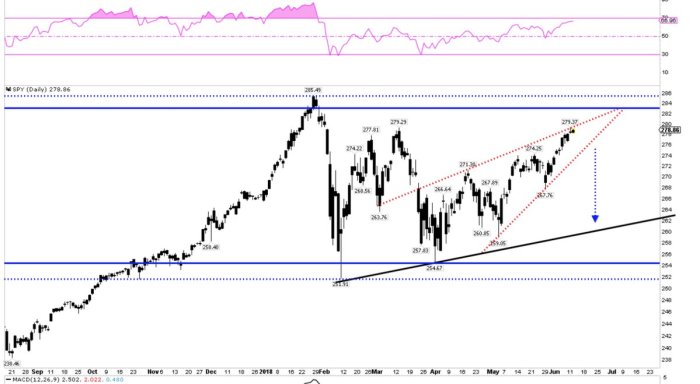
And what could be a target on the downside?
- Mella@Mrs_Northy –
$SPY – that’s a rather large wedge
What about a sector buy? Greg Harmon of Dragonfly capital wrote about Consumer Staples:
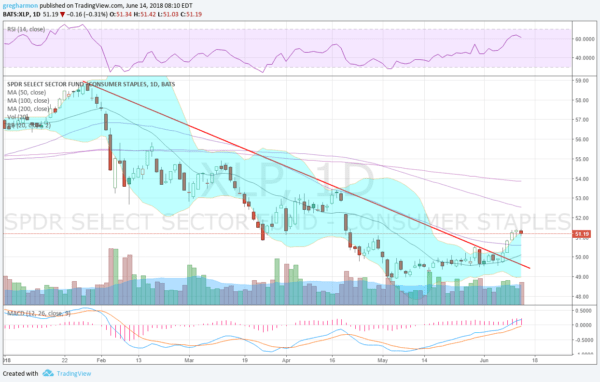
- “Thursday it broke over the falling trend resistance that had been in place since the top in January. Friday it moved up over the 50 day SMA for the first time since January as well. Momentum has also moved into bullish territory. The RSI has ticked up over 60 with the MACD rising and positive. Finally, the Bollinger Bands® have opened allowing a move to the upside after a tight squeeze.”
- “All this has led to a good start for a reversal in Consumer Staples. For it to show real strength the next step is a move over April high, filling the gap. That would likely take it to the 200 day SMA for the next real test of strength.”
If an ignored sector like Consumer Staples has hope, how about a truly discarded asset class?
4. EM stocks
Is there a class as despised & discarded as EM? Just look at EM currencies:
- (((The Daily Shot))) @SoberLook – Chart: The
@jpmorgan Emerging Market Currency Index –
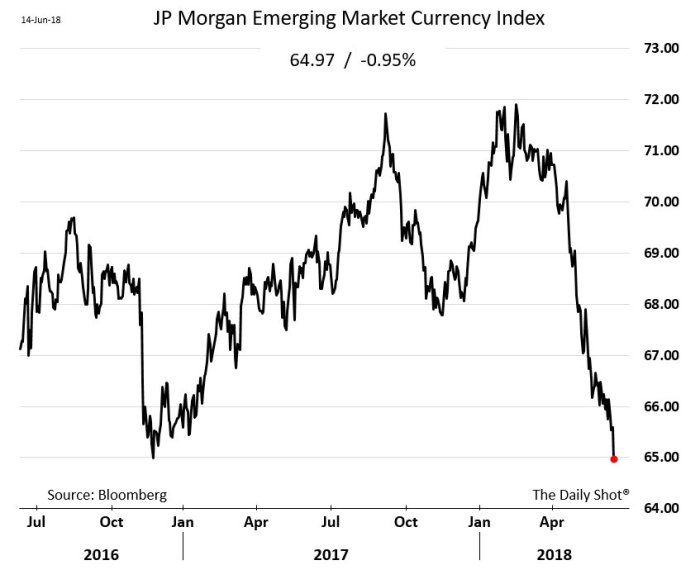
Take a closer look and ask yourselves – what if EM FX bounces from here? Will we have a double bottom? If you are brave enough to dabble, where might you get a big bang?
- jeroen bloklandVerified account @jsblokland –
#Brazil’s#Bovespa heading for a bear market as equities are down almost 20% from their high in February!
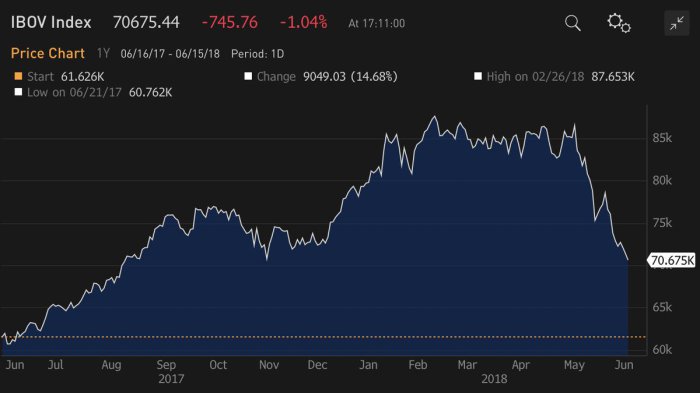 Look again and you will notice that the index is just above the Nov 2017 low from where it bounced into February. What if Brazil bounces from here? Would it be a joint bounce in Brazil’s currency & stocks? We have heard of faint hearts never winning ladies but what about market Goddesses? Do they favor crazy minds that might jump into Brazilian stocks? Only perhaps if they jump in with very hard & tight stops. After all, we presume market Goddesses only help those who help themselves. Of course, those who jumped into EWZ on Friday morning are already up 1%.
Now let us to go a market as unlike Brazil as possible within EM. And look at the chart of a stock in that market, courtesy of J.C.Parets, a stock that is making new all-time closing highs as it breaks out of a 3-year base:
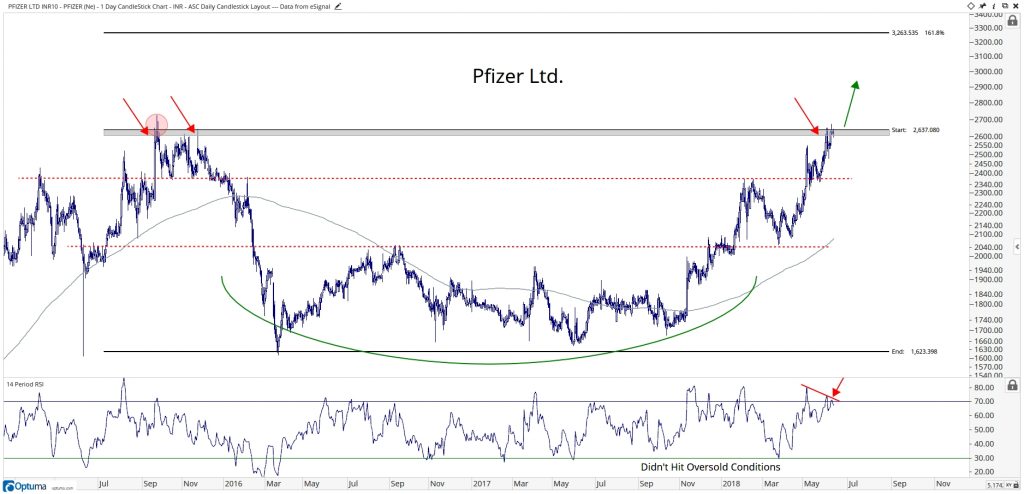 No, we are not calling US an emerging market and no, this is not Pfizer on NYSE. The above is a chart of Pfizer, India. We remember Pfizer, India because it was the best performing stock in India in 1993 and closed that year at a PE of 300. Of course, that was the year when the 3-month T-bill closed at an unprecedented yield of 3%, a level the gurus said would never been seen again. How far have we come when now the 10-year yield can’t stay above 3%?
1994 was a very different year when Greenspan raised interest rates several times & the 30-year bond had a horrible year. Obviously Pfizer India and the Indian stock market got torched.
That brings us to Chairman Powell of this week. What if Treasury yields are peaking, at least for a month or two? And what if oil does go down some more & stay down? That would be beneficial to both Indian Rupee & the Indian stock market. And a stock like Pfizer India could be a beneficiary if Parets remains constructive on it.
We, of course, have loved the consumer sector of the Indian market. Whenever we have discussed our passion for Bourbon biscuits, we have spoken about INCO, the consumer ETF. Look at how this has outperformed the broad index in India:
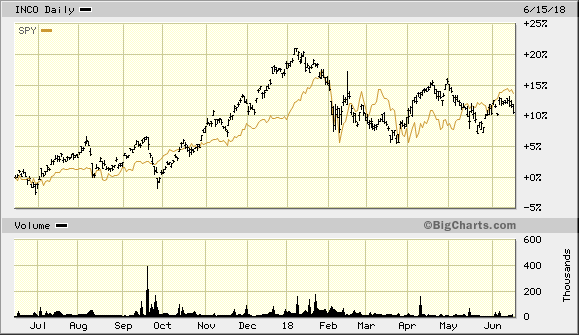
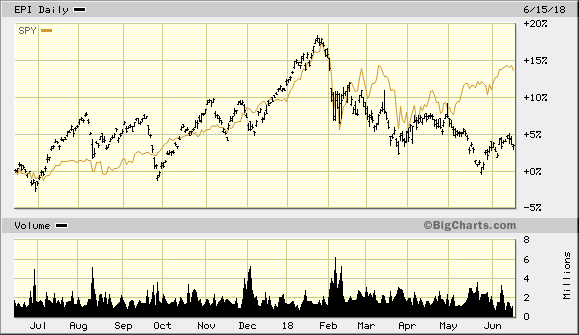 (EPI-SPY – 1 year)
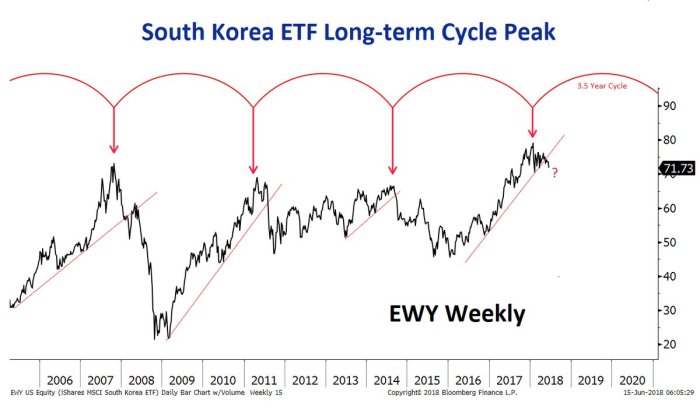
Of course, all the above is based on the assumption that EM FX stabilizes. What about the converse – an emerging market than could go down hard after receiving good news this week?
- Nautilus Research @NautilusCap –
$EWY Korea ETF Longer-term Peak Spacing (Possible Peak). https://www.nautilus-cap.com/About/RequestTrial …
 Getting back to Brazil, what do you think bothers Brazilians more? – The 20% fall in Bovespa, the crash in Real or what happened four years ago?
[embedyt] http://www.youtube.com/watch?v=3HG7lcKh3w4[/embedyt]
The fall in Real & Bovespa are material while soccer is spiritual in Brazil. So we guess the latter.
5. Gold, Silver, Oil, Natural Gas
If trading Gold has broken hearts, then trading Silver has ripped them out. On Thursday, many spoke eloquently about the rally in Gold & the breakout looming in Silver. Then came the fall down the elevator shaft on Friday when Gold fell nearly 2% and Silver crashed by nearly 4% . Thank Goodness, we stopped trying to figure out these crazies sometime ago.
Oil was down worse on the week but seemingly because of rational reasons – Saudi Arabia & Russia hinting they want to get out of the Oil price accord. This is presumably ahead of next Friday’s OPEC meeting.
- Raoul PalVerified account @RaoulGMI Also with OPEC weakening and Trump applying pressure, the odds of a very sharp move lower in oil is extremely high.
How much lower, Raoul?
- Raoul PalVerified account @RaoulGMMore – Goodbye oil. It was nice knowing you at $74. Hello, $50 handle…
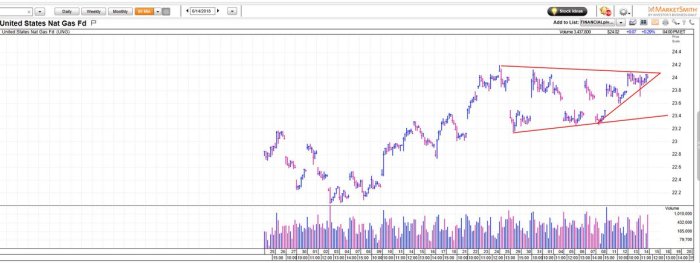
 But Natural Gas could be another story:
- Mark Newton @MarkNewtonCMT –
$UNG Natty Gas ETF increasingly an attractive risk/reward#IBDPartner & should move to 26 technically as$NG_F exceeds $3 before July seasonal weakness sets in – Bought small & will increase on breakout@MarketSmith@IBDinvestors
6. A Tiger changing color?
Perhaps a leopard cannot change his spots, but it seems a Tiger can change his color:
- Anantha Krishnan M
@writetake – Photographer Dinesh Kumble
@dkumble captured this picture of a male tiger at Kanha Tiger Reserve. Looks like out for a stroll after a partial mud bath.#kumbled#wildlife

A gorgeous photo indeed!
Send your feedback to [email protected] Or @MacroViewpoints on Twitter