Summary – A top-down review of interesting calls and comments made last week in Treasuries, monetary policy, economics, stocks, bonds & commodities. TAC is our acronym for Tweets, Articles, & Clips – our basic inputs for this article.
Editor’s Note: In this series of articles, we include important or interesting Tweets, Articles, Video Clips with our comments. This is an article that expresses our personal opinions about comments made on Television, Tweeter, and in Print. It is NOT intended to provide any investment advice of any type whatsoever. No one should base any investing decisions or conclusions based on anything written in or inferred from this article. Macro Viewpoints & its affiliates expressly disclaim all liability in respect to actions taken based on any or all of the information in this article. Investing is a serious matter and all investment decisions should only be taken after a detailed discussion with your investment advisor and should be subject to your objectives, suitability requirements and risk tolerance.
1.Two Handed Conditions?
Markets dealt investors one hand on Wednesday, an almost euphoric hand with Dow up 545 points or 2.1%, the S&P up 58 handles or up 2.1% and the NDX up 214 points or up 3%. EM also rallied hard and the Dollar was down. Even rates behaved well, down in the morning and up just a bit by the close. This euphoria was due to the nearly perfect results of the mid term election with President Trump & Republicans gaining seats & retaining control of the Senate and the Democrats winning the House.
Then Friday dealt investors a totally different hand, this one due entirely to the Federal Reserve & its statement following the FOMC meeting.
- David Rosenberg@EconguyRosie – In just 272 words, the Fed just told us all systems are a go to get to neutral. Soft capex and lower TIPS breakevens be damned. 3% funds (or higher), here we come! Stay liquid.
The reaction began after the FOMC statement. But, as usual, the real reaction of the markets came the next morning. It was a totally risk-off day with the Dollar up, stocks & commodities down hard. The worst hit was the NDX with Semis & FANG stocks clobbered with EM etfs.
So what happens from now until the end of the year? Does the stock market benefit from the traditional year-end rally or will they wilt into year end as they did in some years? What years you ask?
- David Rosenberg@EconguyRosie – Tue Nov 6 – Word to the wise. We have endured two 10% corrections in the same year for all three major averages. This has only happened in 1973, 1974, 1987, 2000, 2001, 2002 and 2008. All but 1987 signalled recession, but that wasn’t a pretty picture either.
To this day, we vividly recall what Abby Joseph Cohen said on CNBC back in October 2000. She said that the year-end rally always takes place unless there markets are faced with deflation. That was certainly the case in 2000, 2001, 2002 & 2008.
So what are we all facing?
2. Is it “starting to break“?
The PPI release on Friday said inflation/stagflation. But look at the 9-day collapse in Oil that is screaming forget about inflation. And you have cycle specialists like ECRI’s Lakshman Achuthan saying “inflation has already started to go lower”.
Isn’t there a dictum that says it is bullish when markets don’t go down on news that is bad for them? Look what happened on Friday – despite a strong inflationary/stagflationary PPI, Treasury yields fell by 3.5 – 5 bps along the entire curve. In fact, the 5-year yield fell the most – by 5 bps while the 30-year & 2-year yields fell by 3.7 bps. Rick Santelli pointed out the double top in the 10-year yield:
He cautioned though that the 30-year yield has not made a double top yet. But Paul Ciana of BAML saw short-term buy signals in both 5-year and 10-year Treasuries. He thinks they can bounce 3-5 points here. Best to view his charts & explanation directly:
.
But isn’t economic growth strong?
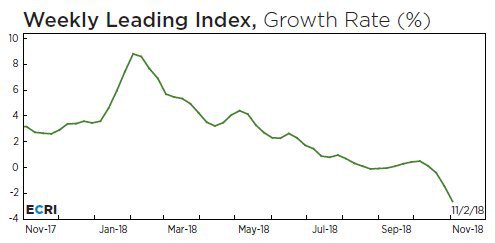
- Lakshman AchuthanVerified account @businesscycle – ECRI U.S. Weekly Leading Index growth decreased to -2.6%, a 139-week low.
#economy https://goo.gl/nQruiy
How are indicators of the global economy acting?
- jeroen bloklandVerified account @jsblokland – Wed Nov 7 – Interesting ‘decoupling’ chart! Global #PMI new orders index v 10-year US Treasury yield. ht @SBarlow_ROB
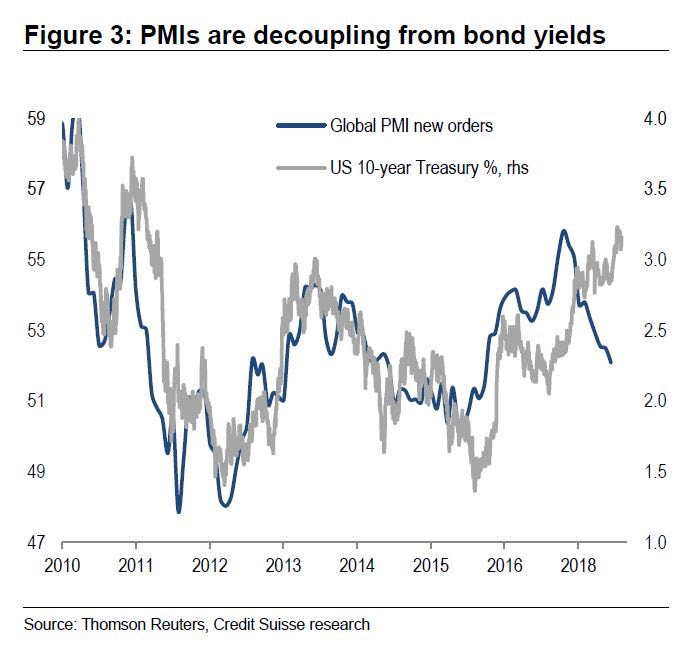
This chart above supports Cramer’s statement that the “Fed is simultaneously tightening while the world is slowing”. But hasn’t that been the Fed’s modus operandi until now, at least according to what Ellen Zentner of Morgan Stanley said on BTV on Friday morning?
- ” … the Fed has always hiked until they go too far; because a lot of the data is lagged, right? So you don’t know you have gone past neutral until you have gone past neutral already & it is too late to take those hikes back“
What is the old adage? The Fed keeps tightening until something breaks. Well, Rick Rieder was quoted by BTV on Friday morning saying “its starting to break a bit”:
- ” the tricky thing is … while … they are raising the front of the curve, the Treasury has to issue a trillion dollars of Debt, you are stuffing the system with so much debt that you are pressuring interest rates; the mortgage rate is up at 5%; look what’s happened to affordability, look what’s happening to existing home sales, new home sales, building permits, it’s a big deal, it’s starting to break a bit”
Does Chairman Powell see what Rick Rieder of BlackRock sees? Perhaps we will find out when he speaks next Wednesday.
3. Stocks
Greg Harmon of DragonFly Capital laid out what he sees on Friday:
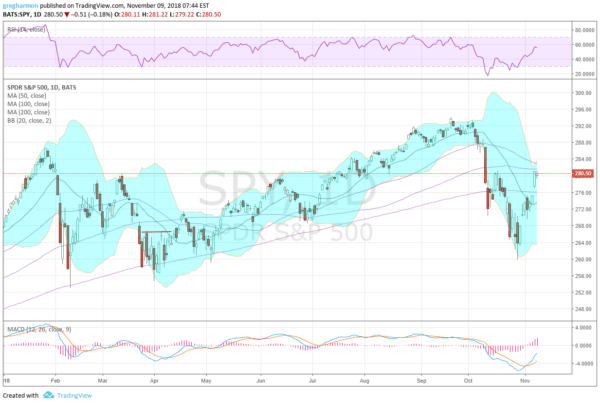
- The S&P 500 is up nearly 8% from its October 29th low.
- The October 29th low was a higher low following a higher high on weekly and monthly charts.
- The S&P 500 is back over its 200 day SMA.
- The S&P 500 closed over its October 16th bounce making a higher high.
- Deep levels of the MACD (momentum) have reversed and it is rising.
- RSI (also momentum) made a higher low on October 29th and is now near the bullish zone.
- The Bollinger Bands® are opening as price rises to the top of them.
On the other hand, Lawrence McMillan of Option Strategist prefers to wait:
- In summary, there are a lot of buy signals among our indicators. The more recent ones — put-call ratios, in particular — seem pretty compelling. But I am not interested in fighting against the $SPX chart. So, we would have to see $SPX close above 2820 before we turned bullish. Lacking that, we are still leery of the downside.
Tom McClellan appears closer to a clearly bullish call. But even he is awaiting confirmation of liquidity being added. This is despite his oscillator breaking above 200 this week:
 He argues that the stock market is “transitioning now into the bullish phase of seasonality, … positive liquidity should be coming back … it should be a worldwide return on liquidity lasting until about late April of next year “. He thinks this phase would begin around the middle of November provided we get confirmation of liquidity.
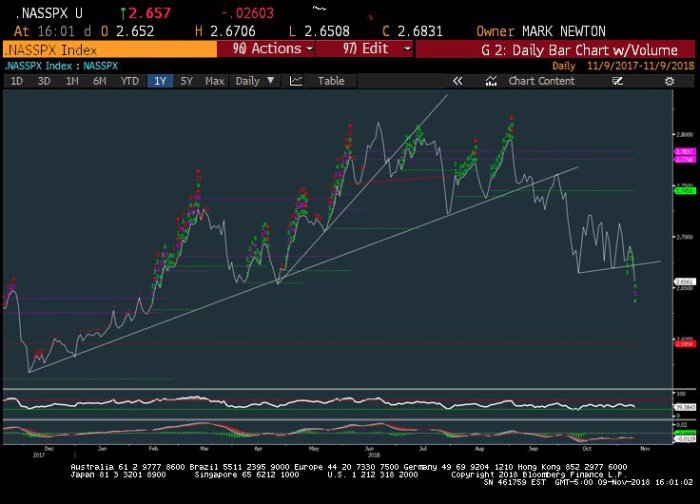
Another issue according to Mark Newton:
- Mark Newton @MarkNewtonCMT ––
#NASDAQ vs the#SPX broke down today, violating support which had held recently- This adds to the thinking of why there might be more to go, if Technology cannot bottom just yet- And important to watch this carefully@Newtonadvisors
 Some are sure of their long term call:
- Cam Hui, CFA @HumbleStudent Bullish or bearish? What’s your time horizon?
$SPX$SPY https://buff.ly/2OxgkFA
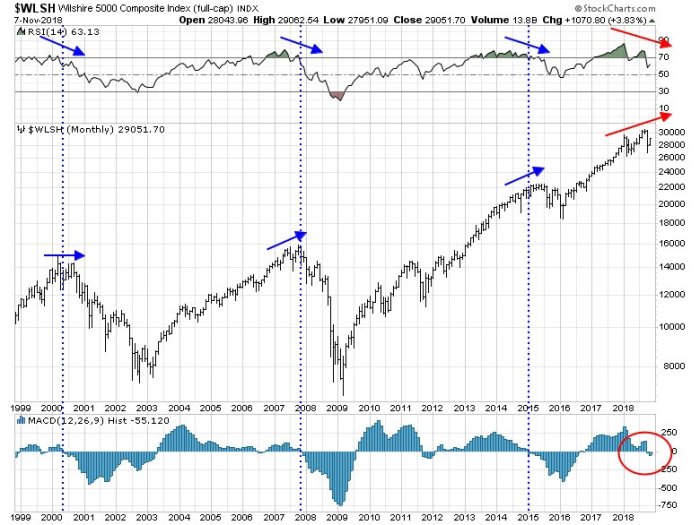
- “From a very long-term perspective, the negative monthly RSI divergence and MACD sell signal is too worrisome to be ignored. These conditions suggest that the market is making a broad-based top.”
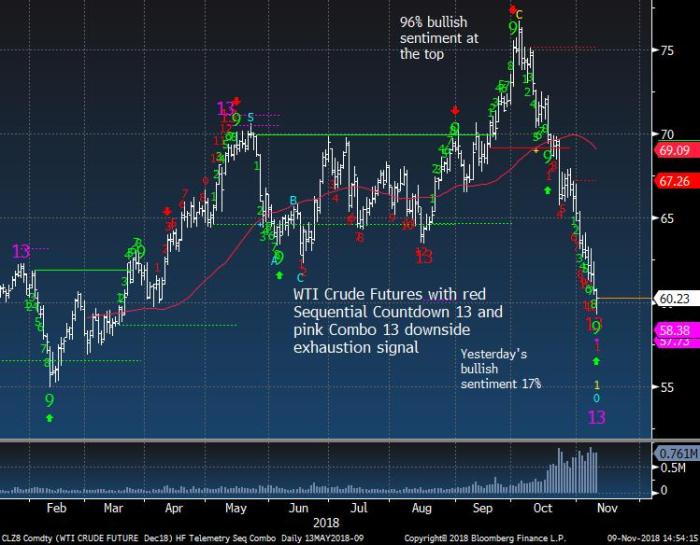
4. Oil
Talk about a collapse:
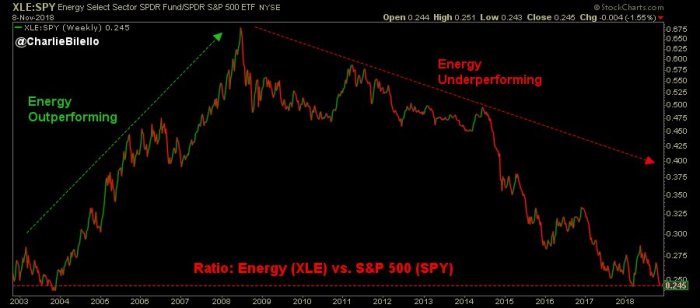
- Charlie BilelloVerified account @charliebilello – Ratio of Energy sector to the S&P 500 is closing in on its lowest level in 15 years.
$XLE$SPY
 Is it so bad that it could be good? Or is the decline getting exhausted?
- Thomas Thornton @TommyThornton – Crude bullish sentiment is at 12% bulls down from 96% on Oct 1st when our bias turned negative. We turned positive today with downside DeMark Sequential and Combo Countdown 13 exhaustion signal.
#OOTT#OPEC Hedge Fund Telemetry Sentiment Chart https://www.hedgefundtelemetry.com/crude-light/
5. Trains & Emotions
We have always liked trains, especially the local trains in Mumbai. Below is a love at first sight that happens on a Mumbai local. During a recent photo session, a millenial photographer thought the song below was “cool”. So here it is.
https://www.youtube.com/watch?v=1U9kTcjU3os
Send your feedback to [email protected] Or @MacroViewpoints on Twitter