Summary – A top-down review of interesting calls and comments made last week in Treasuries, monetary policy, economics, stocks, bonds & commodities. TAC is our acronym for Tweets, Articles, & Clips – our basic inputs for this article.
Editor’s Note: In this series of articles, we include important or interesting Tweets, Articles, Video Clips with our comments. This is an article that expresses our personal opinions about comments made on Television, Tweeter, and in Print. It is NOT intended to provide any investment advice of any type whatsoever. No one should base any investing decisions or conclusions based on anything written in or inferred from this article. Macro Viewpoints & its affiliates expressly disclaim all liability in respect to actions taken based on any or all of the information in this article. Investing is a serious matter and all investment decisions should only be taken after a detailed discussion with your investment advisor and should be subject to your objectives, suitability requirements and risk tolerance.
1.”believe it or not”?
Rarely do we find an article that makes its case so well as the BlackRock article “Wall Street’s believe it or not?” Perhaps we liked it so much because it also fits with how & what we think. So we begin our article this week by providing some excerpts from this article by Rick Rieder, Russ Brownback & Trevor Slaven of Blackrock:
First, the Ugly:
- “Indeed, the market moves last month were unlike any we have seen in our careers with many assets experiencing more year-to-date price volatility than what was realized over the entire previous decade. … The fear was even more palpable in the markets for implied volatility where the cost of options approached the ten-year 100th percentile in nearly every asset class where options markets exist, while the CBOE’s VIX index hit an all-time high. … In the U.S., equities witnessed their third worst month in modern history, while U.S. high yield bond yields doubled in a two-week interval. Astoundingly, even the “risk-free” U.S. Treasury market was upset. … Global investors began hoarding cash in record-setting amounts, with money market funds receiving $500 billion of capital inflows over a four-week span. To be sure, the entire financial economy has been inundated with a true 100-year storm. … This financial panic reflected the unfolding left-tail scenario for the global economy that appears to be an unprecedented halt on a great deal of economic activity. “
Then they write – “Fortunately, there is sufficient reason to view this growth shock as temporary.” But do they see a brewing right-tail scenario?
- “Global policy makers have been bold and timely in both their fiscal and monetary policy responses, so much so that we see a right-tail scenario brewing for the financial economy in the quarters ahead. … Indeed, in February and March alone, global fiscal and monetary policy responses totaled a staggering 11% of global GDP, and it’s highly likely that there’s more policy assistance on the way.”
Is there a Good marriage here between fiscal & monetary?
- “With respect to U.S. fiscal policy, we are convinced that the potency of the CARES Act is being systematically underestimated by conventional wisdom. Nearly all of the targeted categories of the legislation have impressive multipliers associated with them. The healthcare, research and development, infrastructure, and direct transfers to household segments all have multipliers that approach two, by some estimates, while the state and local aid, refundable rebates, and payroll tax holiday initiatives all have projected multipliers of nearly 1.5x. …. we see at least $1 trillion in spending over the next 90 days – that’s an annual run-rate of more than 20% of U.S. GDP, which is staggering and unprecedented, and will go a long way towards dampening the growth shock.“
And is there also a Great in this outlook?
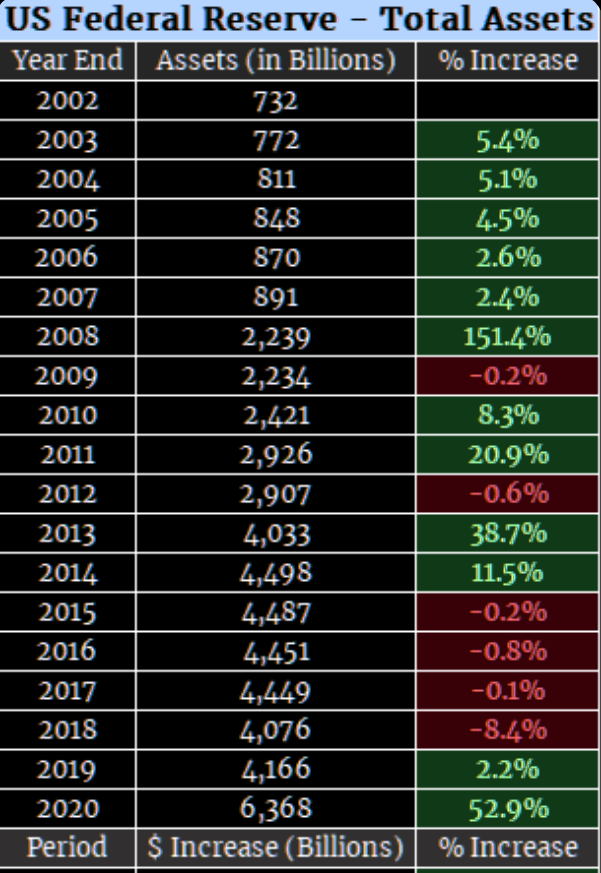
- “As far as the Fed is concerned, we’re convinced that its policy response was truly historic, wholly debunking the incorrect notion that their policy toolkit is finite. … we see the Fed’s balance sheet growing by nearly $6 trillion before the end of Q3, an eye-popping number considering that the total size of their balance sheet was near $3.8 trillion as recently as last September. In fact, the Fed will likely end up purchasing the equivalent of 20% of the U.S. Aggregate index over just a six-month window.”
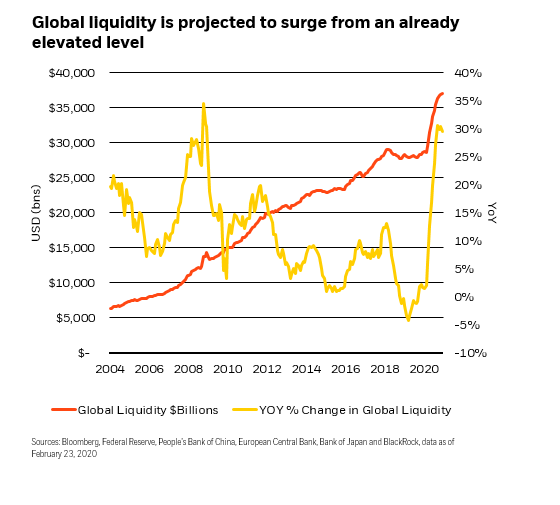
- “We estimate that by year-end 2020, global liquidity will exceed 40% of global GDP, shattering the previous record and providing critical support for a nervous and heretofore fragile financial economy stunned by the crisis. In short, we think that absent some new shock, the holistic global policy response has likely been sufficient to provide support for most asset markets as the virus evolution unfolds in earnest.”
That’s all talk. What about the walk, meaning “portfolio construction & asset allocation” in Maha-Jan (big-shot) lingo?
- “The potential to construct a 4% to 5% yielding portfolio is now significantly more attractive than at the beginning of the year … Even on depressed earnings estimates, discounting these cash flows with a normalized risk premium of 3.5% and today’s 1.0% risk-free rates would imply the S&P near 3,500 over the next year or two. … Compelling long-term value is clearly forming in U.S. equities.“
- “we plan on keeping a significant cash cushion … we will follow the Fed and other DM central banks by purchasing what they’re purchasing, and assets that rhyme with those. That means buying U.S. nominal duration where there is still scope for rates to rally further (i.e. the back end), which also provides a dependable risk hedge. We will own some U.S. breakevens that are cheap for technical reasons, and we will be selling U.S. rate volatility as rates come down and are pinned lower, especially at the front-end.”
- “…. we want to pick away at some sectors of the equity market that have had valuations destroyed beyond even worst-case scenarios, such as healthcare, biotech, technology, defense, home builders, and others. We’ll target moderate equity exposures but can take on more exposure through selling volatility that would put us into long positions at lower levels and thereby benefit from still crazy-expensive implied volatility.“
- “We’ll cautiously grow EM exposure, though EM fundamentals remain a ‘known unknown’ in terms of the crisis evolution … Finally, we also plan on growing the equity exposure, this time in outright expressions as well as through buying options that will likely have cheapened considerably.“
The conclusion?
- “While the magnitude of this unfolding crisis is truly historic, eventually things will return to a more normal equilibrium, and as is often the case, the markets will lead the way back to normalcy, believe it or not!”
The above is merely a glimpse into BlackRock’s thinking. Everyone should read the entire article in our opinion. The portfolio construction section is really helpful & interesting especially in laying out a 3,500 target for the S&P and suggesting selling out of the money puts to buy stocks you like at your chosen price at a later date. Very few guests on FinTV suggest this time honored strategy.
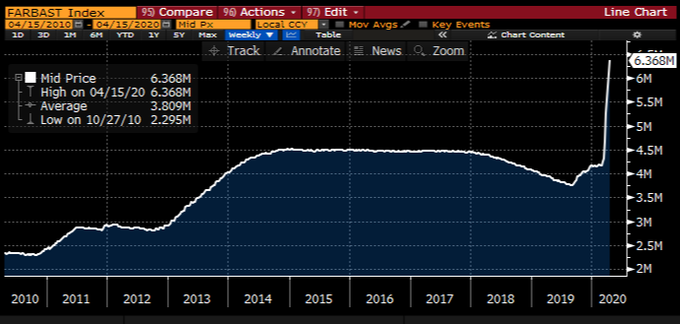
But we don’t understand why this BlackRock team used the future tense & a future date (end of Q3) to estimate when the Fed’s balance sheet will reach $6 trillion. Either their machines are wrong or the Bloomberg terminal used by Lisa Abramowitz is wrong:
- Lisa Abramowicz@lisaabramowicz1 – Another week, another large increase in the Fed’s balance sheet. Last week, the central bank added nearly $300 billion to its assets, bringing them to a total of about $6.4 trillion. That’s up $2 trillion from just a month earlier.@TheTerminal
On the other hand, The Market Ear folks would scoff at both of them, right?
- Market Ear – FED BS – next stop $10 trillion? In 2008, the Fed grew its balance sheet by over 151%. A similar increase this year would move the Fed’s balance sheet above $10 trillion.
2. Win over CoronaVirus & what Market may look like then?
Four weeks ago, we used the analogy of Pearl Harbor to discuss the unleashing of American power against CoronaVirus. In this week’s article, we extend the analogy to Midway, the battle that turned US Navy into an offensive juggernaut & reduced the Imperial Japan Navy to rearguard defensive action.
Thursday evening was big, in our opinion – First President Trump’s “Opening Up America Again” launch, then the report about Gilead’s Remdesivir drug about a potential cure & third, the Boeing announcement about beginning aircraft production in their Seattle factory.
Whether Thursday proves to be the launch of America on the offense against CoronaVirus or not, Friday’s markets showed how they may behave on victory against the deadly enemy:
- Treasury rates rose; High Yield ETFs rallied; Dow & S&P rallied hard; NDX badly underperformed; Russell 2000 outperformed big time; Banks rallied 5%, Homebuilders rose almost 5%; XLE rallied by 10.6% all blowing away XLP (up 1.53%) and XLV (up 2%). Airlines exploded up; Gold & Silver fell while Copper rose with Freeport up 10% & Mosaic up 5%;
Friday was a huge statement against the deep disinflationary or almost deflationary psychology that has taken over. Was it a signal that an early escape from CoronaVirus will lead to a resources & value spike?
Or was it just one day’s squeeze of shorts?
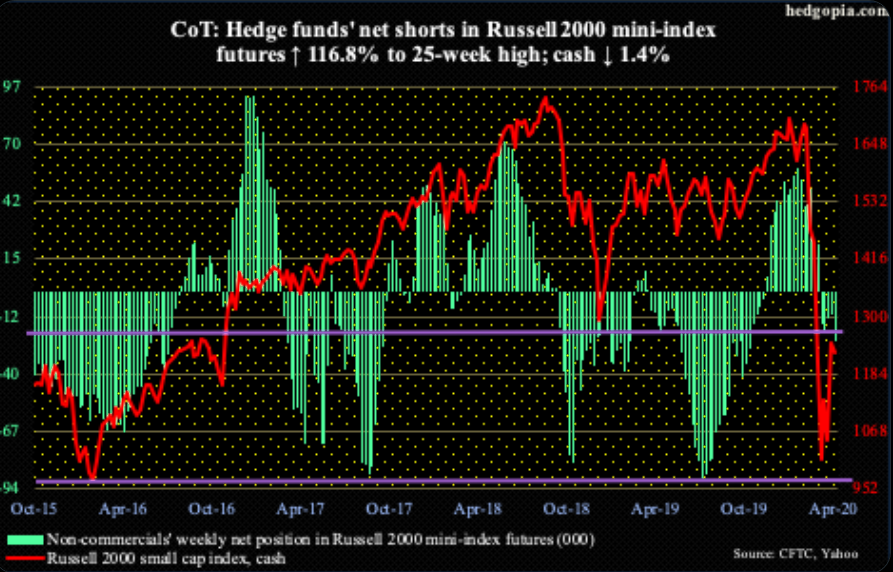
- Market Ear – Hedge Funds’ net shorts in RUT futures at 25-week high. Is this the next one to monster-squeeze?
And the other?
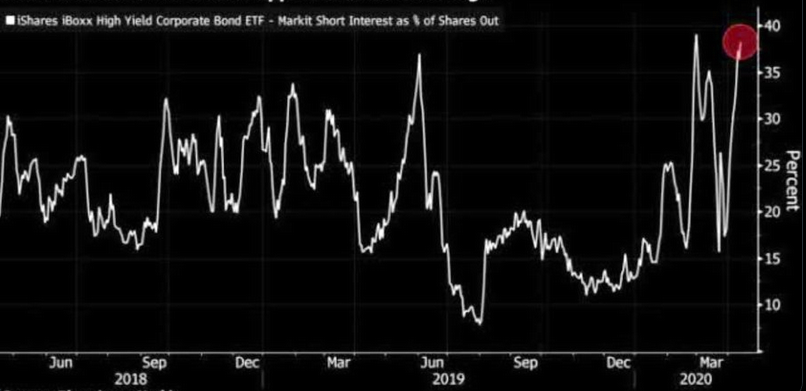
- Market Ear – Short interest in HYG back to all time high; I fought the FED and the…..
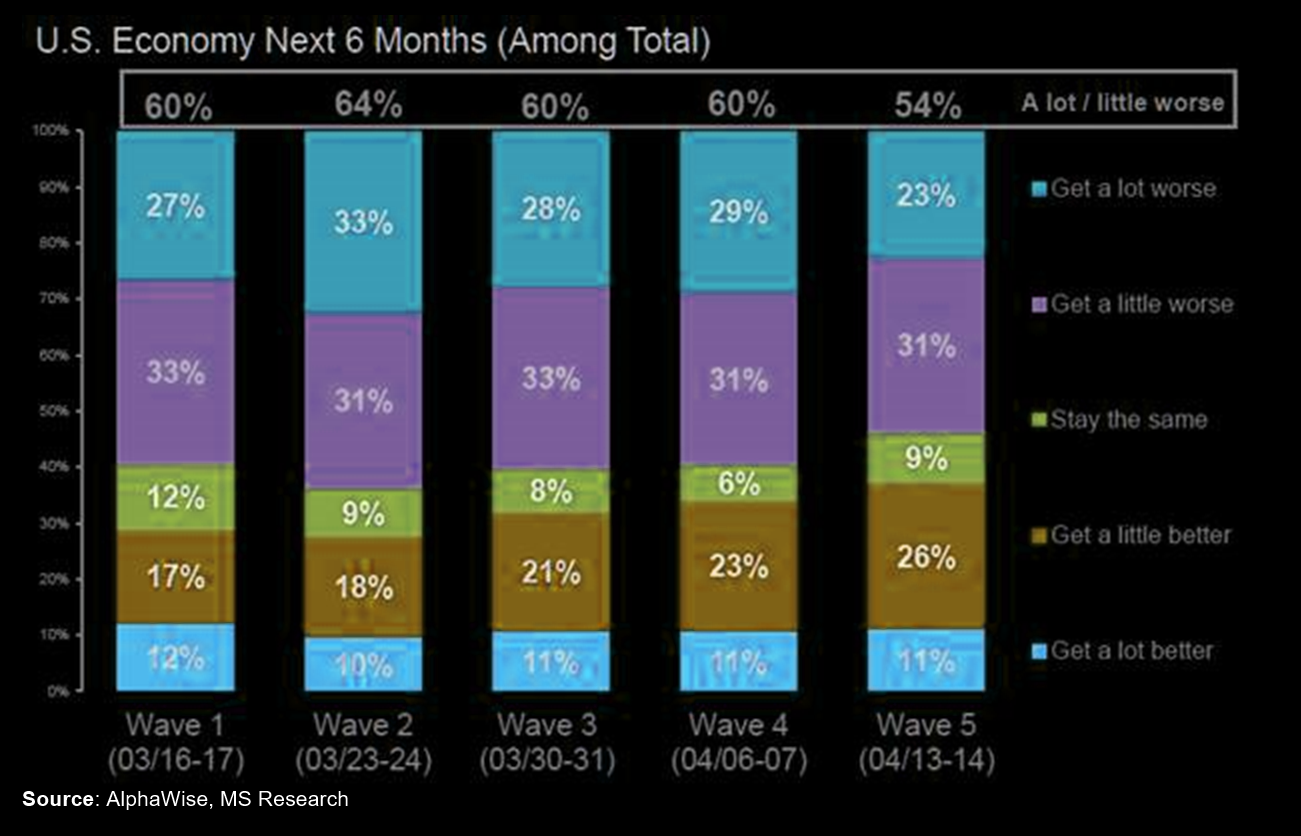
But all this is assuming some others also realize that the worst about CoronaVirus might be behind us. Is there any evidence that at least some feel that way? The MS survey below of 2,000 US consumers 16-75 yrs old conducted on Apr 13-14 reveals interesting findings, courtesy of Market Ear;
- “13% said they / spouse already lost their job, and another 28% consider job loss to be somewhat or very likely over the next year. These numbers have fallen relative to the prior two weeks, and more consumers (60%) are beginning to see job loss as unlikely“
- “a significantly lower number of consumers (54%) now think the US economy will get worse in the next six months compared to an average of 61% in the last four weeks“
- “fewer consumers (32%) expect their own finances to get worse over the next six months“
All this plus “Hedge Fund equity beta at 10th percentile” seems to be persuading quants like JPM’s Marko Kolanovic to be bullish & predicting all-time new highs in stocks by early year. And, in his view, “CTAs could go long equities at ~2900, and Vol-targeting funds should increase equity exposure… “.
3. Sell the stock rebound?
Last week we featured smart guys who said they were going to fight the Fed by shorting the S&P at 2,800. That worked for one day, Monday. Then S&P rallied to closed up 3% for the week. But it closed at 2875, some 25 handles below the 2900 level above which Kolanovic says CTAs will start buying.
That has not deterred the smart folks we follow. Not even up 3% on S&P and up 7.2% on NDX against their shorts.
- Thomas Thornton@TommyThornton – A lot of DeMark Sell Setup 9’s today across the board – indexes, ETF’s, stocks. More on today’s hedgefundtelemetry.com
This week a number of luminaries re-expressed distrust of this S&P rebound as they have recently including David Rosenberg & Jeff Gundlach. But this week is different in that the guru who has been tweeting long term bullish tweets about the S&P switched this week to warn about downside, and that by using November 2007 & October 2008:
- SentimenTrader@sentimentrader – – The S&P 500 closed up more than 0.5%. And yet more than 70% of volume on the NYSE flowed into declining securities (thanks, GE). That’s only happened twice before in 58 years (in November 2007 and October 2008).
The above followed the previous day’s short term warning:
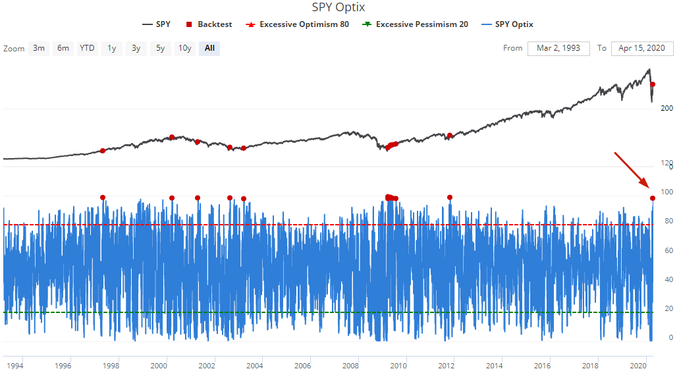
- SentimenTrader@sentimentrader – Short term headwinds for stocks: Our $SPY Optimism Index has reached 98, the highest level in almost a decade When short term optimism was this high in the past, the S&P usually pulled back in the short term
But what about the large shorts in Russell 2000? Well, the situation in S&P is starkly different:
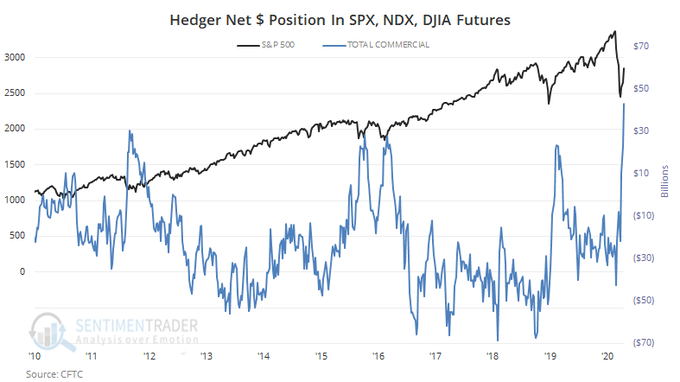
- SentimenTrader@sentimentrader – As of Tuesday, hedgers were holding $42.7 billion worth of equity index futures. That’s an all-time high.
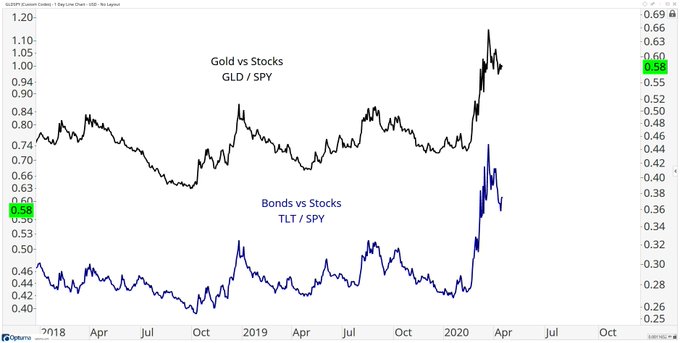
Below is a cross-asset look at S&P at these levels:
- J.C. Parets@allstarcharts – to me, if you think buying the US Stock Indexes here is a good idea, then you also think these charts will go down. I do not think that happens $GLD $SPY $TLT
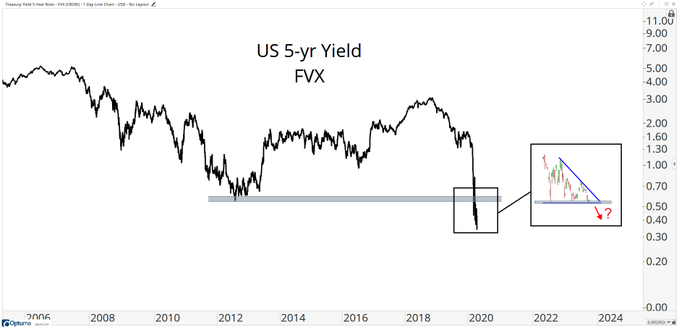
And Treasury yields fell this week with 30-yr & 10-yr yields down 8 bps & the 5-3 yr curve down 4 bps on the week. This is consistent but less powerful than the 13 bps fall in German 30-yr yield & 16 bps fall in German 10-yr yield this week. And consistent with down 1.5% move for the week in HYG & JNK. And also consistent with below:
- J.C. Parets@allstarcharts – do you think interest rates go higher from here? If you don’t, then why don’t you own bonds? Is it like this? $FVX
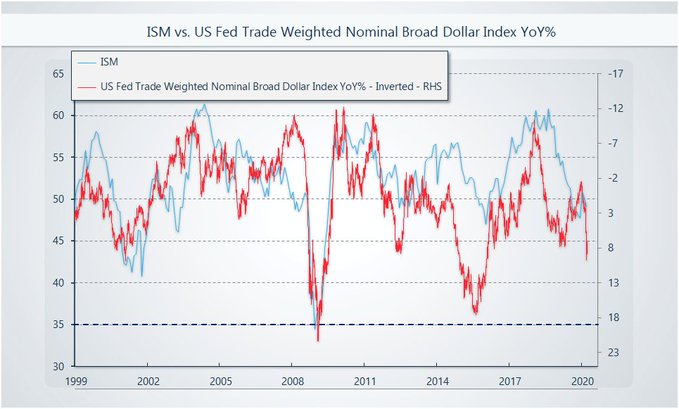
And it might also be sadly consistent with the biggest danger for the world economy.
- Raoul Pal@RaoulGMI – – I sense that everyone is bearish the dollar due to the Fed actions. As you know, I am firmly in the dollar bull camp. This chart helps explain my view – the dollar is cyclical and as the ISM falls to 35 or lower, the dollar should rally hard (+18%) (Dollar inverted here)
Send your feedback to [email protected] Or @MacroViewpoints on Twitter