Summary – A top-down review of interesting calls and comments made last week in Treasuries, monetary policy, economics, stocks, bonds & commodities. TAC is our acronym for Tweets, Articles, & Clips – our basic inputs for this article.
Editor’s Note: In this series of articles, we include important or interesting Tweets, Articles, Video Clips with our comments. This is an article that expresses our personal opinions about comments made on Television, Tweeter, and in Print. It is NOT intended to provide any investment advice of any type whatsoever. No one should base any investing decisions or conclusions based on anything written in or inferred from this article. Macro Viewpoints & its affiliates expressly disclaim all liability in respect to actions taken based on any or all of the information in this article. Investing is a serious matter and all investment decisions should only be taken after a detailed discussion with your investment advisor and should be subject to your objectives, suitability requirements and risk tolerance.
1.To Zero!
That is what Carter Worth of CNBC Options Action said of Treasury rates last week. But that was a passing comment on that show. In contrast, Priya Misra of TD Securities told Jonathan Ferro of BTV last week that she was getting incrementally bullish on Treasuries & said we would not get back to the 60-80 bps range of 10-year yields. Kudos to her & Bob Michele of JPM who was also said rates would fall.
The entire Treasury curve melted down in yields and flattened hard – 30-year yield fell by 9.6 bps; 20-yr by 8.4 bps; 10-year by 4 bps; 7-year by 2.6 bps; but the 5-year only by 1 bps. TLT was up 1.8% and EDV was up 2.5% beating stock indices decisively and everything else except Gold & Silver.
Ms. Misra reappeared this week on BTV with Jonathan Ferro and said that she is looking for a “flatter curve & lower rates” and that “over the next couple of months, the 10-year yield would make a new low“. She also predicted that the Fed will stop talking about market structure & will start “buying a lot of long-end Treasuries“. She also pointed out the stimulus under discussion is $1-1.5 trillion, lower than the $3 trillion stimulus that is about to roll off; … So she said a “V-shaped recovery is very hard to see” .. Guess what! The 3-year, 5-year & 7-year yields made new historic lows on Friday, as Rick Santelli pointed out.
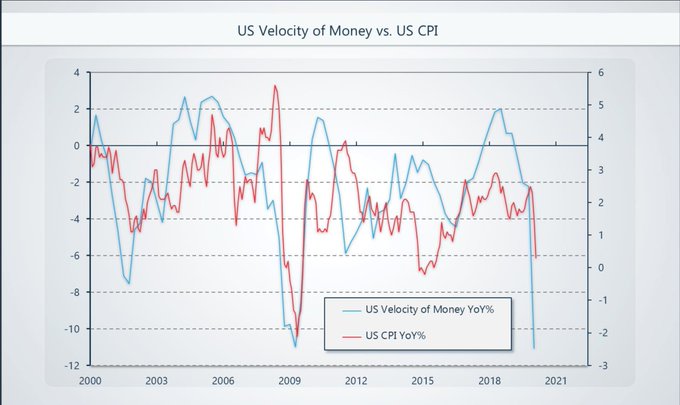
Remember when we began pointing out the re-emergence of the D-word concern? It was on June 6, 2020 just before the last Fed meeting. The following week CNBC’s Sara Eisen got Komal Sri-Kumar who predicted the 10-year yield would fall below 50 bps and Raoul Pal tweeted the following chart:
- Raoul Pal@RaoulGMI – And inflation is set to turn to deflation both in US and EU. Here is the US CPI vs. Velocity of Money…
What chart did Raoul Pal tweet this week, about 5-6 weeks after the above?
- Raoul Pal@RaoulGMI – – Bond yields are definitely fixated with a move to zero….yields grind lower every single day.
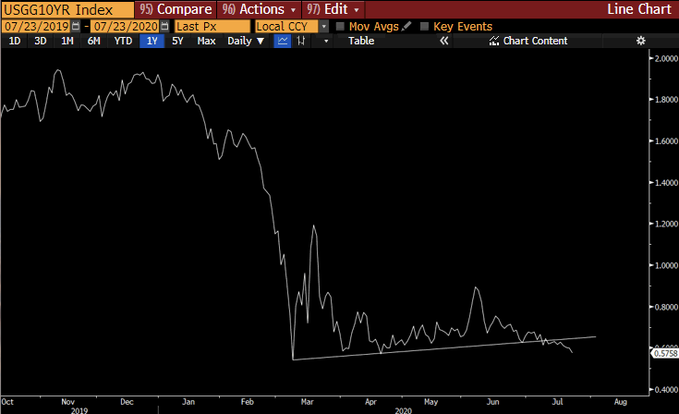
Every day is an exaggeration but every week is certainly true. Heck, we have been pointing out the relentless down move in yields since the last Fed meeting. We described Chairman Powell’s approach on that day as “He Giveth & Taketh Away” .while David Rosenberg described his approach as … “….Powell fails to play the role of economic cheerleader and doesn’t signal moving beyond high-yield … “.
The Fed’s balance sheet stopped growing from week of June 8 and guess what happened to Treasury rates. Rates across the curve have been falling relentlessly since that FOMC meeting & that week’s “stabilization” of Fed’s balance sheet and TLT has been rallying.
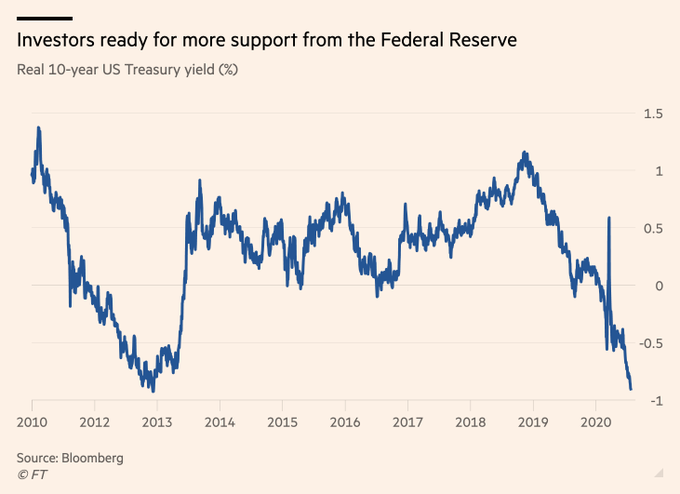
Not just the nominal rates but more insidiously real or after-inflation rates. If the picture below doesn’t raise the specter of the D-word, what will?
How will Chairman Powell speak & posture on Wednesday July 29 at the FOMC meeting & his presser? Will he again make us write our headline as “He Taketh Away” or will he come across as a builder of the much needed infrastructure of America’s economy – the Fed Balance Sheet?
What chart must Chair Powell force Wall Street to revise upward? Year-end Fed balance sheet estimates. Speaking pictorially, the Fed needs to force the triangle below upwards:
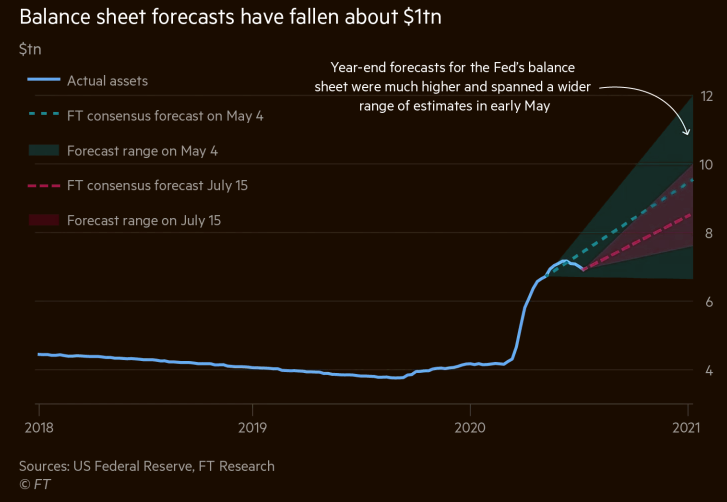
This is not for the stock market folks. It is to save the U.S. economy from the D-prospect.
Just for fun, take a look at the tweet below from the week ending May 15, 2020 just 2 months & 1 week ago:
- Macro Charts – May 12 (as we recall) – Bond Speculators have piled into the largest SHORT position in history. Similar extreme positioning led to some of the biggest Bond rallies of all time. With so much riding on recovery/reflation – if markets go back to risk-off/deflation, it could trigger a very painful unwind.
And now,
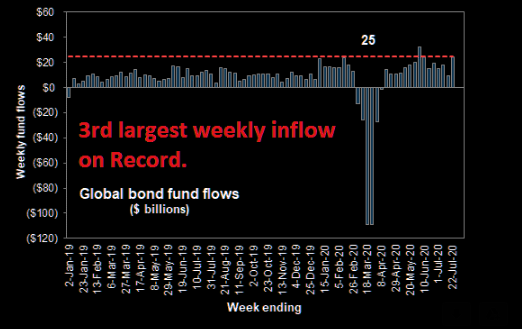
- Market Ear – Fund flows: Bonds are back again. Goldman notes, 3rd largest weekly inflow on record.
Perhaps time for Chair Powell to focus on the Treasuries “bubble” instead of the FAANG “bubble”?
2. U.S. Dollar
In another illustration of how different last 1/3rd of May was, look at the tweet below from our May 23-May 29 article:
- Richard Bernstein@RBAdvisors – Look out below! #Dollar losing its bid. Could be good for #gold and commodities and bad for financing US #deficits.
Now look at this tweet this week:
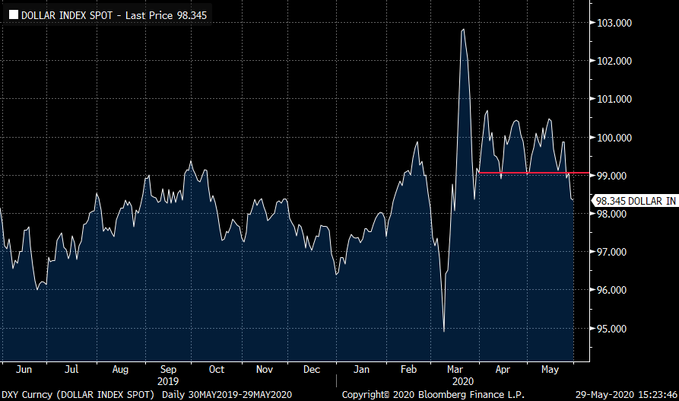
- Richard Bernstein@RBAdvisors – Is the weak #USD making the #Fed’s job tougher or is the Fed causing a weaker USD? Either way DXY < 90 could be trouble.
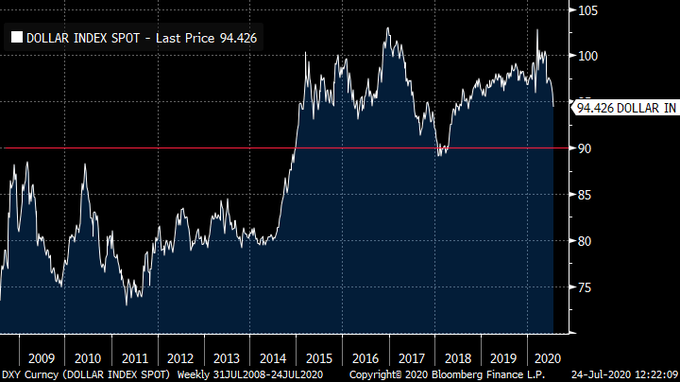
The real question is whether Chair Powell can or will signal something that can reverse this 4-month relentless fall in the Dollar.
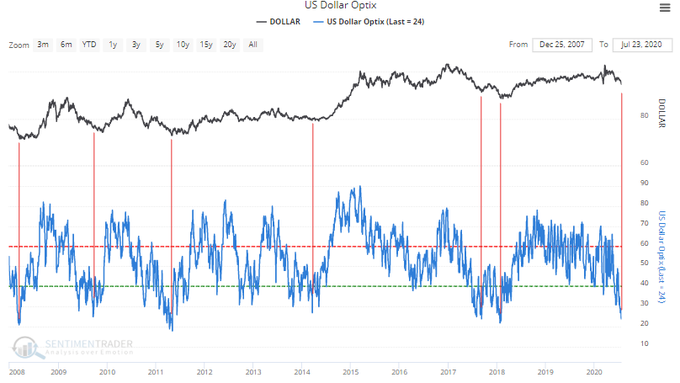
- SentimenTrader@sentimentrader – USD sentiment: Dollar Optimism Index is at the *lowest* 1% of readings over the past 10 years. Traders have rarely been this bearish on USD A rally in USD could be a major risk for stocks in the months ahead.
If the Dollar reverses its steep fall, wouldn’t that be a negative for EM besides the other negatives listed by JP Morgan in their EM downgrade this week? Key points of this downgrade, courtesy of Market Ear:
- Valuation multiple expanded already… limited risk premium.
- Risk of activity dipping lower in H2…pent up demand to slow, virus goes on, psychological factors keeping consumer/corporates cautious
- How will governments fund fiscal deficits in 2021…think corporate taxes, governments under spending etc…
- China issues – tensions with US becoming daily news….Corona attribution, lock down will reveal how dependent China and US are, de-globalization effects
3. FAM
Since this seems to a look-back week, let us go back to May 1, 2020 & our own way at looking at FAM or Fed-Amazon-Microsoft:
- “So we decided to look at ratios of market caps of big cloud stocks to the Fed’s balance sheet size – MCAP/FBS or MC/FB ratio. Actually it gets easier if we multiply the numerator by 100 to get a more intuitive MC/FB ratio. So as of Friday, May 1, 2020, the MC/FB ratio of Microsoft is 132.4T/6.7T = 20. And the MC/FB ratio of Amazon is 114T/6.7T = 17. “
- “Now go back 1-2 months when the Fed’s BS was only 4 trillion & Microsoft’s market cap was 1.1256T. So at that time, the MC/FB of Microsoft was 28. And Amazon’s MC/FB was 22. “
This showed that the rise in the Fed’s balance sheet was bigger than the rally in the market caps of Amazon & Microsoft. So our MC/FB measure made Amazon & Microsoft cheaper on May 1 than earlier.
What were the MC/FBs of Amazon when it reached its recent high near 3300 and of Microsoft at its recent high? 23.6 for Amazon & 23 for Microsoft. That’s way higher than on May 1, right? Was that excessive? Look at the 3-month charts below of AMZN & MSFT:
We know that the Fed’s balance sheet stopped growing in mid-June. But as we see Amazon & Microsoft exploded higher till the big reversal Monday in July. No wonder the MC/FBs were at their extended highs above 23. Yes, Microsoft reported excellent numbers from a fundamental perspective but they were not excellent enough to alleviate the pull down thanks to a non-expansionary Fed balance sheet.
What are they now after the steep corrections? 21.4 for Amazon and 21.7 for Microsoft. Next week Amazon reports on Thursday & Powell speaks on Wednesday.
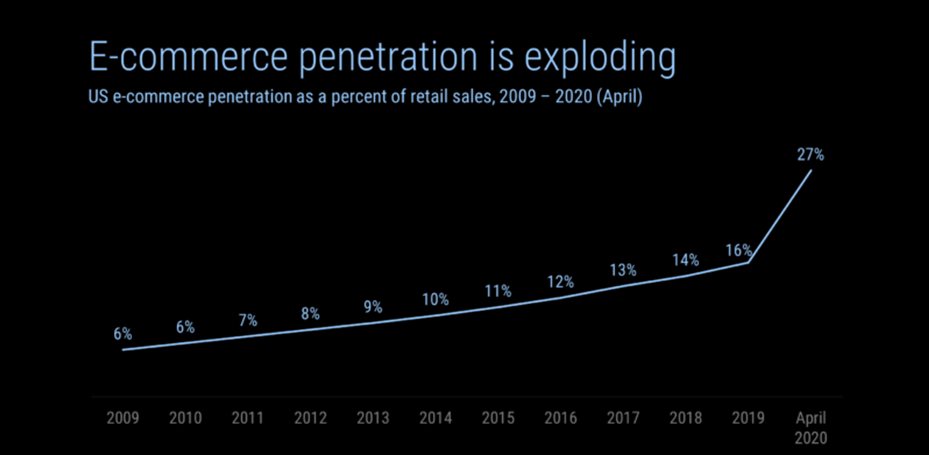
By the way, we know & keep talking about how the turn to e-commerce is exploding and that is a positive. But clearly NOT as positive as the explosion in the Fed’s balance sheet.
And to traditionalists, what is our MC/FB measure? It is our way to acknowledging the Drukenmiller dictum – “Earnings don’t move the market, its the Federal Reserve…” or liquidity moves stocks, not earnings.”
The NDX & Nasdaq were down 1.5% much harder than Dow (down 75 bps), S&P (down 28 bps) and the Russell 2000 (down 34 bps). Transports did get hammered. What happens next week? We will let Chair Powell signal that.
4. Hi Ho Silver
Silver’s action justified the “to infinity” slogan of Carter Worth from last week’s Options Action show. Gold was up 4.8% this week and GDX, GDXJ, gold miner ETFs, were up 6.5% & 7.6% resp. But the action in Silver was explosive. We prefer Gold to Silver which has always seemed nutty to us. So we were relieved to read Tom McClellan’s description:
- “Silver traders are not like other traders. They are the hot money, and they can get excited at the wrong times. When they do, it shows up as a blowoff top, like what we are seeing now. “
That may be why he titled his article as Silver Blowoff & made his case thus:
- When a high 3ROC reading appears just after an oversold bottom, it can signal the start of a strong new rebound. But when it appears in an uptrend that is already underway, as in the current instance, the meaning is different. It signals a blowoff top for silver prices.
He also addressed the explosive rise & the waterfall decline in the Gold/Silver ratio:
- Big upward spikes in this ratio tend to mark important bottoms for gold (and silver) prices. And big drops in a short period of time usually come about because of silver prices racing up faster than gold prices. Such sharp drops tend to mark important tops for both gold and silver prices.
5. Cycles
This week, Erdogan, the leader of Turkey, harked back to 1453, the year when the 21-year old Sultan Mehmet II conquered what was Constantinople & converted it to Istanbul, its name since then. According to legend, Constantinople would be doomed when Virgin Mary leaves Hagia Sophia. And both the Romans & Ottomans interpreted what they saw as a signal. Mehmet proclaimed that it was a sign from Allah & the Ottoman army took Constantinople that day.
Then Mehmet converted the great edifice into a Mosque. This week, Erdogan reconverted Hagia Sophia into a Mosque for Muslim prayers while leaving it also open as a Museum.
This decision by Turkey was absolutely political & geopolitical. It is a signal to the Turkish people that he upholds his pledge to turn Turkey into a Muslim nation. It is also a signal to Europe’s Orthodox Christians from Greece to Russia & to the Middle East that his long term goal is remake Turkey into an empire a la Ottomans. That is why he promised to send Turkish army into Libya if Egypt sent its army across the Libyan border.
Of course, Turkey is just a smaller version of the vision Xi Jin Ping has for China. Both are empire builders that are dedicated to restoring old glories of their countries. The difference is Turkey faces Greece, Iraq, Syria & Egypt as opponents while China faces USA & much of south-east Asia & now India. Witness the short excerpt of the Distrust & Verify speech of Secretary of State Pompeo at the Nixon Library & the shutting down of China’s Houston Consulate:
Getting back to Hagia Sophia, look at the cycles in history of just one monument:
Send your feedback to [email protected] Or @MacroViewpoints on Twitter