Summary – A top-down review of interesting calls and comments made last week in Treasuries, monetary policy, economics, stocks, bonds & commodities. TAC is our acronym for Tweets, Articles, & Clips – our basic inputs for this article.
Editor’s Note: In this series of articles, we include important or interesting Tweets, Articles, Video Clips with our comments. This is an article that expresses our personal opinions about comments made on Television, Tweeter, and in Print. It is NOT intended to provide any investment advice of any type whatsoever. No one should base any investing decisions or conclusions based on anything written in or inferred from this article. Macro Viewpoints & its affiliates expressly disclaim all liability in respect to actions taken based on any or all of the information in this article. Investing is a serious matter and all investment decisions should only be taken after a detailed discussion with your investment advisor and should be subject to your objectives, suitability requirements and risk tolerance.
1.The Factor?
Throughout the ups & downs during the past couple of months, one factor has seemed decisive to us – A VIX upswing that ends in a Spike. We haven’t had one in July as we pointed out last week. The VIX hit its closing low on Friday, July 2 at 15.07. Since then it has been going up in a methodical up & down fashion during July.
Then came Monday, July 19. In that cascading down day, the VIX rocketed past 25 (up 66.5% from 15.07 close on July 2) in the afternoon and then reversed to close down at 22.50. The Dow also rallied into the market close from down 920 to down 725 points.
Any one can look today at the above 5-day VIX chart and say that was a Spike! For the next four days, VIX closed down every day below the previous day’s close. So what happened to the big stock indices? We all saw the rally that stunned just about every Fin TV anchor as Dow, S&P and Nasdaq closed the week at new all-time highs.
That’s looking backwards. Was there any one who highlighted positive signs during Monday’s waterfall decline? It was Katie Stockton of Fairlead Strategies who used the E-word on Monday afternoon. She said she was seeing downside exhaustion signs; she pointed out that she wasn’t seeing “breakdowns” and also pointed out that “support levels were not being taken out“. She even called the 25 level as a VIX Spike. Kudos to Ms. Stockton. Best to listen to her directly in a highly abridged clip of her comments:
We thought this was a very timely & important clip that called on Monday afternoon what followed from Tuesday to Friday. But the CNBC Closing Bell Anchors apparently did not care or did not even notice. Because neither of them referred to this clip during the rally that followed from Tuesday to Friday.
On Tuesday, we saw:
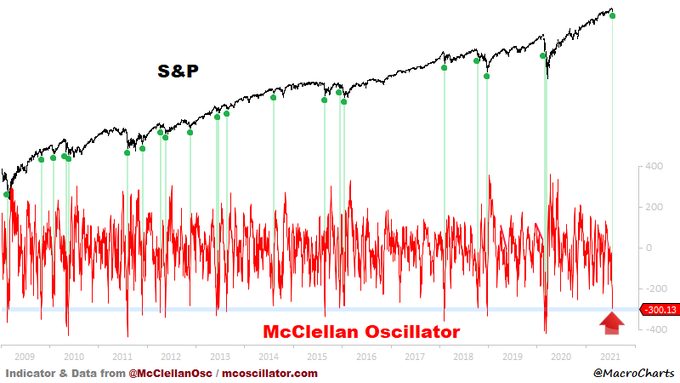
- Macro Charts@MacroCharts – Jul 20 – Stocks are extremely oversold. McClellan Oscillator hit bottom 1% of all days since 2009. The spike is from massive capitulation selling in Cyclical & Reopening Stocks. A potential significant contrarian Buy opportunity setting up for Cyclicals soon – watch closely for basing.
On Tuesday evening we saw:
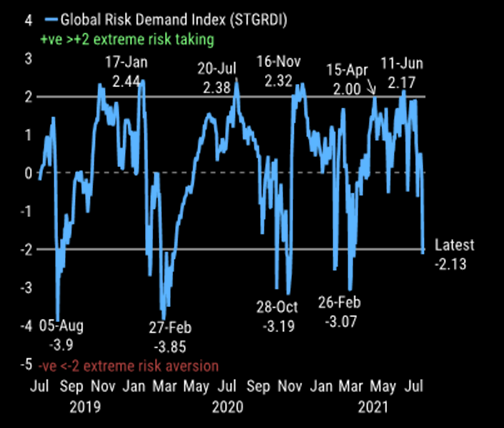
- The Market Ear – Alert! This risk indicator starts to scream buy – MS Global Risk Demand Index was pushed into extreme negative risk territory by volatility indicators. STGRDI reached -2.1 yesterday but research has found the indicator bottoms when reaching below -3 in the past year. Global Risk Demand Index (STGRDI) at -2.13, close to extreme negative risk territory, recently peaking on 2nd July
Then Cramer shared views of Carolyn Boroden, his technician colleague, on Wednesday’s Mad Money show beginning with the 3-day decline pattern she highlighted:
- “Very often this year, the S&P will pull back pretty hard, but it only lasts for three trading days from the last new high,” he said. “Boroden’s pretty confident this pattern has already repeated itself.”
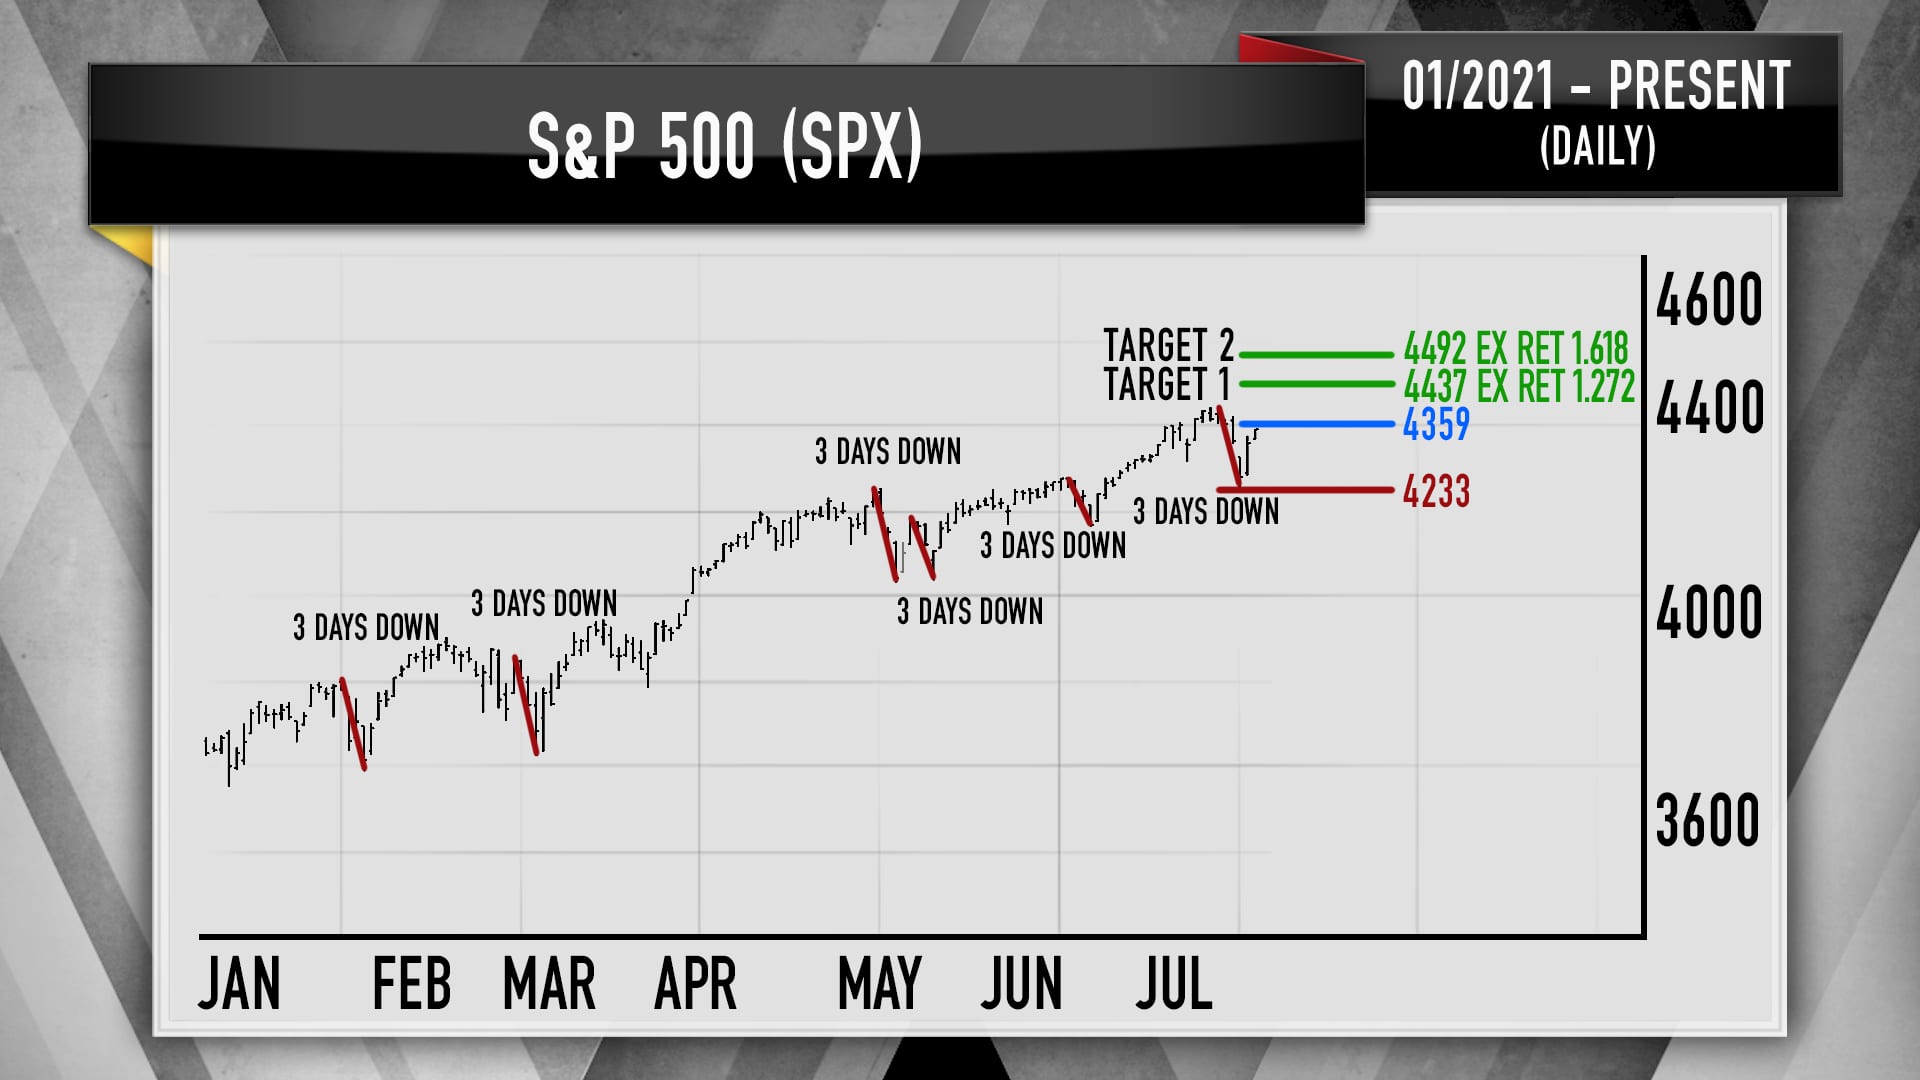
- “If we’d been down yesterday, that would’ve been another story, but we came roaring back. To her, that means the meltdown is probably over,” he said.
- Boroden, who also contributes alongside Cramer at RealMoney.com, is keeping an eye on 4,359 in the S&P 500. Should the index break through that ceiling of resistance, her next targets are 4,437 and 4,492, Cramer said.
The S&P broke through Ms. Boroden’s resistance of 4359 to close the week at 4412. And 4437 is only 25 handles away.
But what about Tom McClellan who had highlighted last week’s action of “higher VIX with higher stock prices” as a “warning of trouble”? Read what he wrote in his article on this Thursday titled Big Weekly Drop In Investors Intelligence Data. The entire article is an excellent read, But its central message seems to be as follows:
- “That took the Bull-Bear Spread in this week’s chart from 45.9 to 36.4, a drop of 9.5 percentage points. It is a pretty big one-week drop, and it took the Bull-Bear Spread down from above the upper 50-1 Bollinger Band to below the lower one, all in just one weekly change.”
- “Big weekly changes in these sentiment survey numbers contain important information. The 9.5 percentage point drop in the Bull-Bear Spread is one of the larger weekly changes. Here is what those weekly changes look like:”
OK, but what does this mean to investors? Mr. McClellan explains:
- “Most of the time when there is a one-week drop of greater than about 7 percentage points, it is a pretty good marker of a meaningful price bottom.”
What sort of time would not “fit” into his “most of the time” category? Another Covid Crash, he states. What if this is a more typical non-Covid case?
- “But if it is showing us a more typical situation, then we have just seen a nice scary selloff that worked to do the job of frightening investors away.”
Okay but is there any signal that is longer term, a signal that hopefully has never failed? One such was succinctly highlighted on Thursday, July 22:
- SentimenTrader@sentimentrader – Jul 22 – A Buy Signal That Has Never Failed
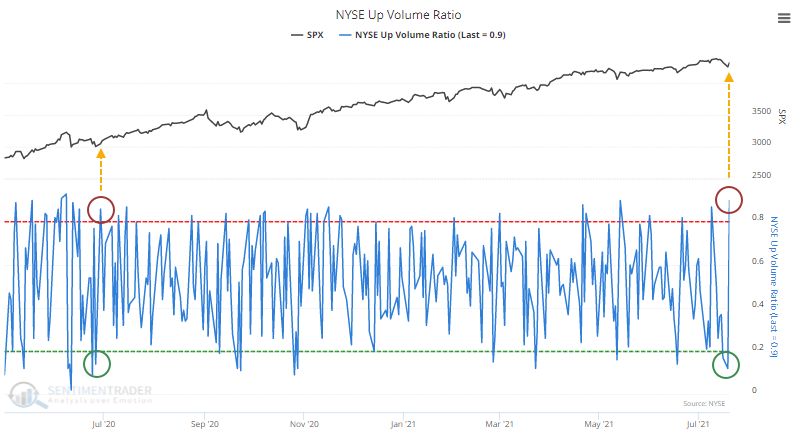
In that article with the title A Buy Signal That Has Never Failed, Sentiment Trader writes:
- The buying stampede on Tuesday was remarkable, and it more than reversed the selling pressure from the day before.
- The Up Volume Ratio cycled from below 15% to above 85% in back-to-back sessions on the NYSE.
- This triggered last June, and it marked the end of that little pullback, kicking off an impressive run over the next few months. That was much more the rule than the exception after a back-to-back reversal in Up Volume while the S&P 500 was within 10% of a 52-week high.
- Since 1962, the S&P 500 never showed a loss in the month following similar signals. These mostly occurred during momentum markets, and buyers followed through to avoid missing out on the next bull run. A few of them did end up leading to blow-off peaks, but not until month(s) later.
Does that mean August would be an up month? We will find out.
This has already been a terrific week with the S&P up 4% from Monday’s low. The Dow was up 1.1% on the week, S&P up 2% & NDX up 2.9%. Russell 2000 was up 2.2%. Material stocks rallied with CLF up 7.8% on the week and FCX up 6.4%. FAAMG did well too with the star being FB up 8.5% on the week.
Next week beings FAAMG earnings and the FOMC on Wednesday, July 28.
2. Treasuries, the Fed & Bonds
Besides stormy weather & heavy rainfalls around the world, we have seen stormy & volatile conditions in both stock & bond markets. Some on CNBC Fast Money expressed alarm about the volatility of the 10-year yield and opined how that meant something is wrong with what the Fed is doing. Only Steve Grasso was smart & brave enough to stand up and say it was about positioning. Not only was Mr. Grasso right but it was a special type of positioning that has been seen in the leveraged bond market for decades.
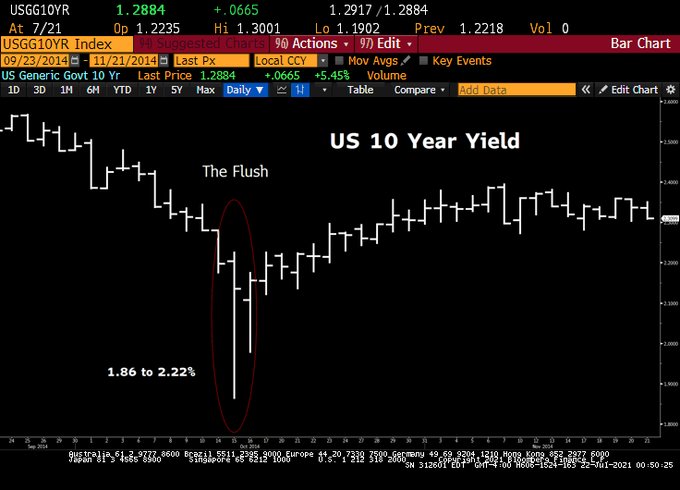
- Lawrence McDonald@Convertbond – – Similar to the October 2014 “Flush” – the Street was widely positioned (short bonds) for liftoff, “escape velocity” – one large fund got carted out. Good guy, brilliant CIO who is right a lot, not on this day. The infamous, tap on the shoulder, been there. #Bonds
Not to worry, though. The biggest fundamental remains constant.
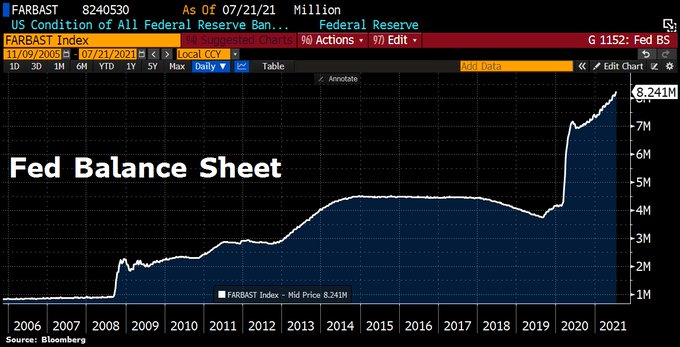
- Holger Zschaepitz@Schuldensuehner – #Fed balance sheet has hit another ATH as Powell keeps the printing press rumbling despite spiralling inflation. Total assets rose by another $39bn to $8,240.5bn, equal to 37% of US’s GDP.
One direct result of falling yields is:
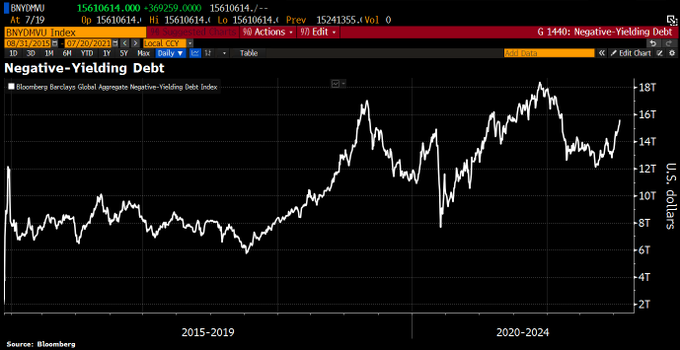
- Holger Zschaepitz@Schuldensuehner – Jul 20 – The total market value of global negative-yielding debt rose by $3.2tn from a recent low in May to $15.6tn due to growth fears.
But you can still find positive-yielding debt at a large spread to Treasuries and one that has done very well this year. Below is one specific example of this category:
This Pimco NY Municipal closed-end bond fund is up 11.5% in 2021. It’s annual dividend yield was around 4.25% at the beginning of this year. So you need to add 2.12% to the above price return. But this 2.12% is triple tax exempt and so is equivalent to nearly 4% taxable dividend making it’s total return in 2021 close to 15%. Not that far from S&P’s ytd return, is it?
Interestingly, David Rosenberg spoke to CNBC’s Kelly Evans this week in a “rosy” manner about municipal bonds. He also said, in response to a question, that “I am actually quite bullish on the Treasury market right now“.
3. Energy Stocks
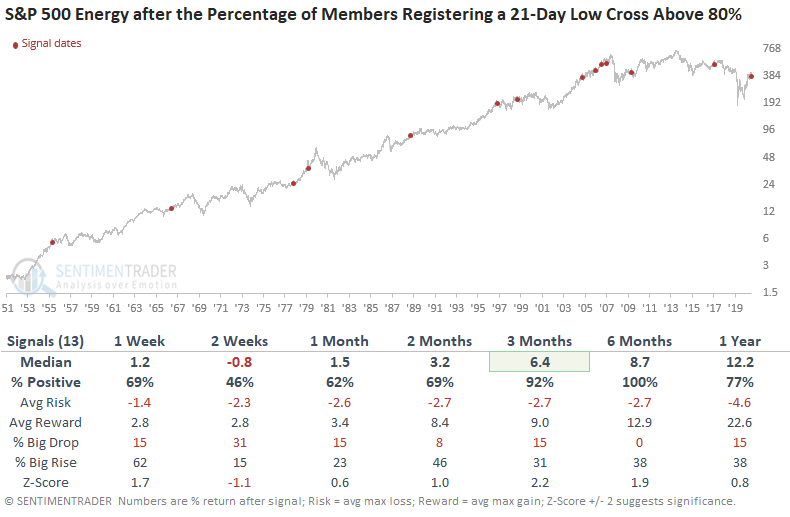
The energy sector closed conspicuously down this week, despite Oil ETFs, USO & BNO, closing up on the week. But energy stocks have rebounded “every time” when “they did this“, according to:
- SentimenTrader@sentimentrader – Jul 19 – When Energy Stocks Did This, They Rebounded Every Time https://www.sentimentrader.com//blog/when-energy-stocks-did-this-they-rebounded-every-time/
The article points out:
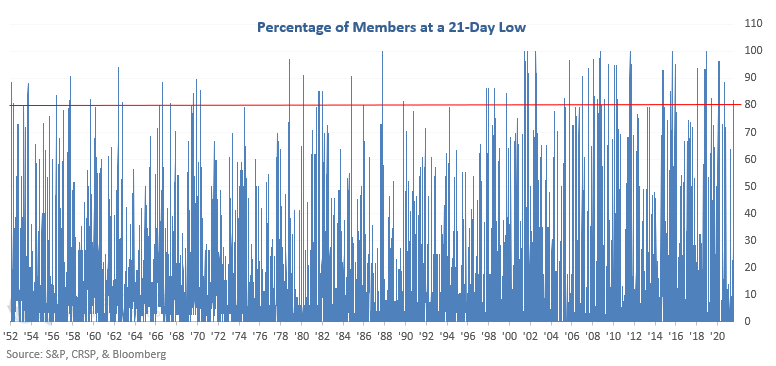
- “So, Dean looked at future returns in the S&P 500 Energy sector after a surge in those stocks falling to 1-month lows, but only when it triggered within about a month of the sector being at a 1-year high.”
Chris Verone of Strategas came on CNBC Fast Money to recommend buying energy stocks on Thursday, July 22. He argued that this week saw both an “internal flush” and an “external flush” in energy stocks and 90% of stocks in XLE are still above their 200-day moving averages.
You can talk about big cap energy stocks during the day hours on CNBC as Chris Verone did above. But apparently not smaller-cap energy type stocks of another kind, like Cameco (CCJ) & Energy Fuels (UUUU). Is that why the clip below had to be aired in pre-dawn darkness?
Remember the “speed kills” comment of John Madden! In the last 30 seconds of the above Friday morning clip, Jon Najarian explained the fear on Monday by saying – “It’s all about speed; ….. we can take slower, we can’t take faster“. And what do you get at the peak speed of the decline? A VIX Spike!
Send your feedback to [email protected] Or @MacroViewpoints on Twitter