Summary – A top-down review of interesting calls and comments made last week in Treasuries, monetary policy, economics, stocks, bonds & commodities. TAC is our acronym for Tweets, Articles, & Clips – our basic inputs for this article.
Editor’s Note: In this series of articles, we include important or interesting Tweets, Articles, Video Clips with our comments. This is an article that expresses our personal opinions about comments made on Television, Tweeter, and in Print. It is NOT intended to provide any investment advice of any type whatsoever. No one should base any investing decisions or conclusions based on anything written in or inferred from this article. Macro Viewpoints & its affiliates expressly disclaim all liability in respect to actions taken based on any or all of the information in this article. Investing is a serious matter and all investment decisions should only be taken after a detailed discussion with your investment advisor and should be subject to your objectives, suitability requirements and risk tolerance.
A nouveau Rip Van Winkle with a month & half long sleep would have woken up on Saturday & said “same old, same old“. After all, the week as a whole closed on a 2021-like good & up note.
The Dow was up 1.1%, the S&P was up 1.5%, the Nasdaq was up 2.4%, NDX was up 1.7%, Russell 2000 was up 1.7% and Transports were up 1.1%. Even IWC, the microcaps ETF, was up and not only up but the best performer of the week with a 2.2% rally. Like microcaps, not only were Emerging Markets were up but the 2.9% EEM rally beat all domestic indices. The 1.9% fall in the U.S. Dollar certainly helped.
Naturally commodity stocks were up with GDX up 3.4%, XLE up 4.3%, FCX up 6.7% and MOS up 9.8%. Financials had a terrific week as well with both GS & BAC up 5%+. And our favorite MANAA group was up big time – Alphabet up 7.3%, Netflix up 6.5%, Apple up 1.1%, Amazon up 9.2%. Unfortunately Microsoft closed the week down 1%.
Of course, TLT & EDF were down 2.4% & 3.4% respectively with Treasury rates rising double-digits across the yield curve. But that in itself confirms the patriotic conviction about the Stock market & the U.S. economy, right?
So why don’t we end this article here with the alli-croc* wave? Because we should talk about the two big shocks that hit the markets this week, at least one of which might have intermediate term impact.
*”see you alligator, another time crocodile” is the more commonly used expression for what we call “alli-croc”.
1. Credit – European & US
We have a simple way to measure whether financial conditions are expanding or contracting in credit markets. We compare the performance of leverage credit closed-end funds to unleveraged credit ETFs, say DPG to HYG. When financial conditions expand, the leveraged DPG outperforms the unleveraged HYG and vice versa. Not a proven, algorithmic model to build strategies around it, but our simple concept works to highlight a change in liquidity.
Look at the 10-day chart of DPG vs HYG:
Remember the Powell tantrum of Wednesday, January 26. You can see above the vertically down move in DPG relative to HYG during & post Powell presser. As we pointed out last week, effects of that tantrum did not last beyond that Wednesday. Treasury rates fell hard on Thursday January 27, the day after the Powell presser. AND you see above how DPG (in yellow) shot up relative to HYG on Thursday morning.
Notice the DPG outperformance widened on Friday, January 28 and accelerated into the close of Wednesday, February 2. So things were swell in both credit & stock markets from Monday to Wednesday. In fact, when asked “how is credit?” on Wednesday morning, BTV’s Lisa Abramowicz said “its all good“.
Then came Thursday morning and the stunning hawkish pivot by the ECB. Look at how both DPG & HYG fell on Thursday with DPG falling harder. That accelerated on Friday after the way stronger than expected BFP report of 467K jobs.
German Bund rates exploded higher with the 2-year bund yield up 35 bps on the week, the G-10 yield yo 25 bps and the G30 yield up 12 bps on the week. Much worse is the stress in European credit:
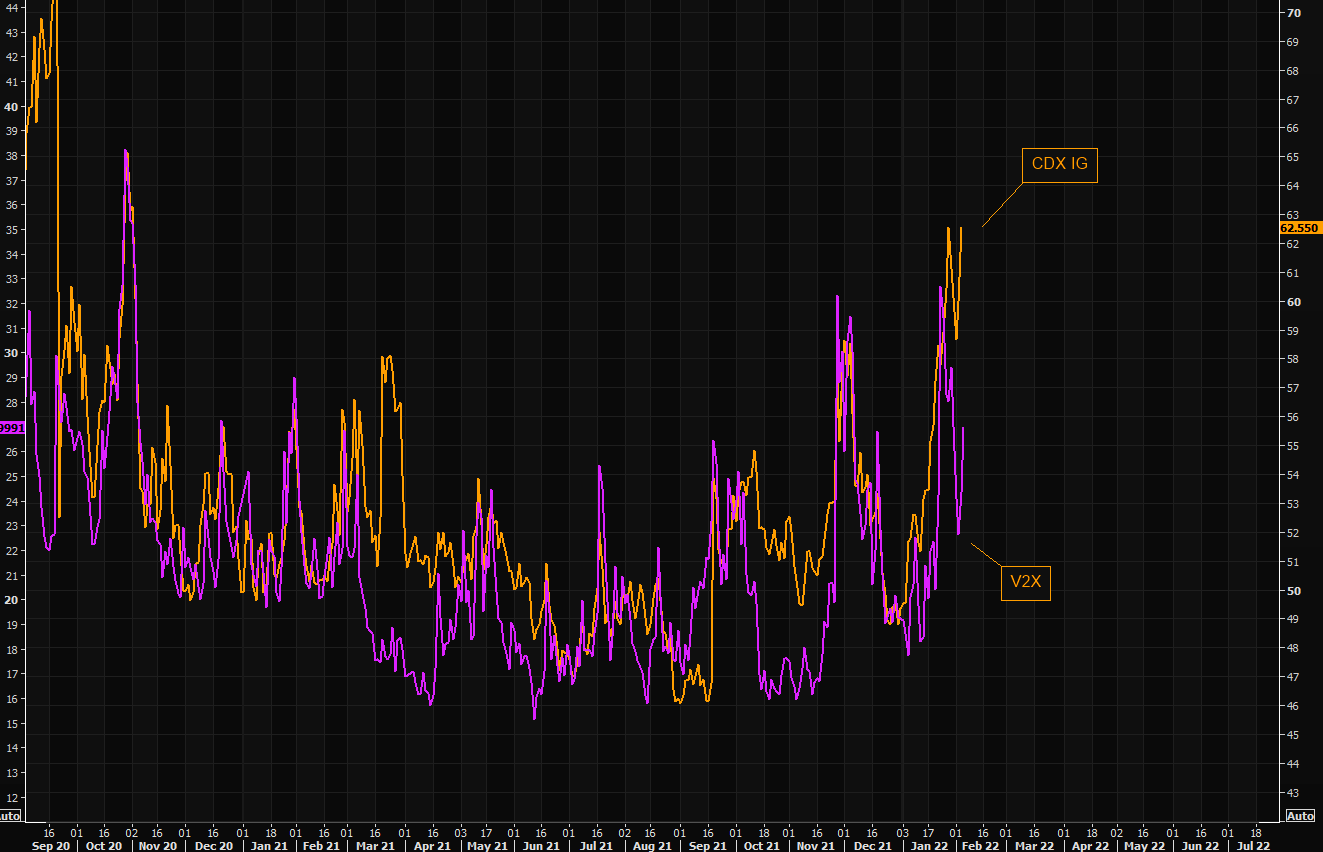
- Via The Market Ear – “Real” European stress exploding higher – Most equity “people” pay little attention to credit protection. The recent explosion in European credit protection, iTraxx main, is huge and something to watch carefully. It is “outperforming” the V2X by miles. They have different features to them when it comes to pricing risk, but when iTraxx moves like this you need to pay close attention.
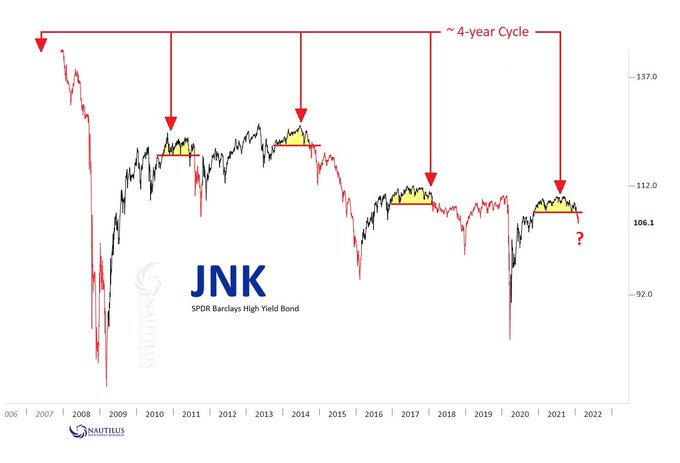
The U.S. credit ETFs, HYG & JNK, fell 1% each on the week. Smart managers picked up on this quickly and Karen Finerman of CNBC FM gave “short HYG” as her final trade on Thursday evening. Some technicians are pointing to potentially steep declines in credit ETFs:
- Nautilus Research@NautilusCap – – $JNK Updated. 4-year peak cycle
Treasury rates exploded higher after the big surprise from the Payroll report. Many, including CNBC’s Steve Liesman, pointed to some weaknesses in that report but the Treasury market couldn’t care less. Rates in the 1-yr-5yr curve rose by 11-12 bps on Friday while the 10-7 curve rose by 9-10 bps. The 30-5, 30-3 & 30-2 curves flattened by 5 bps. And the 30-20 yr curve inverted a bit more and the spread between the 10-yr & 7-yr flattened to less than 3 bps.
For most of the past decade, the low & negative rates in Europe exerted a downward pressure on US Treasury rates. That may be over. If European rates go up then that will exert an upward pressure on US rated and credit conditions in both Europe & US will tighten.
Fortunately, assuming past is prologue, the weakening in credit should take a couple of months to start impacting equities negatively. Our recollection is that it took until July 2007 for stocks to be negatively impacted by weakness in credit that began in late February 2007 & accelerated with a big rise in Treasury rates in April-May 2007.
So far, the rise in US Treasury rates was mitigated by the emerging downtick in US growth & steadily weakening economic data. That might change going forward if the ECB is really determined to raise rates. Because the upward pressure on US rates from European rates going up might prove greater than any downward pressure from weakening economic data in USA.
2. Big shock but over already?
The big shock in equities was the disastrous earnings report & guidance from FB. Remember this was the stock that the smart & patient hedgies were recommending, people like Dan Niles & Karen Finerman. They were extolling the virtue of the relatively low price-earnings multiple of FB.
That, in itself, should have been a warning. Because the old adage says that the really dangerous period in a high-growth stock comes when its PE ratio comes down to a reasonable valuation level.
FB was such a safe tech-social media stock that almost every one owned it in size. So its huge fall blew up portfolios across the investing landscape. That destruction forced a massive sell-off in stocks scheduled to report earnings on Thursday after the close. Just look at the 5-day VIX chart below:
The above shows the impact of the FB stunner. The strong report from Amazon helped on Friday but it was not enough to get back to the pre-FB level. Friday morning was a bad one too but when the VIX began falling around 11:15 am, the stock market stabilized and FB rallied hard from just above 230 to above 242 around 2 pm.
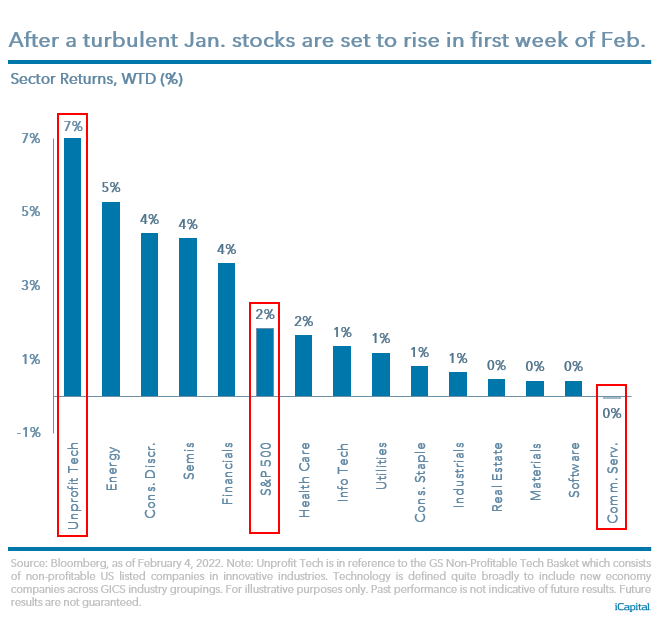
The big rise in Treasury rates had no impact on stocks on Friday. In fact, the smaller & mostly unprofitable tech stocks had a stellar day on Friday – ROKU up 9.2%, SPOT up 9.2%, AFRM up 9.1%, HOOD up 7.3% and so on. This was true for the entire week:
- Anastasia Amoroso@AAmoroso_1 – – Another week of volatility, setbacks and comebacks. But SPX is on track to finish this week +2% higher. Note the big divergence – unprofitable tech +7% for the week while communication services sector is near 0%.
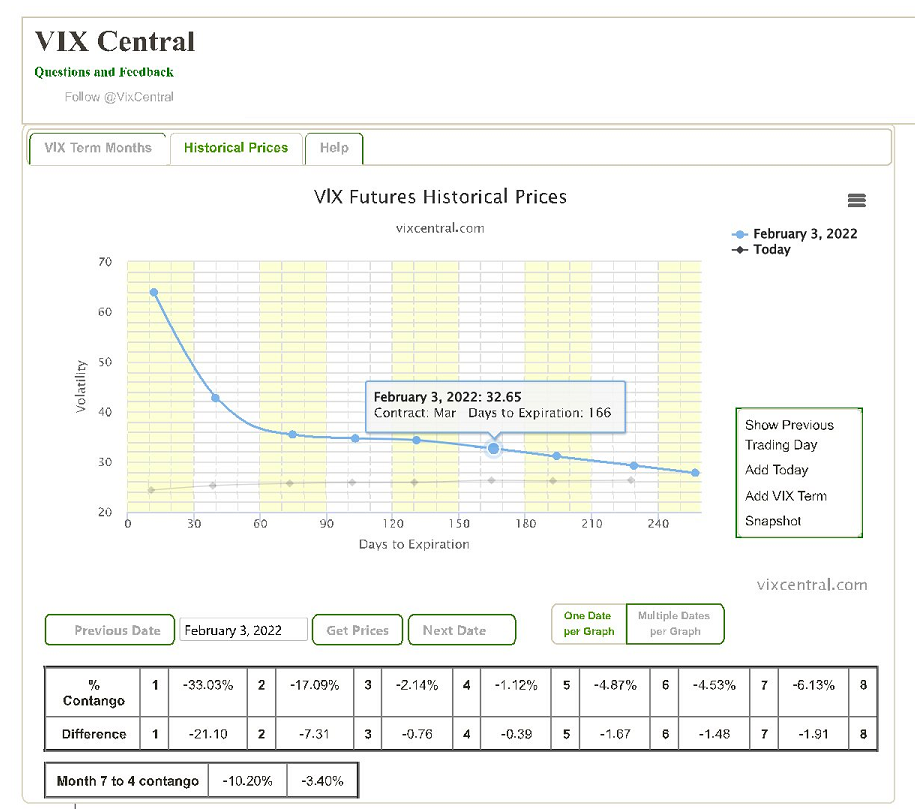
Nothing lasts forever but this week again demonstrated that VIX is the numero uno factor in daily & weekly action. Look at the change in the VIX term structure from Thursday February 3 to Friday February 4 & you will see what happened in the stock market from Thursday to Friday.
3. Oil
Remember when the price of oil went negative because there was no place to store oil. Today we seem to have the reverse situation of nearly empty storage facilities that are virtually begging for oil.
- Jesse Felder@jessefelder – – ‘Right now, the Cushing market is flashing red — as in red hot as prices surge. Inventories are dropping in the Oklahoma town as global demand outpaces supply. The buzzword in the market now is “tank bottoms.“‘ https://www.bloomberg.com/opinion/articles/2022-02-03/oil-prices-are-going-to-spike-judging-from-the-tank-farms-of-cushing-oklahoma
The earlier condition was an extreme & a fantastic buying opportunity in oil. Is today’s reverse situation a selling opportunity? That is what Tom McClellan suggested in his article Oil/Gold Ratio:
- “The latest up move in oil prices to above $90/barrel has this ratio appearing to break out above the upper boundary of that downtrend channel, perhaps marking a new trend getting itself going. Or perhaps it is a false breakout that will fail and push this ratio back down into the downtrend channel for a while longer.”
- The run higher in oil prices may only have a little bit longer to run, though. Gold prices lead oil prices by just about 20 months, and so the August 6, 2020 gold prices top is foretelling an oil price top in late March 2022,
Carter Worth, resident technician at CNBC Options Action, also suggested selling or even shorting WTI Crude Oil as well as trimming energy equities:
Send your feedback to [email protected] Or @MacroViewpoints on Twitter