Summary – A top-down review of interesting calls and comments made last week in Treasuries, monetary policy, economics, stocks, bonds & commodities. TAC is our acronym for Tweets, Articles, & Clips – our basic inputs for this article.
Editor’s Note: In this series of articles, we include important or interesting Tweets, Articles, Video Clips with our comments. This is an article that expresses our personal opinions about comments made on Television, Tweeter, and in Print. It is NOT intended to provide any investment advice of any type whatsoever. No one should base any investing decisions or conclusions based on anything written in or inferred from this article. Macro Viewpoints & its affiliates expressly disclaim all liability in respect to actions taken based on any or all of the information in this article. Investing is a serious matter and all investment decisions should only be taken after a detailed discussion with your investment advisor and should be subject to your objectives, suitability requirements and risk tolerance.
1.Inferno! “recognition & rejection of sin … to journey towards God”
Thursday was really really bad thanks to the ECB living up to Europe’s history of plunging the world into a mess. Then came Friday morning with the twin shocks of CPI & UMich Sentiment & hell broke loose. The last two days reminded us of Dante’s Inferno with the destruction of wealth & confidence we saw.

Remember that Dante’s epic poem “Divine Comedy” represents “journey of the soul toward God, with the Inferno describing the recognition and rejection of sin“. Replacing God with monetary morality & prudence, replacing Dante’s sin with the unnecessary & reckless pumping of liquidity, you could perhaps use Dante to describe what happened last two days as an inferno!
If you think what we wrote above is bilge & nonsense, then you are like us. Because we have been revolted by the moral-sounding sagacity displayed on Fin TV by elite talkers who have never succeeded at money management. Ergo, we thought we would go a step beyond them by quoting Dante.
First & foremost, we are even more firmly convinced about the destructive moronity of Europe. Not being content with destructive foreign policy moves about Ukraine-Russia war, the ECB is now taking pride in their plans to raise rates by 50 bps twice in the next few months. ECB was the principal reason for Thursday’s carnage despite the success of the 30-year Treasury auction at 1 pm Thursday.
Then came Friday’s shocking CPI print, the adjective being a synonym of what we heard on Fin TV. But the shock might be to those who refused to get into the components of inflation details:
- David Rosenberg@EconguyRosie – – Some nifty math. When you strip out of the CPI all the items that are linked to energy (air fares, moving/freight, rental cars, delivery services, new and used vehicles), the core was +0.36% and the YoY steadied near 4%. The truth beneath the veneer. #RosenbergResearch
Actually the statistic causing the “sin” analogy is not inflation; it is the L-word:
- Eric Basmajian@EPBResearch – – Historically, real M2 increased at a 3%-4% annualized rate. The COVID liquidity injection pushed real M2 more than 20% above trend. To get back to trend, the Fed either has to hold real M2 growth flat until 2025 or sharply contract liquidity over the next 12-18 months.
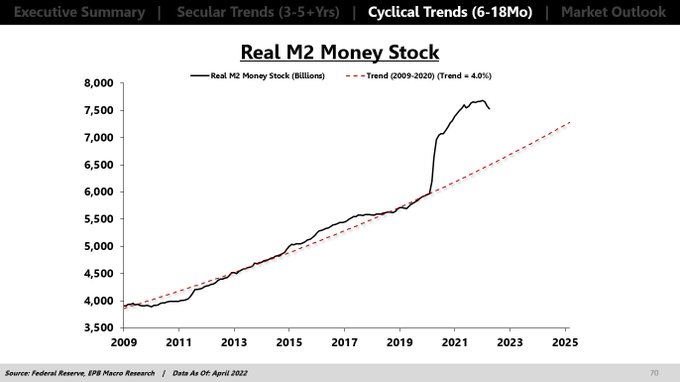
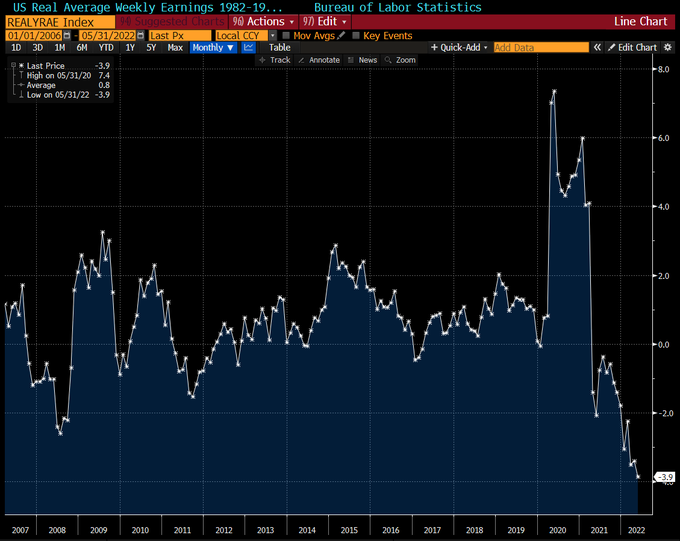
Our own view is that the Fed should just hold Real M2 growth flat into 2025. That is sort of what the Fed did after the end of WWII. After all, the Fed is not an agent from God. Their mandate is given to them by the American People. And look what this insane “inflation focus” based curbing of liquidity is doing to the American people:
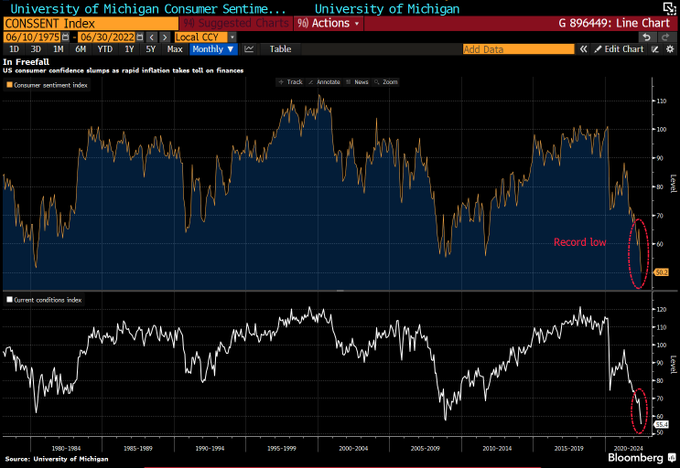
Guess how American consumers are feeling about this double pincer?
- Lisa Abramowicz@lisaabramowicz1 – – Record-low consumer sentiment: bloomberg.com/news/articles/
But some point to light at the end of the tunnel via their vision of a final ditch to cross before reaching the promised land:
- Richard Bernstein@RBAdvisors – – 3 Phases of inflation #forecasts: 1) it’s temporary 2) it’s peaking and 3) it’ll never end. Maybe with today’s new record #inflation reading we’ll start moving from Stage 2 to Stage 3?
In other words, hope has to be shed & gloom has to pervade before we can start to see the end. Bernstein is not talking about ordinary folks who already are in financial misery. He is talking about the elite FinTV stalwarts who are now flooding the screens with moronic ideas. When they come on & start saying it is too late, that may be the first hopeful sign.
In other words, look for (our symbol for American Brahminism) Andrew Ross Sorkin of CNBC Squawk Box-NYTimes beginning to talk in a different & all-hope-gone tone & Becky Quick challenging him instead of backing him.
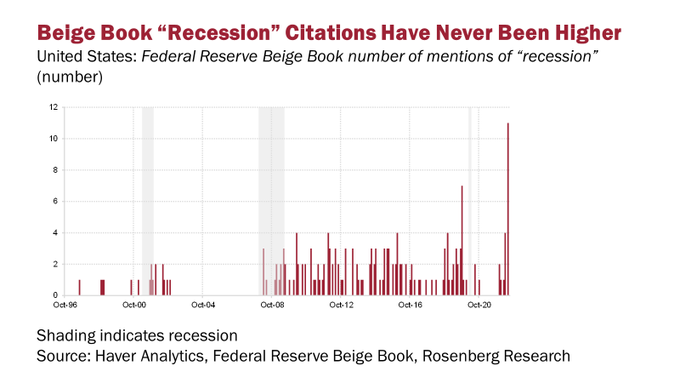
In the mean time, what are the regional Fed centers talking about the most?
- David Rosenberg@EconguyRosie – – We went back to all the prior Beige Book citations of “recession” to the mid-90s. Not once have we ever seen a number as high as 11 as we just did. Most of the time, the worst we ever saw was 4! Pack this in your back pocket — I’m sensing that Jamie Dimon already has!
Guess these regional Fed centers are also “fly-over” entities at least to Columbia-Harvard-Princeton educated elite monetary “Brahmins”!
2. Bonds Lead Stocks?
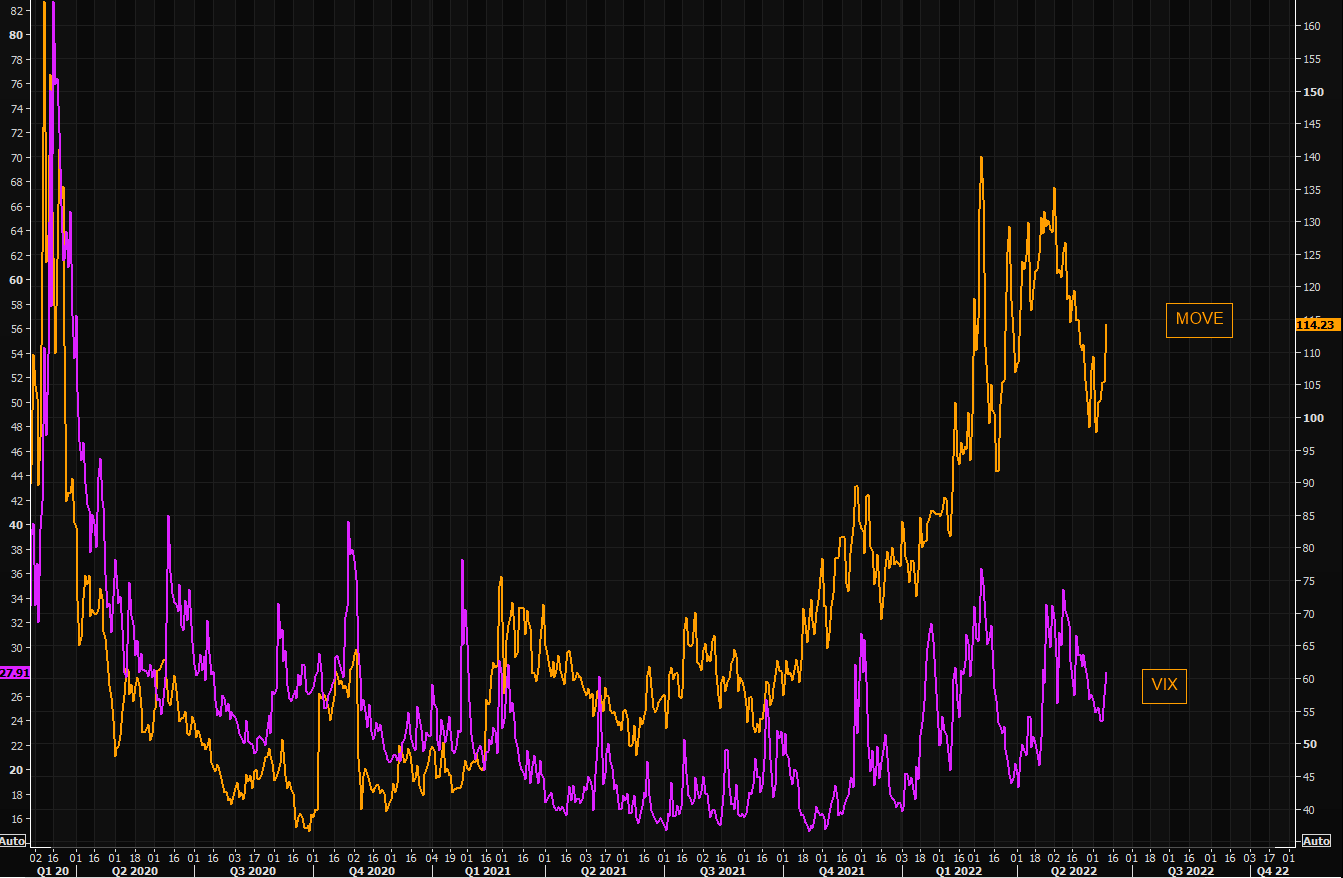
Wasn’t it merely a couple of weeks ago when we showed how Bond liquidity had fallen? Today is starkly different. As The Market Ear showed on Friday evening that “Bond volatility, MOVE index, is surging and VIX needs to catch up some. The gap remains huge..”
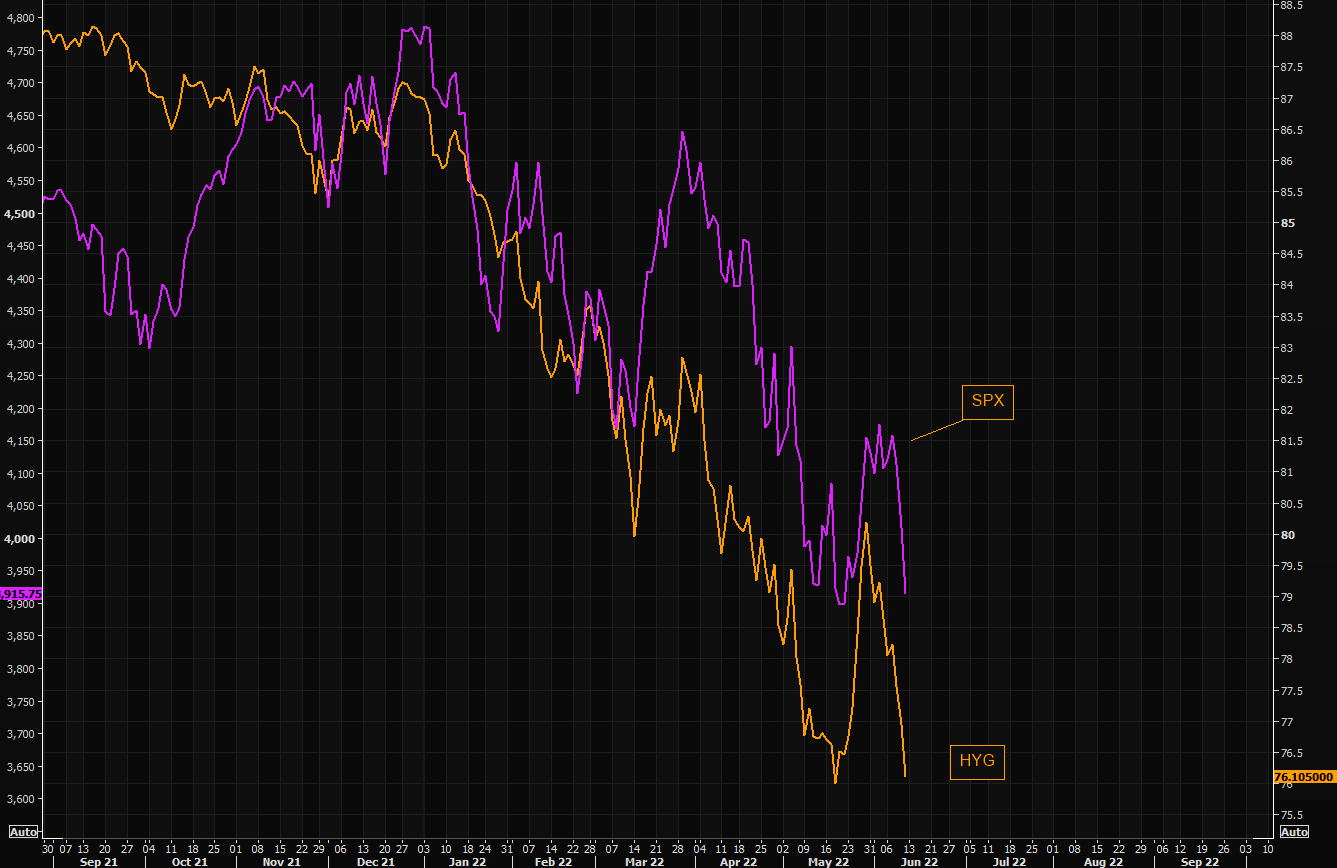
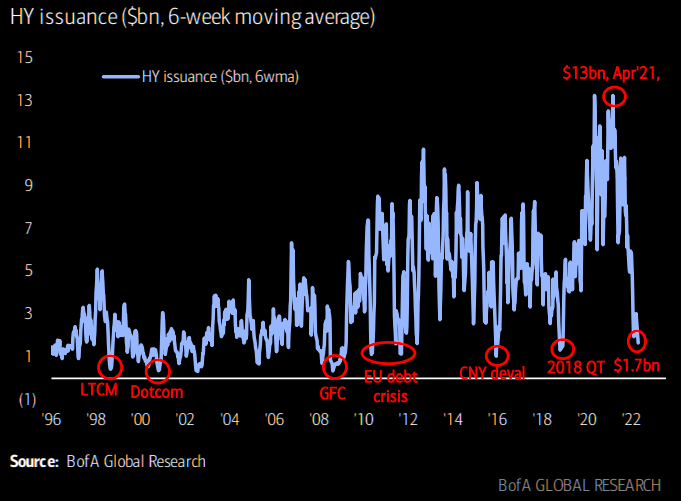
What about the rally in credit ETFs? The Market Ear tells us “The roundtrip in HYG is now gone…HYG remains a vulnerable space and SPX is looking closely. Second chart shows high yield issuance.”
Look what happened to Treasury rates this past week:
- 1-yr yield up 37 bps; 2-yr yield up 40 bps; 3-yr up 38 bps; 5-yr up 32 bps; 7-yr up 26 bps; 10-yr up 22 bps; 20-yr up 14 bps; 30-yr up 11 bps;
How did the Treasury Bond ETFs perform, both standalone & in comparison to credit ETFs?
- TLT down 1.9%; EDV down 2.2%; while HYG down 4% & JNK down 4%.
What will the ECB do in the next few months, you ask? TS Lombard calls it the “summer of revenge” and write via The Market Ear
- ECB will accelerate hikes over summer: 25bps in July, 50bps in September
- Downside EA growth surprises to hit in H2, but dovish turn not in sight yet
- ECB is not yet there to close peripheral spreads: they need to blow out first
“On the blow out of spreads the investment bank writes: “However, the problem with this cunning plan is that without a spread blowout, it will remain hard to legally justify ECB spread control as it would appear indistinguishable from deficit financing.””
So under the guise of raising rates & curtailing liquidity, the ECB plan will actually act as “deficit financing”? Naturally the Euro fell vs. the Dollar despite this “revenge” plan?
Actually it was a sort of “revenge” against America & American consumers. Because it was the ECB talk & plan that catapulted U.S. Treasury rates higher.
3. Liquidity
Eric Basmajian discussed above the concept of liquidity as it affects Real M2. What about a liquidity indicator that affects stocks?
For an excellent discussion, we urge all to read Tom McClellan’s article on June 10 titled Anemic High-Yield Bond A-D Line. A few excerpts are below:
- After making an oversold low on May 19, the SP500 had a pretty impressive rebound effort, which included 3 really strong breadth days on May 25-27, 2022. That got a lot of analysts talking about a “breadth thrust” signal of various flavors.
- Breadth might have been really good looking for the NYSE stocks in late May, but it was pretty anemic looking for the stock market’s fellow travelers, the high yield corporate bonds … they tend to be terribly sensitive to liquidity, both good and bad,…. tell us when the conditions are great for stocks, and more importantly they tell us when liquidity is in short supply.
- Looking at this A-D Line longer term, we can see that it has shown us divergent top indications at all of the major tops where we would want to have that message.
- It also told us about the big liquidity problems we are now facing, when it made a divergent top versus stock prices in late 2021. We have seen in 2022 what those liquidity problems have meant for the stock market, and thus far this A-D Line is not showing us an “all-clear” signal. There is more work yet for the market to do, to dismantle the excesses built up during QE4.
4. U.S. Stocks
Being simple & thinking simplistically, we hardly ever have the opportunity to feel smart. This week is no exception despite one wish of ours from last week coming true:
- June 5 article – “We are actually happy that Microsoft, Apple & other equity duration stalwarts are now facing earnings downshift fears. Those who are bullish on stocks should actually pray for a violently down week & half into the June 15 FOMC meeting.”
That’s us. Only negative prayers of ours get answered. But that is why they invented drinking on Friday evening.
- Dow down 4.6%; S&P down 5.1%; NDX down 5.7%; RUT down 4.4%; Dow Transports down 7.4%; Goldman down 9.7%; Bank of America down 8.2%; VIX up 12%;
MMANAA stocks were clobbered:
- Microsoft down 6.1%; Meta down 7.8%; Apple down 5.4%; Netflix down 7.9%; Amazon down 10.4%; Alphabet down 2.9%;
Even the darlings in the commodity sector got brutalized:
- Copper down 4%; CLF down 14%; MOS down 11%; FCX down 2.7%; Oil up 11 bps; Brent up 44 bps; Nat Gas up 2.7%; OIH down 5.3%; XLE down 92 bps;
How did investors treat German stocks & other international stocks in this summer of “ECB revenge”?
- EWG (Germany) down 9.3%; EWZ (Brazil) down 12.9%; WEY (South Korea) down 5.8%; Indian ETFs down 4% on average;
One big exception:
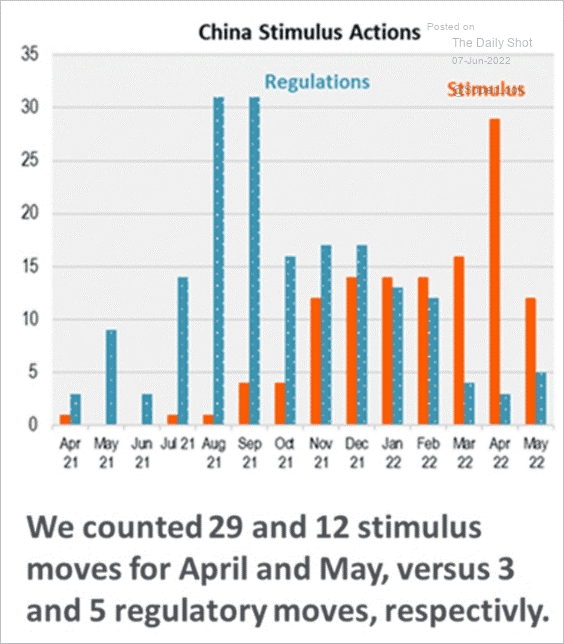
And what does stimulus mean for stocks, for Chinese ETFs in this case? – ASHR up 14%; FXI up 3.1%; KWEB up 7.9%.
This week was so bad that anyone who came on Fin TV to articulate their views about stocks proved very wrong by Friday’s close. So the ONLY clip we feature in this article is the Friday after-the-close clip of Mark Newton on CNBC:
- “… 3810 is a key level for the S&P & 280 for QQQ right around their May lows” will they hold? … Newton’s answer – I do think there is an above-average chance that these can hold for a couple of different reasons – one is that this entire sell off in last two days has been driven by the Dollar & yields moving back up … both of these are near critical resistance levels .. actually I think they can hold into the Fed meeting … my own cycles of Elliott projections show that yields should start to back off in the months to come; I actually like buying TLT but the S&P, SPX is at a key level I do think that probably can hold … tech has done better in the last months; if you look at equal-weighted technology & strip out the FAANG, Invesco’s RYT is positive over a rolling 1-month period vs XLK that is down .. technology as a broader group has done a little bit better than one might expect … and that’s a very positive reason …”
If buying TLT starts working, then other assets will. If TLT keeps getting clobbered, then the Inferno will get hotter. That we think will be the bottom line for the next few weeks.
Send your feedback to [email protected] Or @MacroViewpoints on Twitter