Summary – A top-down review of interesting calls and comments made last week in Treasuries, monetary policy, economics, stocks, bonds & commodities. TAC is our acronym for Tweets, Articles, & Clips – our basic inputs for this article.
Editor’s Note: In this series of articles, we include important or interesting Tweets, Articles, Video Clips with our comments. This is an article that expresses our personal opinions about comments made on Television, Tweeter, and in Print. It is NOT intended to provide any investment advice of any type whatsoever. No one should base any investing decisions or conclusions based on anything written in or inferred from this article. Macro Viewpoints & its affiliates expressly disclaim all liability in respect to actions taken based on any or all of the information in this article. Investing is a serious matter and all investment decisions should only be taken after a detailed discussion with your investment advisor and should be subject to your objectives, suitability requirements and risk tolerance.
1.”Lord make me bearish, but not too bearish yet“
Some might recall our thought from last week that Newton should have used the term “Trend” instead of “motion” in his first law. With this improvement, see how the Law reads:
- “every object will remain at rest or in uniform trend in a straight line unless compelled to change its state by the action of an external force”
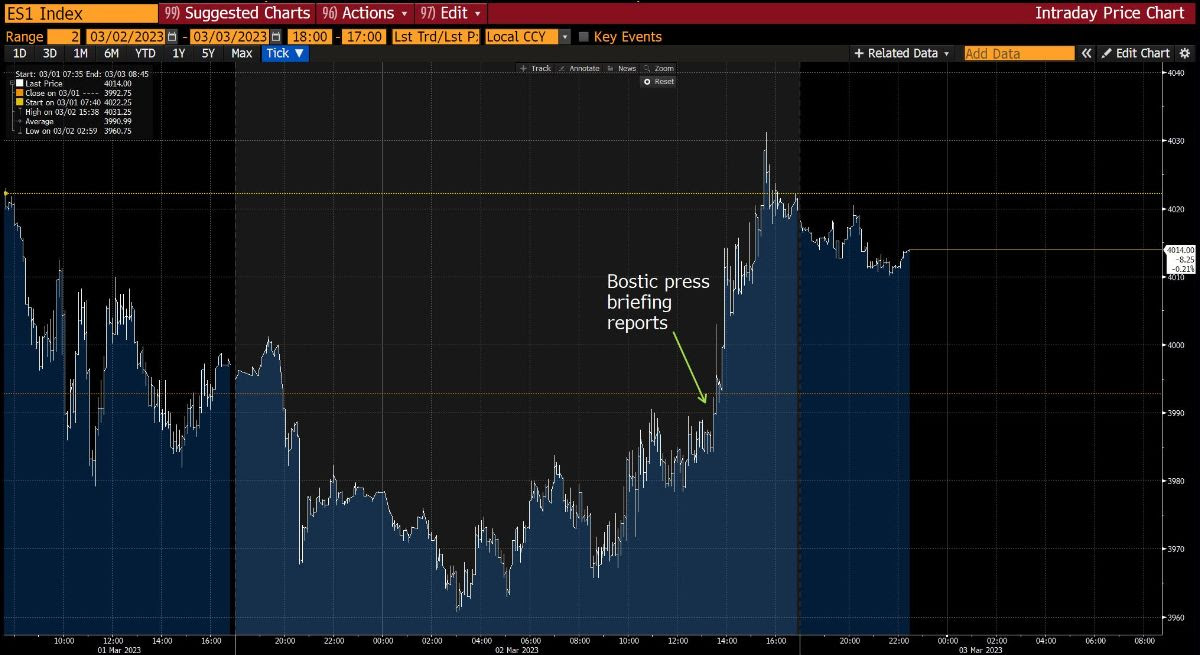
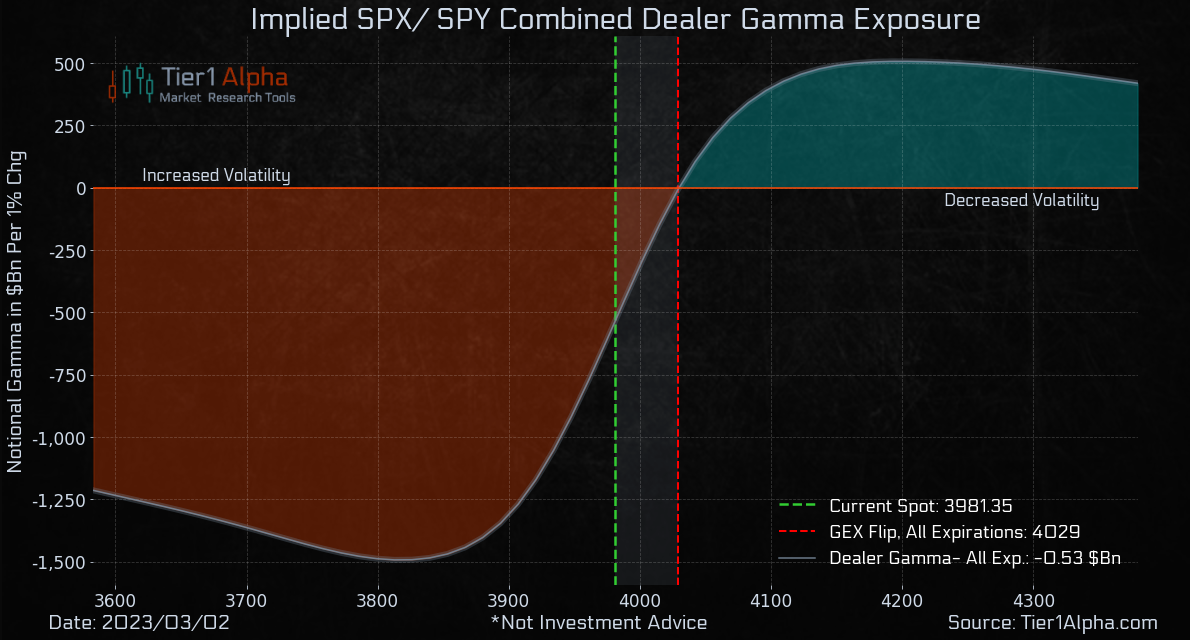
Tier1 Alpha added the following to their chart above:
- ” … the market most directly affected by Bostic’s comments, the Fed Funds Dec 23 contract was no more affected than the SPX and the general price behavior through the day suggests the moves had much more to do with the local gamma created by our friends, the 0dte options … “
In that vein, Tier1 Alpha elaborated:
- “Gamma exposure – Given the steepness of the gamma surface, it was unsurprising to see markets chase higher with additional fuel provided by the Bostic comments. As we’ve repeatedly cautioned, “Lord make me bearish, but not too bearish yet.” Unsurprisingly, we made another run for 4000“.
That is a prayer many individual investors should remember:
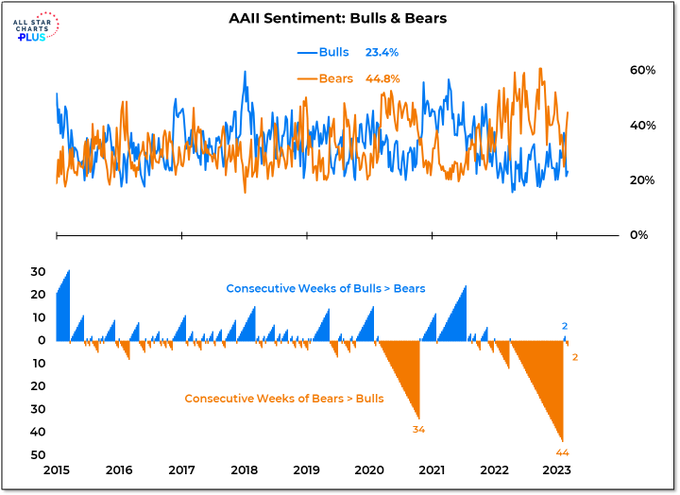
- Willie Delwiche, CMT, CFA@WillieDelwiche – Mar 2 – Individual investors aren’t waiting around to see what happens next. Just three weeks removed from the most bulls in over a year, the AAII survey now shows nearly twice as many bears as bulls.
But were individual investors the big factor in the rally? The Market Ear suggests a faster reactive investor category:
- Via The Market Ear – Friday pm – CTA – trading short gamma without the theta checks – CTAs killed it last year, but this year frustration continues to be huge in equities. Short at lows, long at highs and back to shorts right at market reversals. Goldman’s Nocerino writes: “Length has gone from long $21bn in S&P on Feb 22 to now being short $4.6bn as of yesterday..“
Presto – Dow up 387 points on Friday; S&P up 64; NDX up 246; SOX up 44 ; DJT up 44;
Any opinion on where this rally heads?
- Via The Market Ear – Bull Bannister myth busting the bears – Bannister repeats 4,300 S&P 500 already in Q2. “The bearish chorus of Wall Street strategists continues to fight the S&P 500 rally since the intra-day low (3,491.58) Oct-13, 2022, with those strategists flip-flopping from calling an imminent recession (caused by the Fed) to no recession (so, the Fed must cause one). Some say it is a “bull trap” but that misses major trades in a range-bound decade-long channel. They can call it a bear market rally, a bear trap or call it a banana…we are not ignoring potential 6-month 10-15% rallies.” (Bannister, Stifel)
The external force of Bostic had even a larger influence on NDX.
Now look at the chart below of overhead resistance to NDX from Carolyn Boroden & answer her question yourselves:
- Carolyn Boroden@QueenOfFibs – Mar 2 – NQ at resistance…..to fail or not to fail…..
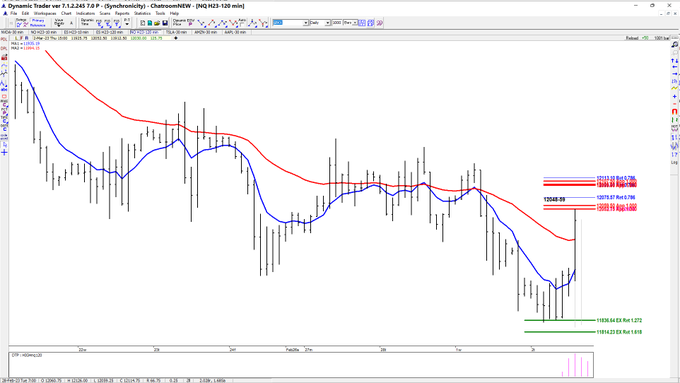
Well, NQ or the March NDX 100 future closed on Friday at 12324.50. The outperformance of NDX over S&P 500 was evident over the past week:
- Dow up 1.7% on the week; S&P up 1.9%; NDX up 2.6%; RUT up 2%; AAPL up 3.3%; GOOGL up 5.1%; META up 10.6%; SMH up 2.3%;
But weren’t stocks the secondary trend with U.S. Dollar & Treasury yields as the two dominant trends? As you can see, the primary Dollar up trend did succumb to Bostic’s external force.
That meant:
- Gold up 2.3%; GDX up 5.9%; GDXJ up 6.3%; Silver up 2.9%; Copper up 3%; CLF up 16%; FCX up 9.6%; MOS up 10.6%; EWG up 3.3%; EEM up 2.9%; FXI up 6.3%; Indian Equities ETFs up 2.8%;
But what about interest rates? One end was easy:
- TLT up 86 bps on the week; EDV up 1.4% on the week; ZROZ up 2.5% on the week; 30yr Treasury yield down 5.2 bps; 20-yr yield down 1.3 bps; rest of the curve was up in yield, highest rise in 3-yr yield by 7 bps;
2.Treasuries – Inversion & discordance at the two ends
This week we saw smart women equity investors like Karen Finerman (CNBC FM) & Rebecca Patterson (ex-Bridgewater) say that, given the uncertainties, they prefer to own 6-month or 1-year Treasury notes that provide 5.3% – 5.15% yield.
This is in stark contrast to smart women fixed income managers who want to stay away from such short maturities & instead like 10-year Treasuries & longer maturities.
The first one, Kelsey Berro of JPMorgan, said on Friday on Bloomberg Real Yield that they were seeing buyers of the 10-year Treasury note as its yield touched 4% this week. Her comments on the 2-year Treasury yield were more interesting:
- “2-year yields always trade at least to the terminal rate of Fed Funds at some point during the cycle; … 2s are absolutely going to rise & may be test 5%; 10s, on the other hand, are going to be sticky; which means 2-10s will continue to invert; wouldn’t be surprised to see – 100 bps or trade thru – 100 bps as Fed continues to hike rates by 25 bps 1,2,3 more times;
The second one, Priya Misra (PM) of TD Securities, has earned kudos with her excellent analysis & calls on Treasuries. She put out a Buy on 10-year Treasuries & longer maturities on Thursday, March 2. Naturally she was invited on 3 Fin TV segments within 24 hours shows to explain her reasoning. The best clip of the three, in our opinion, is her conversation on Bloomberg Australia on 2nd March evening (NY time).
- “I think long end of Treasuries are attractive because where does the Fed end up – at 5.25%; 5.5% or 6%?; I think what the Fed is telling us is that they are committed to 2% inflation; in our view the only way to get 2% inflation is thru a hard landing; .. the Fed is on a mission until they slow things down ; so positioning for a hard landing, whether it is later this year or early next year, implies those long-end Treasuries; I like owning 10s, I like owning 30s; I would stay away from the front-end; its so sensitive to the end point of the Fed hiking cycle, to how long they stay on pause; but I think 10-yr at 4% is attractive; we added to our long position; I think it is attractive as a longer term play because at some point when inflation gets to 2%; unemployment 5%, the Fed is going to start to cut rates; we think that is a 2024 story but the 10-year should be pricing in your view of interest rates over the next 10 years … so I think 4% is attractive … it is particularly attractive vs. risk assets; because I don’t think the broader market is pricing in a hard landing; I think we are pricing in a no-landing; that is why if you get that slowdown the Fed is trying to engineer, I think risk assets struggle; only long-end Treasuries would be a good hedge;
Man, this reminds us the report Rich Bernstein put out at Merrill Lynch in February 2007, if our memory serves us correctly. It took another 9 months for the long end of the Treasury market to move in 2007. But what a fantastic hedge did the 30-yr Treasury prove vs. stocks from then until December 2008?
When asked why this story has taken so long? PM replied:
- “I would argue it is the lags; policy only became restrictive near the end of last year in December 2022; … we can debate if the lags are 12-months or 18-months but they certainly are not a couple of months; … the economy needs time to responds to monetary policy … I think we need more time than higher interest rates; .. that is why the Fed continues at 25 bps hikes — going 25 bps would signal the Fed wants to add lot more restrictiveness to policy; “
She also thinks the “savings buffer of the consumer runs out by year-end“.
Does the above actually suggest owning equities in the near term or until the economy starts visibly showing the impact of Fed’s restrictive monetary policy? And isn’t that what the markets have been telling us in this year, including February?
3. Equities
The most interesting thing Mike Wilson said this week was the following line On Match 1 on BTV (00:12 to 00:45):
- “It’s more about what happens to earnings; If earnings come down in a way we think is appropriate with the path that we see & we don’t get a reset on price, then we will just say, its over; that could be here, it could be down 5%, down 20% ; “
He added that their work suggests its going to be down 20% but the sentiment is that the decision point is nearing. Recall he had suggested a couple of weeks ago that his “selloff is not for Q2; if it doesn’t happen in March, it won’t happen“. Note however the big difference. Wilson is admitting that the market’s price reaction to his expected earnings fall is the key, not the earnings shortfall itself.
One positive view of why the stock market has not reacted hard comes from JPMorgan via:
- Via The Market Ear – Thu – JPM’s Nikos with the main bullets: 1. the Equity Risk Premium has been acting as the shock absorber 2. credit stress has been contained as borrowers who had fixed rates before 2022 have been rather immune to interest rate increases 3. there is still considerable excess cash in the financial system.
A simpler view is that the market knows:
- Larry Tentarelli, Blue Chip Daily@LMT978 – Mar 4 – Druckenmiller: “The stock market is the best economist I know”. – New highs yesterday in: steel, casinos, lodging, building materials, travel, auto manufacturers, industrial machinery ++.
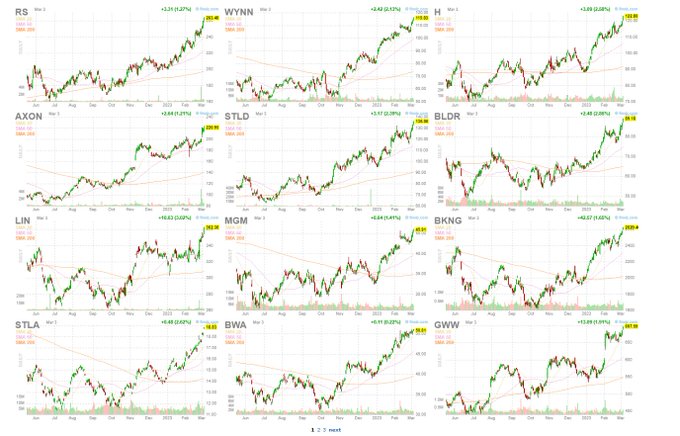
A simple way of putting this is:
- J.C. Parets@allstarcharts – Mar 3 – of course you think it’s a bear market if you only look at the S&P500. But when you go sector by sector, stock by stock, country by country, for the last 9 months it’s been the exact opposite of a bear market. It’s just math. Don’t ignore what’s right in front of you.
Noted technician Jeff DeGraff said on Friday on CNBC that he had asked his team to find him something that is bearish; that is hard to do, he said, given how strong global markets are ; easiest way to encapsulate that – this not a US-centric rally; its led by Europe; cyclicals are leading this rally. We wanted to highlight this clip but guess what? CNBC did not post this clip either on their website or on YouTube. As we have said before, we just don’t get the webmasters at CNBC.
And then you have,
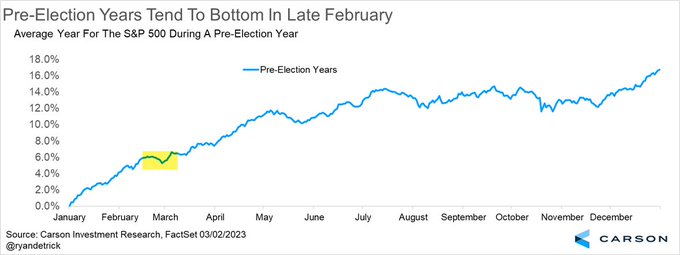
- Ryan Detrick, CMT@RyanDetrick – Mar 2 – During a pre-election year, the S&P 500 bottoms in late February before a spring rally.
Add to the above the possibility that the frenetic rise in Treasury yields is too much & the next move could be lower Treasury yields. Then technology stocks might also join the above rally & juice up the S&P & other indices, right? This is what Mark Newton had suggested before Treasury yields exploded up on February 23. Could he prove right for a month or so after a week of being quite wrong?
But wait! How on earth could Treasury yields fall given the torrid labor market? Ask Tom McClellan, we would suggest!
4. “Three Signs Employment is Going to Take a Hit“
That is the title of the article by Tom McClellan on March 3, 2023. The three signs are illustrated by three charts that we would recommend readers to look at with the commentary by Mr. McClellan. The article begins with
- “I am expecting that the recent months’ nice numbers for unemployment are going to change very soon (in economic terms). There are three great leading indications that help us know what the lagging data of unemployment are going to do“
The three indicators are:
- “changes in consumer confidence precede changes in the unemployment rate by about 10 months. This should mean a rise in the unemployment rate over the next few months, to match the drop in consumer confidence that started more than a year ago“.
- “A similar message comes in the next chart from a longer term leading indication. Changes in the inflation rate lead to corresponding changes in the unemployment rate about 2 years later. This model calls for a dramatic rise in the unemployment rate, leading to a peak due in late 2024“.
- “movements in the Employment-Population Ratio tend to lag the movements of the stock market by about a year. This point is especially valid when it comes to stock market declines, which tend to lead to corresponding declines in the Employment-Population Ratio“
That leads to his “if” & another “if”:
- “So if the October 2022 stock market low really is the bottom for that bear market (a point still yet unproven), then we can reliably expect a bottom in the Employment-Population Ratio that would be due in October 2023. That is a little bit hard to contemplate, since we have not even seen a commencement of a decline in that ratio. And if the 2022 bear market actually is not over yet, then that pushes back the end point for the coming decline in the jobs market, which the Fed seems so eager to engineer, thinking that it will somehow help inflation.”
Note he is NOT saying that the decline in the jobs market will be pushed back but that the “end point of the coming decline” will be pushed back. Meaning presumably that the coming decline in the jobs market will be longer term in duration. Who else but David Rosenberg, Priya Misra, Kelsey Berro & their cohort might rejoice at that possibility?
On the other hand, what if this coming decline in employment is signaled this coming Friday in the NFP report? A robust rally in Treasuries, a fall in the Dollar & an ensuing rally in the stock market to say 4,300 in S&P to satisfy Signor Bannister?
That does remind us of March-May 2007. That was when CLF, FCX & global growth stocks went happy. That continued with few ups & downs till October 2007 when the words of Rich Bernstein (written in Feb 2007) made money. Could this week’s words of Priya Misra make money similarly in 2023?
Of course, some smart people are using the term “October 2007” already:
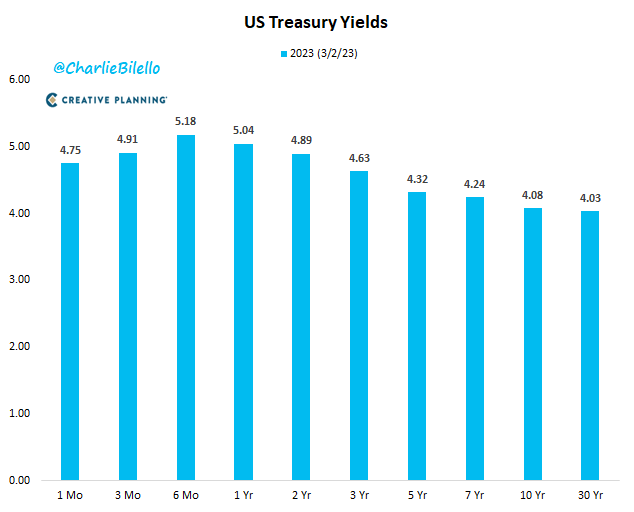
- Charlie Bilello@charliebilello – The entire US Treasury yield curve – from 1 month through 30 years – is now above 4%. We haven’t seen that since October 2007.
As we have said before, can we mention 2007 without mentioning one name, a name that often shows how dumb consensus can be? It has been consensus that Goldman Sachs was arrogantly stupid to get into consumer finance & that their exit with a major loss was just what they deserved.
An alternate view suggests that Goldman was actually very smart, just as they were in 2007 in taking another big stop loss:
- Lawrence McDonald@Convertbond – Mar 2 – Flashback to 2006-2007, Goldman was the FIRST to exit subprime — it was a classic, hall of fame stop 🛑 loss. Today, as colossal interest rate risk hits the $4.8T consumer finance mkt – they cut bait again while most are asleep. History rhymes, indeed.
5. From Washout to Turbulence to Stabilization
We are talking about our adjectives to the Adani situation. The big story this week was that NY-based GQC Partners had invested $1.87 billion in several Adani companies in a series of institutional purchases. That plus other positive news enables us to downgrade the situation to Adani Stabilization. For more details, take a look at our adjacent article Adani Stabilization – Our Reflections III.
Recall that, out of sheer disgust at Fin TV’s stupid will Adani mess sully Indian market reputation coverage, we had wondered on February 5 whether a Long INDA & Short SPY trade might work. Take a look:
Send your feedback to [email protected] Or @MacroViewpoints on Twitter