Summary – A top-down review of interesting calls and comments made last week in Treasuries, monetary policy, economics, stocks, bonds & commodities. TACs is our acronym for Tweets, Articles, & Clips – our basic inputs for this article.
Editor’s Note: In this series of articles, we include important or interesting Tweets, Articles, Video Clips with our comments. This is an article that expresses our personal opinions about comments made on Television, Tweeter, and in Print. It is NOT intended to provide any investment advice of any type whatsoever. No one should base any investing decisions or conclusions based on anything written in or inferred from this article. Macro Viewpoints & its affiliates expressly disclaim all liability in respect to actions taken based on any or all of the information in this article. Investing is a serious matter and all investment decisions should only be taken after a detailed discussion with your investment advisor and should be subject to your objectives, suitability requirements and risk tolerance.
1. Back to Conundrum!
The U.S. Economy printed a whopping 5.0% Q3GDP this Tuesday. Treasury yields rose by 10 bps on Tuesday at the longer end & the 30-5 curve steepened by 3 bps. The 5-year note auction was disappointing and rated “D” by Rick Santelli. So far so sensible. The Jobless claims number came in stronger on Wednesday morning and Treasury yields rose again. Sensible again. Then came a disappointing 7-year auction on that early close Wednesday. Makes sense right?

(5-minute chart of TLT for the week)
Then came the stunner. Long-duration Treasuries began rallying after that auction and closed positive on the highs of the day on high volume. And the curve flattened on the day. The rally continued on Friday and so did the flattening. The 30-5 year curve closed at 106 bps on Friday, a full 5 bps flatter on the week.
The last time we saw this was after the 6.9% growth in October 2003. We recall how Larry Kudlow & Michael Darda proclaimed this number as evidence of a strong economy and predicted a rout in 10-year yields. It didn’t happen then and it is not happening now.
- Wednesday – Lawrence McDonald @Convertbond – Best Q3’s last 15 Years: US GDP Do you see the big picture??? #DownTrend #Debt
2014: +5%
2003: +6.9%
2000: +7.8%
In case, it wasn’t clear. McDonald added:
- Wednesday – Lawrence McDonald @Convertbond – High Year over Year US GDP Growth
10s: 3.1%
00s: 4.8%
90s: 5.9%
80s: 7.8%
70s: 6.7%
60s: 8.2%
50s: 9.5%
CBO data Debt to GDP 40% to 110%
All that is right but still – why couldn’t Treasuries this week with that stunningly strong data? Is this basically Europe or does the bond market smell something about the U.S. economic recovery? Greenspan did begin tightening 6 months after the Q3 2003 GDP and Chair Yellen seems focused on raising rates in Q2-Q3 2015. It took another 2 years before the yield curve flattened around 5%-5.50% in June 2006. When does today’s yield curve flatten & at what level? Gundlach is already on record with his prediction for a flattening in 2015 “at a level previously thought unthinkable“.
The inexorable flattening of the yield curve has been the most consistent story of 2014, a move from 223 bps on 30-5 yr curve on December 31, 2013 to 106 bps this Friday. As a result, this year TLT & EDV have risen in price alone by 22% & 37% resp.
2. The Santa Claus Rally
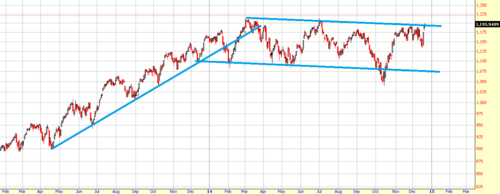
What a move has this been in 10 calendar days & 8 trading days since pre-Fed Tuesday, December 16? Dow up by nearly 1,000 points from 17068, SPX up over 100 handles from 1972 to 2089 & RUT up 6.7% from 1139 to 1215. And we have three more trading days to go in 2014.
The Russell 2000 has been the star of this move from December 16. This week, it closed above its March 2014 high for the first time. Chad Gassaway discussed the small-caps on Monday in his article The Technicals, Sentiment, and Seasonality Heading Into 2015.
- The Russell 2000 has broken slightly above the declining channel dating back to the beginning of 2014. Should this pattern turn out to be a large bull flag, upside in the RUT could be just beginning.
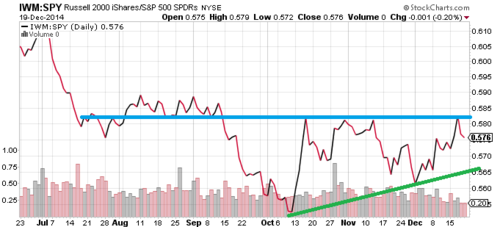
- Moreover, while the Russell 2000 has been consistently underperforming the S&P 500 in 2014, it has now put in a higher low and appears to be forming an ascending triangle on the IWM:SPY ratio chart. This leads us to believe that it could soon outperform the SPX.
Therefore, while we are well off of technical support levels, the market continues to have room above to run. Some shorter term levels of resistance sit just above but the longer term technicals remain solid. Also, small caps are leading us to believe that risk is re-entering the market at these levels.- Following the extreme bearishness of retail investors last week, sentiment and the markets have both rebounded. S&P DSI has risen to 52 after bottoming at 16 just last week. While this is well off lows, the market has continued to rise until retail sentiment has reached between 75 to 90 since 2012 at which point it has consistently formed short term tops.
So. where could the S&P go in this run?
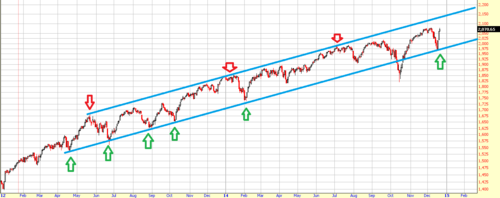
- Also, while the S&P 500 is well off of support lows, the two year channel that has formed is well above at approximately 2150. Those with a longer term outlook continue to have significant room above.
Small-caps “beginning” a rally, IWM outperforming SPY, risk re-entering the market at these levels – doesn’t it seem like 1999? That’s what David Tepper wondered this week:
- “This year rhymes with 1998. Russia goes bad. Easing [is] coming from Europe. Sets up 1999 … [oops] I mean 2015.” … “You [just] have to be aware of the possibility for some sort of overvaluation of the markets. And they are fair value now.” … Remember in 1999 the S&P [500] went to a 30 PE. Next year PE is now like 16,”
- “Worldwide money [was] made too easy for where USA fundamentals were in both late 1998 and 2014,” Tepper continued, saying what happened in 1999 is “not exactly the same” but said it was “similar.”
Remember, Greenspan began tightening in 1999 but did it so slowly that the markets ignored him in 1999. We expect Chair Yellen to raise rates slowly if at all in 1999. So we could have QE in Europe, inexpensive oil, a Fed that will tip toe into a tightening. the 3rd year of the Presidential cycle, an year that ends in 5 – so Tepper could prove right about a 1999-type 2015, especially the individual investors come in with both hands in 2015.
On the other hand, David Rosenberg wrote on Wednesday:
- “Barring a complete flattening of the U.S. Treasury curve or heightened recession risks, next year should be another year of positive returns.”
- “But as we saw in 2014, as good as it turned out to be, it was less than half the return posted in 2013 and one should reasonably expect another halving in 2015“.
3. Oil
- Friday – J.C. Parets @allstarcharts – this pattern in Crude Oil the last couple of weeks does not look like a bottom to me. New lows probably coming very soon $CL_F $USO
Tom McClellan discussed the crash in oil in his well-titled article Oil follows Gold’s Crash Pattern:
- “So to summarize, the 2008-09 drop in stock prices saw an echo in the 2013 drop in gold prices, which has now had its further echo in 2014 for crude oil prices. There is a similarity in the way that investors panic out of their holdings in each, and that common physics/psychology shows up as a similar pattern in the price plot. More importantly for oil traders, we have now likely seen the climax point for the oil price decline, and up next is a robust but failing rebound which should get everyone excited about oil again in 2015, only to disappointment them all over again.”
Mark Fisher, the veteran commodities trader, was smart, interesting & gave some outlier ideas on CNBC FM 1/2 that could pay off big, if they work out:
- “when does it end? … when Saudi Arabia inflicts enough pain; because if Saudi Arabia came right now and said they are going to cut 2 mm barrels, everybody here would be wrong;I think they are going to go ahead and see how much pain they can give to all the participants so that when they go back to the table everybody will say we will cut; I don’t think they are really after the US producer because we just cant say we are going to cut back by 10%; companies have to do that independently;Mexico, Russia, Venezuela, Iran, Iraq, those countries can just say we are going to cut; until they do, this is a message that is being sent ; does it go to $50, $40; may be“
- “if you look at the long term and you take a poll to ask what is the possibility that oil will be $120 three years from now? everyone would say zero; so for me as an outlier, we can be lower for longer but because no one believes the price can ever be at the price it was I want to take that bet and buy 2-3 years out of the money calls; I am not smart to know what the catalyst would be but 3 years from now there is going to be a surprise because everybody thinks the opposite; nobody thinks price will ever go back there“
- “my bet is you should buy every Canadian oil stock there is after Talisman basically Canada has a for-sale sign on it; if you are China you can look at Suncor, Canadian oil sands; M&A is going to take place in Canada; if you are a European national & if you are worried about the Euro, you can diversify by buying Canadian oil; at 116 to $, where is it gonna go – 120 at worst?
Fisher also mentioned ENY, the Guggenheim ETF for Canadian Energy. Nick Tiller, ex-hedge fund manager, disagreed with Fisher’s Canadian oil stocks call and expects a tradable rally in Us oil companies:
- “I am bullish on oil prices here – we had this big correction that everybody knows about; from a positioning standpoint there have been a lot of people taken out of futures positions or energy equity positions; there has been a lot of tax loss selling; so positioning is half the battle in investing these days; we are poised for a tradable rally; from the supply & demand side, the oldest adage in the commodity business is price cures price; so these things will self-correct I think a lot more quickly than people realize; on the supply side, in particular, US is the driver of all of the supply; non-OPEC; in aggredate other than US did not even grow; & the production we had in the US declined at a 70-80% rate next year because this oil shale that we have been able to tap into automatically declines that quickly; & so the million barrels a day we produced this year, those same wells are going to produce less than 300,000 barrels next year & the RIG count is already rolling over so we are not going to grow at the same rate next year that we grew this year;
- “I like them here for a trade – within the last week in my personal account I have bought BNO, XLE, OIH; that’s a trade because the next $20 move in oil is more likely to be higher than it is lower; I particularly like stocks or investments that have been unfairly beaten with the oil price; so my favorite investment for next year is actually the solar stocks; solar stocks peaked with oil; they have been beaten up a lot; fundamentals have nothing to do with price of oil; Guggenheim Solar ETF TAN; solar demand is still growing 50% a year; electricity prices are not related to oil; solar stocks are in the very early stages of creating yieldcos which are a lot like MLPs, but they are in the first inning of that game much like MLPS were 10 years ago“
4. U.S. Dollar
This has been the story of the second half of 2014 and could well be the story of early 2015 as well, especially if Draghi launches QE on January 22, 2015.
- Friday – John Kicklighter @JohnKicklighter – At this pace, $USDollar and DXY going to tick off a 6 consecutive month rally. Matching longest runs on record: http://stks.co/h1Tjl

- “There are a multitude of reasons to make a New Years Resolution to buy the US dollar and it’s virtually every analyst’s favourite trade for 2015. Here’s another reason: January is the strongest month for the Dollar Index over the past 30 years, averaging a 1.04% gain.”
- “January, especially early January, tends to be a momentum-chasing month with traders piling into what worked best last year. In addition, expectations for ECB sovereign quantitative easing are increasing and the US economy is solid.”
- “Other January seasonal patterns:
- It’s the worst month for the (synthetic) euro over the past 30 years
- January is the fourth worst month for AUD and NZD versus the US dollar
- It’s the best month for USD/JPY over the past 30 years but over the past 10 years it’s the second-worst month
- The rule of thumb on stocks is that ‘as goes January, so goes the year’ but last January the S&P 500 was down 4% but scored a 13% rally on the year.”
Send your feedback to editor@macroviewpoints.com Or @MacroViewpoints on Twitter.