Summary – A top-down review of interesting calls and comments made last week in Treasuries, monetary policy, economics, stocks, bonds & commodities. TACs is our acronym for Tweets, Articles, & Clips – our basic inputs for this article.
Editor’s Note: In this series of articles, we include important or interesting Tweets, Articles, Video Clips with our comments. This is an article that expresses our personal opinions about comments made on Television, Tweeter, and in Print. It is NOT intended to provide any investment advice of any type whatsoever. No one should base any investing decisions or conclusions based on anything written in or inferred from this article. Macro Viewpoints & its affiliates expressly disclaim all liability in respect to actions taken based on any or all of the information in this article. Investing is a serious matter and all investment decisions should only be taken after a detailed discussion with your investment advisor and should be subject to your objectives, suitability requirements and risk tolerance.
1. “smelling something malignant“
In our contagion article on October 11, 2014, we suggested that “… financial markets are smelling something malignant and they are running scared.” That fear created the flash-crash in Treasuries on Wednesday October 15 and prompted Fed President Bullard’s talk about postponing the final taper on October 16th. Coincidentally or otherwise, the stock market bottomed the same day and proceeded to shoot up in a vertical rally for seven straight weeks.
This Thursday, Scott Minerd of Guggenheim Partners seemed to smell what we did in October:
- Well, the recent price action in the market is telling us something important. It is betraying that we potentially have something darker and more sinister on our hands than we may have thought just a few weeks ago.
The close on Friday seemed panicky to us and it came after the worst week of the year. Treasury yields fell below their closing yields on flash-crash Wednesday, October 15. So will the Chair Yellen follow Mr. Bullard’s precedent this coming Wednesday and lessen the rise in rates built into the markets for 2nd half of 2015?
2. Tapering is tightening
We have maintained since 2013 that tapering is tightening. The clearest evidence is the inexorable flattening of the 30-5 year yield curve in 2014 from 223 bps to 122 bps on Friday – a full percentage point. This is what happens during a sustained tightening by the Fed. This reality has been hidden this year because of the steady rally in the US stock market. But this week’s decline prompted Scott Minerd to consider it as a possibility in his article Oil, Roil and Turmoil:
- “While the Fed is clearly not actively tightening, the wildcard is whether or not the end of QE is tantamount to a form of monetary tightening that we have never seen before. The Fed would likely say it is not, but the jury is still out.”
The slow & steady tapered tightening by the Fed soothed the equity markets in 2014 just as the slow & steady tightening under Greenspan had done from 2004 to 2006. Until the high-yield market broke and oil fell off the cliff this week.
Last week, Larry McDonald of NewEdge said:
- “there is tremendous leverage in the high yield energy market & the Fed is concerned about it. If oil falls below $60 for a prolonged period of time, it will create the first substantial spike in the U.S. corporate default rate since 2009; While the problem isn’t as large as the subprime mortgage crisis, it is still the biggest risk to the market for 2015; this may restrict Fed’s ability to raise interest rates in 2015“.
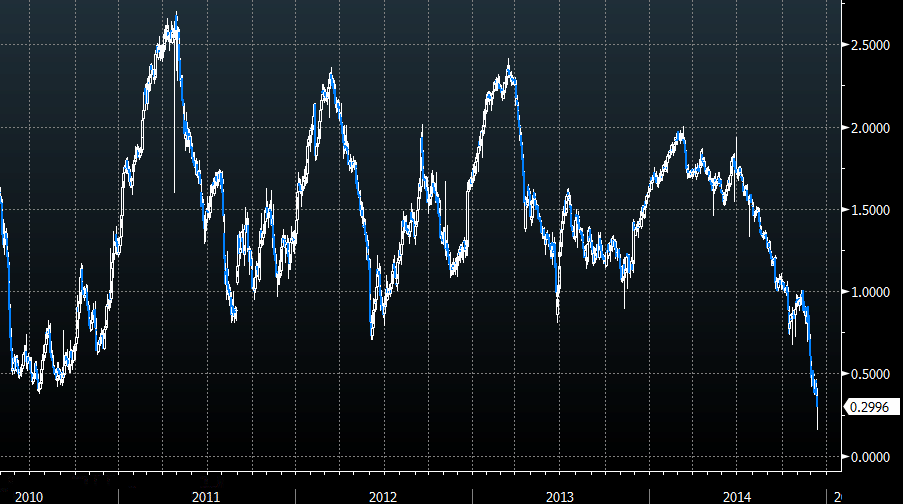
The objective of a tightening campaign is to kill inflation expectations. The Fed’s taper-based tightening has achieved that:
- Friday – ForexLive @ForexLive – Two-year breakevens hit 0.16% basis points today in an absolute 24 basis point blowout. http://www.forexlive.com/blog/2014/12/12/the-market-is-freaking-out-about-inflation/ ….
and:
- Friday – John Authers @johnauthers – Some Friday morning landmarks: US 10-yr inflation breakevens now the lowest since late 2010 (when they prompted QE2)
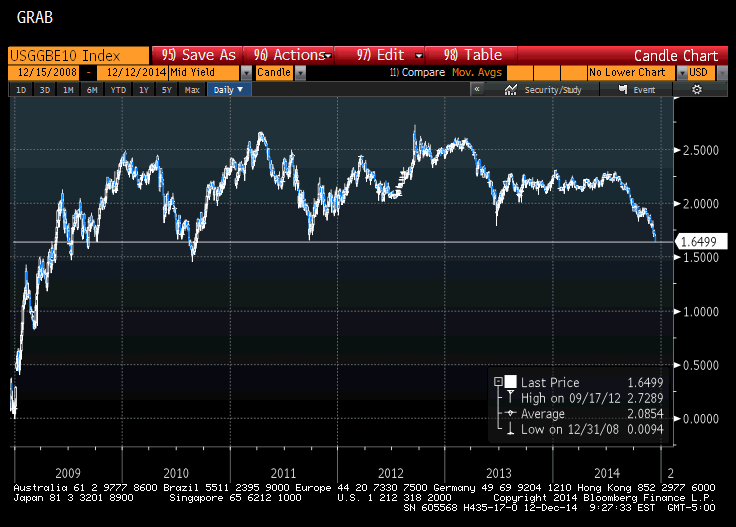
This fall prompted:
- Janus Capital @JanusCapital – Gross: 10yr US breakeven inflation rate at 1.55%. If the Fed believes the market, how can they hike rates?
What happens near the end of a sustained tightening campaign? Carnage in some areas of the bond market.
- Friday – Lawrence McDonald @Convertbond – Goodrich Petroleum 8.875% due 2019 – December: 53 or 28% YTW August: 105 #Oil #Fed #DebtLeverage $GDP
A drop of 50% in the price of the bond. And this is not a unique case:
- Friday – Eric Burroughs @ericbeebo – Given the energy/oil theme of week, will finish it with latest on some US shale-related HY bonds
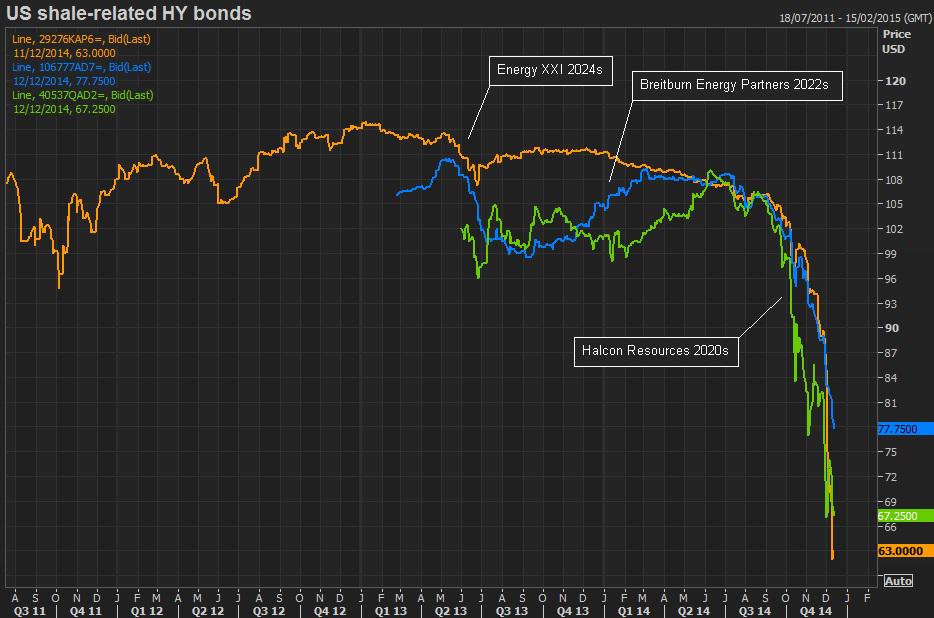
To summarize, the taperized tightening campaign of the Fed has flattened the Treasury yield curve, virtually killed inflation expectations via plummeting breakevens, and created carnage in a highly leveraged area of the corporate bond market – isn’t it time to end the Fed’s tightening campaign?
One guru said yes on Friday.
3. Fed will not raise rates in 2015
This stunning prediction came from David Rosenberg of Gluskin Sheff after Friday’s close on CNBC Closing Bell. Stunning because it is, in his own words, a “real fundamental shift in my view“.
- “I don’t think the Fed is going to raise rates next year; I don’t think they are going to raise rates at all next year; I think they will get the stealth tightening through strengthening of the US dollar; can you imagine what the US dollar does next year if the Fed raises rates? These other central banks – we saw Norway cutting rates, we know ECB is going to do bigger, Bank of Japan is probably continue to extend QE & the Fed’s going to raise rates in that environment & US Dollar is going to act as a major tourniquet on the manufacturing sector – I don’t see that happening – they have been shifting the goal posts all along- we know the labor market is doing a lot better; we know that’s what their focus has been; I think they will shift their focus to inflation expectations; … take a look at the TIPS breakevens; they are like down to 1.6%; the TIPS breakevens are where they were a couple of years back when they touched off another round of quantitative easing; NO I don’t think Fed is going to down another round of quantitative easing but I think the odds that they actually raise rates next year even in the backdrop of a strong economy is going to be fairly remote“
Bill Gross didn’t say it so explicitly but he sort of implied it in his comments to BTV’s Tom Keene on Friday:
- “With the U.S. economy still “highly levered” and dependent on cheap financing, the equilibrium interest rate may be close to where rates are now, … I call it the new natural, Pimco called it the new neutral …
- “You can’t do what Volcker did back in 1979 and flatten and invert the curve because the leverage is significantly more, and so the Fed has to stay very, very positively sloped. And what that means for the natural rate of interest, it’s certainly not what John Taylor suggested in terms of a 2 percent real. I think it’s closer to 0 percent real and maybe even lower, which is close to where we are now.”
4. Oil-High Yield-VIX-Stocks
- Friday – Lawrence McDonald @Convertbond – Oil and High Yield High Correlation
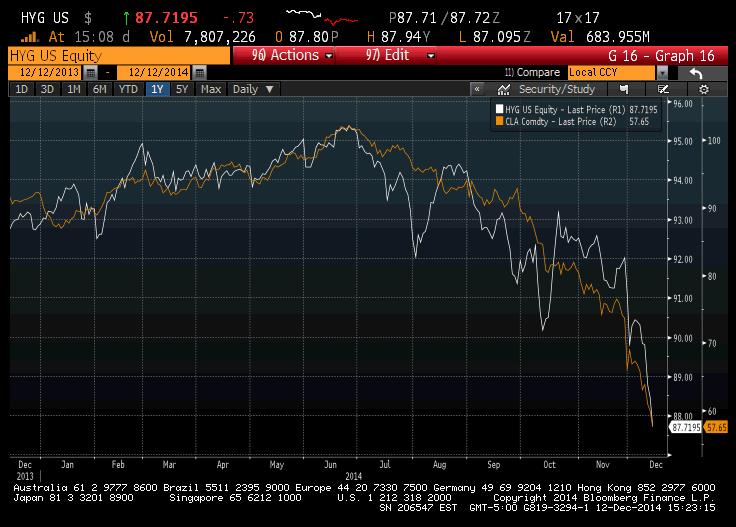
- Friday – Joe Kunkle @OptionsHawk – $HYG 30 day IV near a 2 year high, hitting June 2013 levels, market bottomed 6/24 same day HYG bottomed
Ok. So when does Oil bottom? We got essentially the same answer from two people. First Rick Santelli used price & time to argue:
- $145 high; $34 low took 5 months to develop in 2008-2009; his decline developed from $100 on Julr 22, 2014; five months puts you to Dec 22, 2014; half ohe differ/ence of those prices = $55.50 – this is number to watch and this move ends right before Xmas
Later on Friday on Mad Moner, Jim Cramer conveyed the Hemachandra-Fibonacci numbers based analysis of his fellow technician to argue:
- “oil made a bottom either today or will do between Tuesday-Thursday of next week, December 16-December 18 at $55.67; But don’t trust this bounce; lower lows coming”
Larry McDonald told CNBC Closing Bell that you can get a 10%-15% bounce even in bear markets and we are getting very close to that point. (In their infinite wisdom, CNBC webmasters deleted this critical point from their clip of the McDonald interview).
Scott Minerd’s target is lower:
- “Technically speaking, oil prices have taken out one price level support after another and are now in an accelerated downtrend. The measured move, or the minimum downside potential price according to the rules used by market technicians, is now approximately $50 per barrel.”
Dennis Gartman stated what would make Oil rally:
- it has lot farther to go down; …crude oil has this terrible hysterical tendency of falling 75-80-90% in value; until the term structure in futures, until the front month stops leading the way down, crude wants to go lower; ; until term structure turns positive & the term structure has no intention of turning positive at this point;
Getting back to credit spreads,
- Friday – Charlie Bilello, CMT @MktOutperform – Either credit spreads come in soon or $VIX is going higher before this is over. Spreads already above Oct wides.
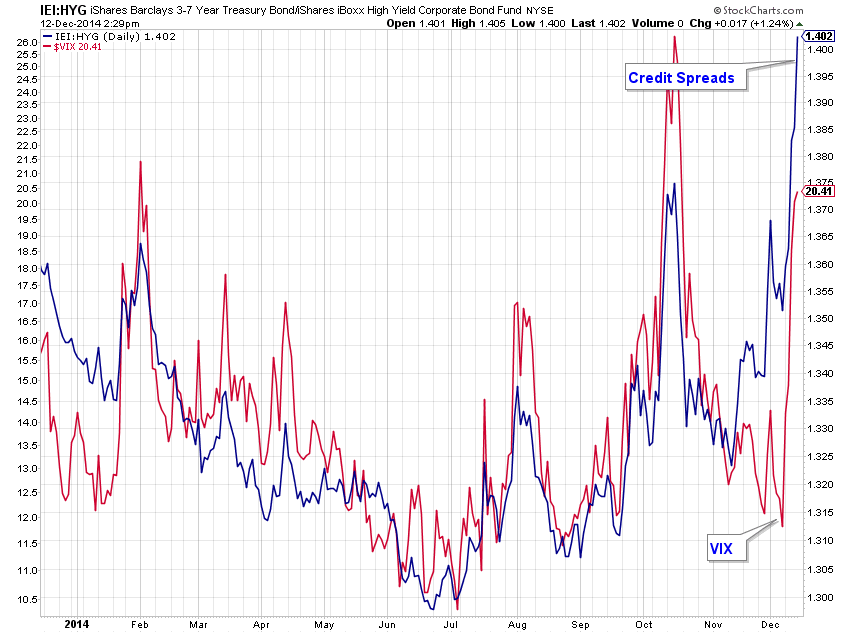
So what about the VIX? This move seems different from the previous declines because VIX is leading the S&P. That could be because investors are not selling their positions because of the looming year-end but hedging them via VIX. At least that seemed to the view of some traders on CNBC Options Action.
The key again, according to Larry McDonald, is:
- “what you want to track now is what is called credit spread contagion – you want to look at top big banks in the US, follow their CDS; if the CDS on the major financials underperform than say the industrials in a major way, we are going lower;thats a sign that this credit weakness is leaking over to the financials“.
So what we need is a magic wand that would tighten credit spreads, steepen the yield curve to help financials, lower the Dollar to help oil, reduce the fear embedded in the VIX and get a stock rally going!
That magic wand may be only 3 days away. What if Chair Yellen pulled a “Rosie” & signaled a dovish turn in her statement or presser on Wednesday, December 17? Wouldn’t it achieve all of the above? The short-end of the curve will plummet in yields thereby steepening the yield curve; credit would rally; Dollar would be sold hard & even Oil may rally. Remember Cramer’s bottoming day for Oil falls between Tuesday & Thursday of next week. And you have:
- Urban Carmel @ukarlewitz – SPY: this is the ugly week in Dec. Next 3 are in the 10 best of the yr. SPY up 7 weeks in a row; those streaks haven’t marked an exact top
The markets are convinced that the Fed will tighten in 2015 and the data supports that. David Rosenberg reminded us on Friday that the Greenspan Fed had a tightening bias through out the 1997-1998 Asian contagion with GDP growth at 4% and unemployment at 4%. Then came Long Term Capital & Greenspan stunned the markets with a rate cut. The current GDP is running at 2.5%-3%, unemployment is at 5.8% and wages are stagnant with inflation expectations falling. So why can’t Chair Yellen stun the markets as Chairman Greenspan did in November 1998?
Then you have the signal with a perfect record of forecasting year-end gains:
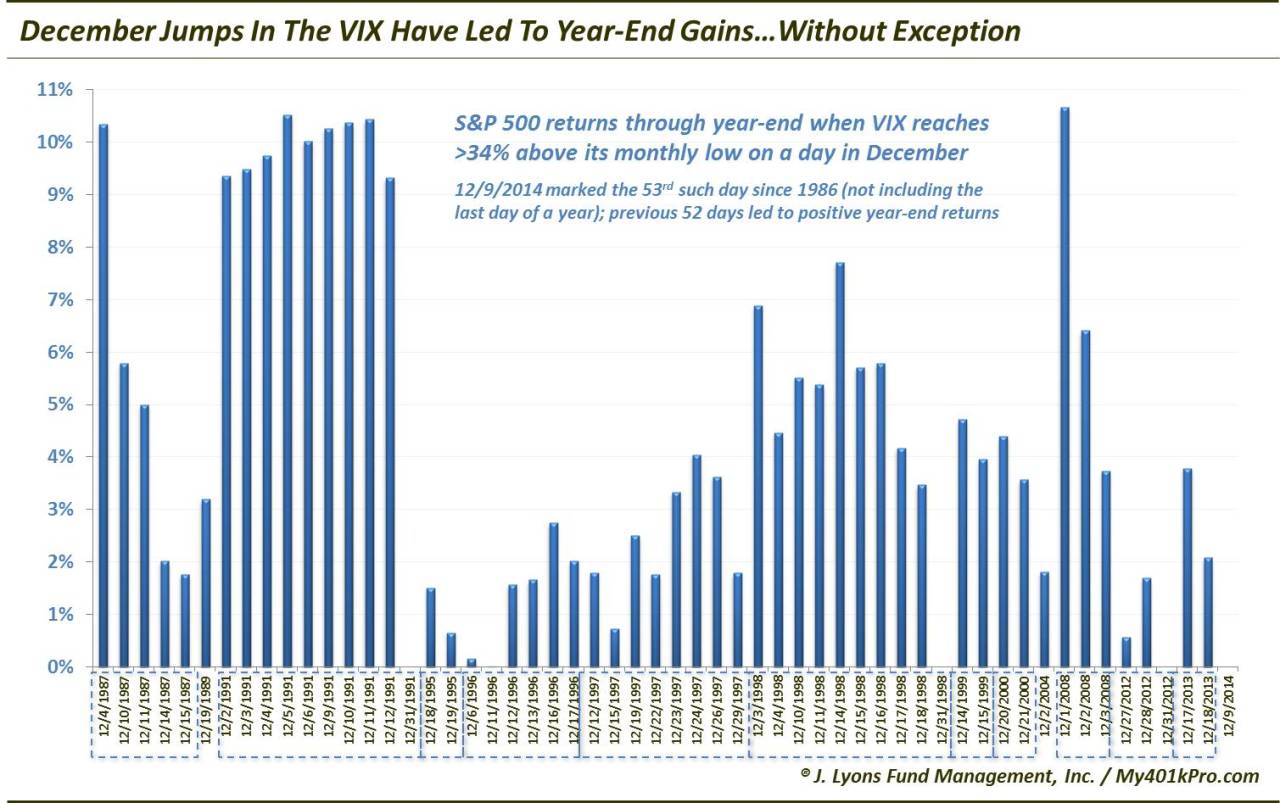
- “Of course, despite the perfect record, hopefully it goes without saying that there is no guarantee. There is always a first time for everything. However, while it may seem like everyone on Wall Street and Main Street is expecting a year-end rally, it would appear that they do have some evidence backing them up”
On the other hand, every horrible close on a Friday brings a twinge of fear of a far worse Monday:
- Friday – Jeff Cooper @JeffCooperLive – no one would expect the market to plunge in December. no one expects in to crash on Monday
Who are we to question a veteran technician like Jeff Cooper? But we do wonder whether his apparition is more relevant for next weekend assuming Yellen remains hawkish. That could be a scenario in which longs liquidate rather than hedge.
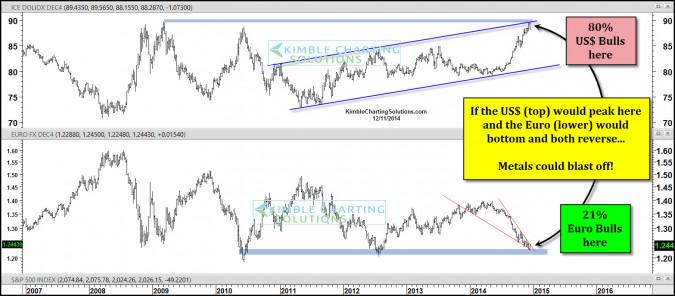
6. Gold & Silver
As Oil ETFs fell by a horrific 10%, GLD & SLV actually rallied on the week.
- Yahoo Finance @YahooFinance – King Dollars’ ripple effects and why trends could change here and now http://kimblecharting.tumblr.com/post/104924114046/king-dollars-ripple-effects-and-why-trends-could … via @KimbleCharting $UUP
Send your feedback to editor@macroviewpoints.com Or @MacroViewpoints on Twitter