Summary – A top-down review of interesting calls and comments made last week in Treasuries, monetary policy, economics, stocks, bonds & commodities. TAC is our acronym for Tweets, Articles, & Clips – our basic inputs for this article.
Editor’s Note: In this series of articles, we include important or interesting Tweets, Articles, Video Clips with our comments. This is an article that expresses our personal opinions about comments made on Television, Tweeter, and in Print. It is NOT intended to provide any investment advice of any type whatsoever. No one should base any investing decisions or conclusions based on anything written in or inferred from this article. Macro Viewpoints & its affiliates expressly disclaim all liability in respect to actions taken based on any or all of the information in this article. Investing is a serious matter and all investment decisions should only be taken after a detailed discussion with your investment advisor and should be subject to your objectives, suitability requirements and risk tolerance.
1.O & R
The IMAG earnings were absolutely wonderful and even more wonderful was the performance of the 4 stocks on Friday morning. That’s just our limited imagination speaking. Some others were wonderfully eloquent, one of them being:
- Rudolf E. Havenstein @RudyHavenstein – “It’s an earnings orgasm, that’s what it is.” – Mr. Wonderful
Mr. Wonderful, or Kevin O’Leary as he is sometimes called on CNBC FM, did not extend his descriptive term to discuss what science calls a refractory period, which in this case would mean an opportunity to scalp a short trade. While the naked eye reveling in the upside gushers might have missed the difference between these four, charts don’t miss much. Look at the difference between AMZN & GOOGL on Friday:
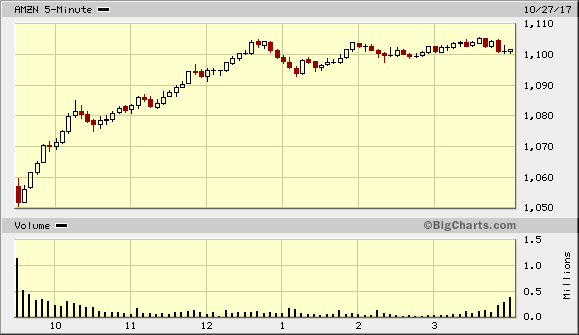
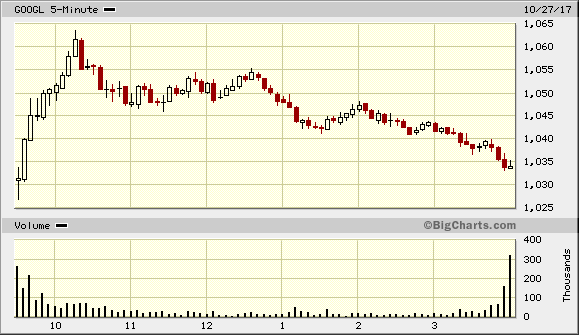
(AMZN) (GOOGL)
GOOGL peaked around 10:15 am & faded while AMZN kept up rising until 10-15 minutes prior to the close. Note also the heavier volume during the last 15 minutes of selling in GOOGL vs AMZN.
MSFT & INTC also behaved differently:
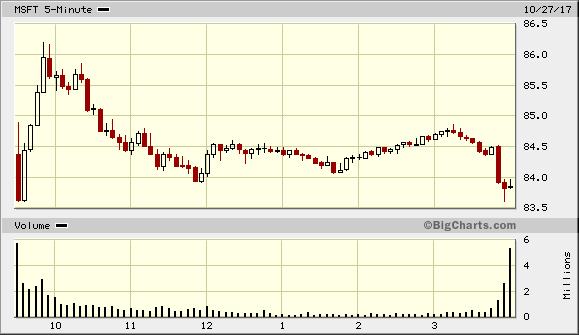
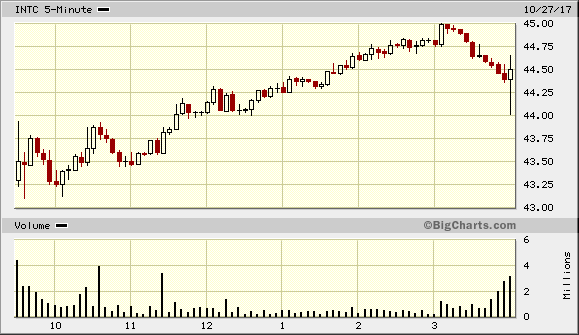
(MSFT) (INTC)
Notice the red candle at the end of the day for MSFT. Also MSFT showed the most volume in the sell off into the close, followed by GOOGL, then INTC and then the best of them all AMZN.
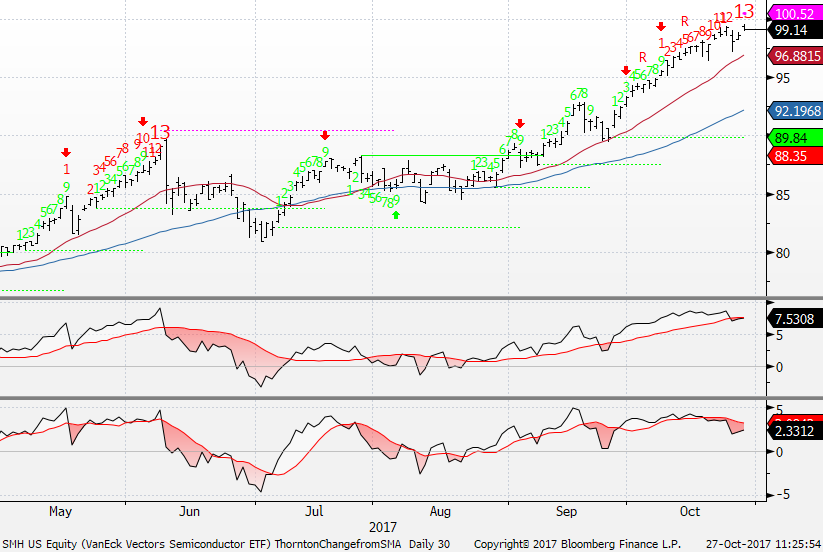
Does any of this mean anything? Will the short scalps presented on Friday morning, deliver more on Monday or will these stocks rally hard on Monday? We got to wait and see but some did notice a sort of Demarkian upside exhaustion potential for next week. Hedge Fund Telemetry saw it in INTC on Friday.
- “As expected with Intel upside (largest weight) SMH Semiconductors ETF has an upside exhaustion red 13 Countdown.”
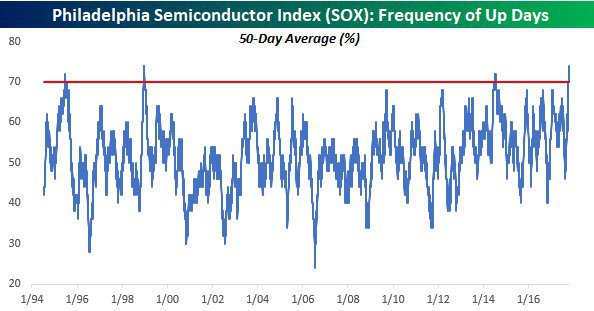
 Bespoke discovered another measure in semiconductors earlier in the week:
- Bespoke @bespokeinvest – Tue 24 – Semis have never been up more over a 50 trading day period than the last 50. $SOX
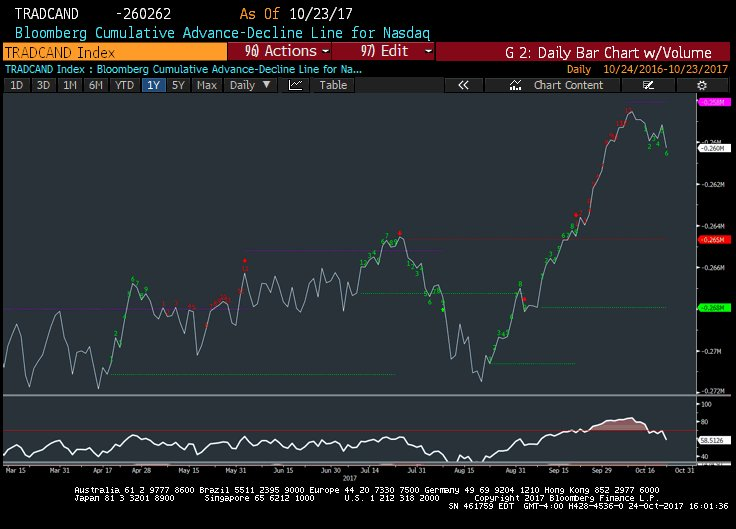
 Another condition was noticed on Tuesday:
- Mark Newton @MarkNewtonCMT – Tue Oct 24 – A/D lines on both NASDAQ and NYSE peaked out last week and have turned lower in the last few days
Shouldn’t the weakening of A/D lines get reflected in markets?
- Andrew Thrasher, CMT @AndrewThrasher The divergence in equal & cap weight S&P 500 continues to widen, with equal weight under-performing by 77 bps today to a new 52-week low.
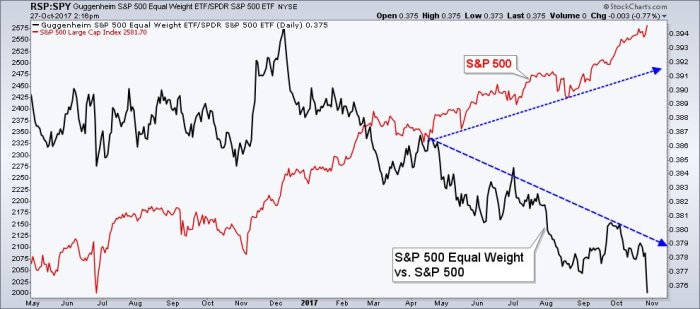 But Andrew Thrasher himself pointed out that these divergences have not mattered so far in 2017. That is why the smart posture has been to wait for something to change.
What could change?
2. Draghi & Yellen
Mario Draghi made his move on Thursday by announcing a taper in his QE from 60 Billion a month to 30 Billion a month from January 2018. Euro fell hard against the US Dollar. Now Yellen is on deck for Wednesday. Will she confirm the start of QT? Will she do so hawkishly or dovishly like Draghi? On that might depend the performance of EUR/USD.
- J.C. Parets @allstarcharts do you guys think this is the type of head & shoulders top that works or the type that doesn’t work?
$EURUSD$DXY$UUP
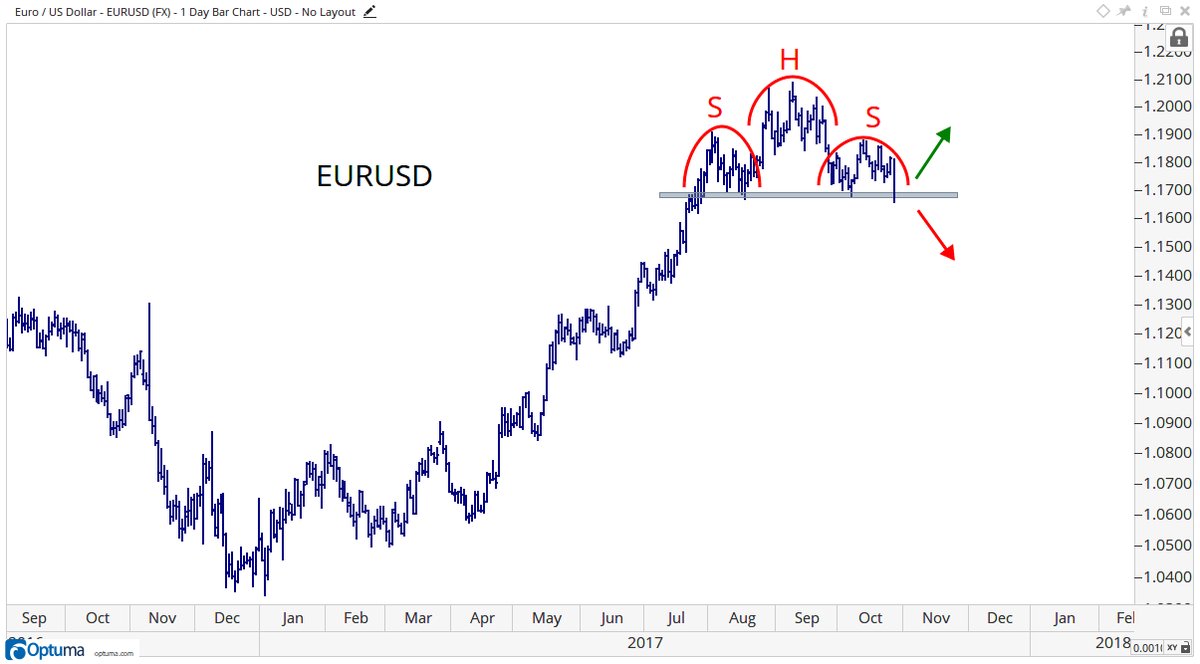 Given the formation above, whatever happens could prove big. Of course, some are clear about what is going to happen:
- Peter Brandt @PeterLBrandt
#Classical_Charting_101 U.S. Dollar Index completes H&S bottom$DX_F$UUP
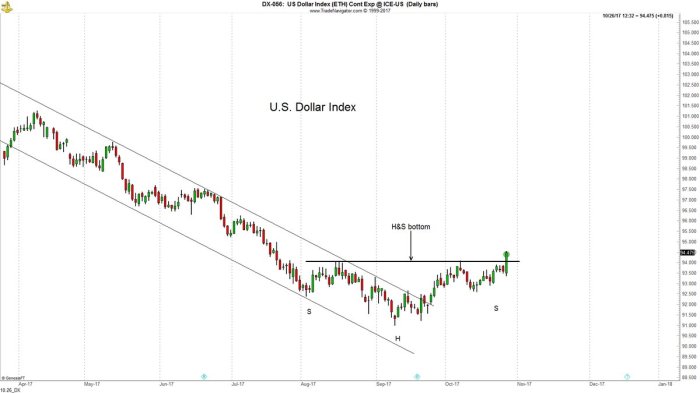 The Dollar was up 1.6% this week. So far a strong Dollar has meant higher interest rates. That has also been the case since Irma. Will that change given Draghi & Yellen?
3. German & US rates
What did Gundlach tweet on Tuesday & on pre-Draghi Wednesday, October 25?
- Jeffrey GundlachVerified account @TruthGundlach – Tue Oct 24 – The moment of truth has arrived for secular bond bull market! Need to start rallying effective immediately or obituaries need to be written
- Jeffrey GundlachVerified account @TruthGundlach – Wed Oct 25 – 10 yr UST at critical juncture & so are junk bonds. JNK & HYG ETFs coiling dead sideways near converging 50,100 &200 day MAs w/ no momentum!
The German 10-yr yield was 48 bps by US close on pre-Draghi Wednesday, October 25. On post-Draghi Thursday, it fell 6 bps to 42 bps by US close. It fell by another 3 bps to 39 bps by US close on Friday. The US 10-year yield closed on pre-Draghi Wednesday at 2.44%; it rose on post-Draghi Thursday to close at 2.457% above the 2016 year-end level of 2.45%. Then it fell by 3 bps to close at 2.42% on Friday. The entire Treasury curve fell on Friday by 2-3 bps.
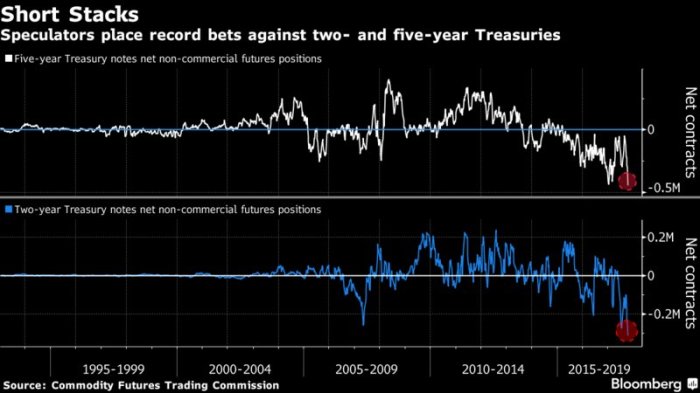
Perhaps the fall in yields on Friday was due to guidance from those who know to expect Powell to be chosen as Fed Chair post-Yellen. Perhaps it was driven both by the fall in Bund yields and the extreme short positions in 2-year & 5-year Treasuries.
- Shane Obata, CFA @sobata416 – Don’t poke the bond bears… ..Speculators have amassed record net shorts in both 2s and 5s: s: BBG
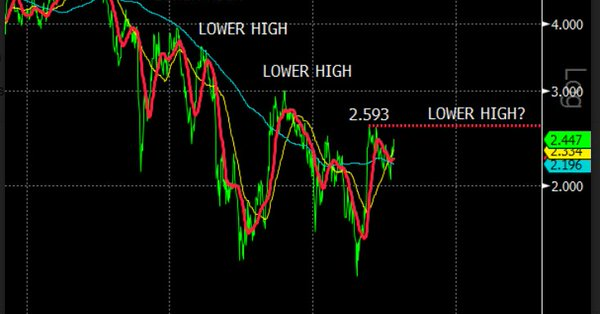
 What about the 10-year? Brotherly Najarian love came to the fore on pre-Draghi Wednesday. Jon Najarian spoke during CNBC FM 1/2 and Pete Najarian tweeted:
- Pete Najarian @petenajarian – Still Lower Highs in 10-Year http://zpr.io/ntJTY via @investitute
 So many smart guys have said so many smart things about stock oscillators. But we had never heard any one speak or write about a Bond Oscillator until Friday. In his article Bond McClellan Oscillator Almost Oversold, Tom McClellan wrote on Friday:
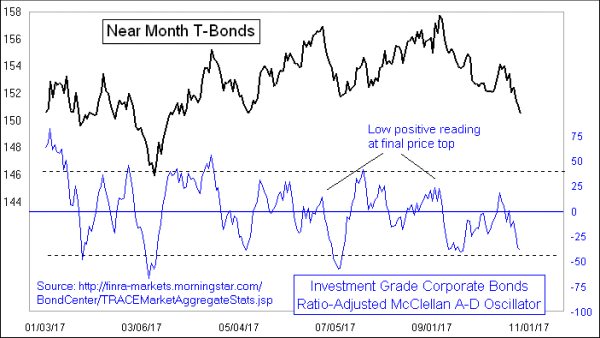
- “This week we see this indicator getting down close to an oversold reading. Sometimes a reading like this is enough to mark a price bottom for T-Bonds. Other times prices can continue going lower in spite of such a reading. Getting down to a reading well below -40 is a surer indication of an exhaustion event, and this one is not quite there yet. This sort of reading says that the bond market is a little bit oversold, which could be enough for a bottom. But it is not yet far enough oversold to guarantee one”
So what do we need? A fast steep sell off post Yellen statement on Wednesday?
4. Gold & Miners
Has there been a more pathetic asset class than Gold & Gold miners for the past few weeks? But is there light at the end of the tunnel despite the up move in Gold? Hedge Fund Telemetry thinks so:
- GLD ETF has a downside DeMark exhaustion red 13 and green Setup 9 count. This is the first potential positive signal on Gold. Gold bullish sentiment (below) didn’t quite get fully oversold but maybe that’s a sign as well.
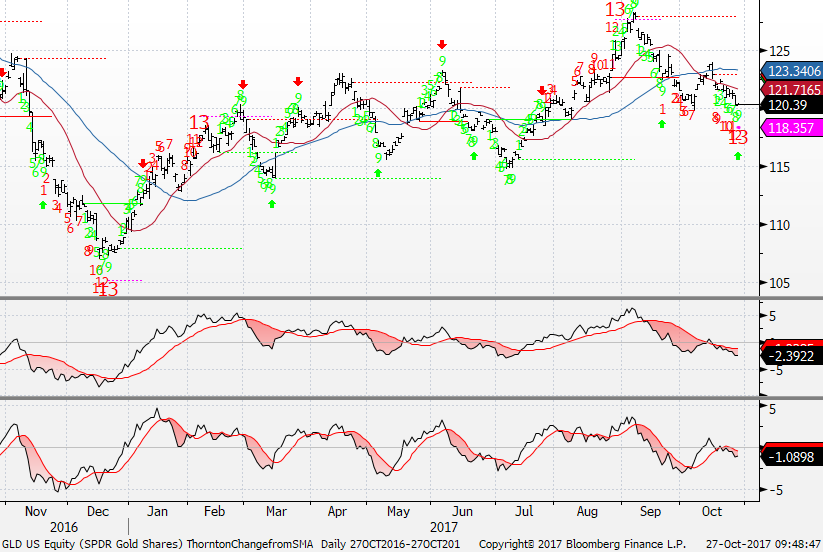 They do warn that Gold Futures have not achieved the same exhaustion yet.
5. EM – India
The Indian indices went to all-time highs this week. The Indian ETFs were up 2-3% on the week. A better performer was INXX, an infrastructure ETF. That makes sense because the Indian Government announced the largest road-building program ever in addition to the recapitalization of the Public Sector Banks. For a more detailed discussion, please see our adjacent article – WOW! From Panic to Glee in 3 Short Weeks in India.
6. Why our change towards Demarkian upside exhaustion signals?
We have been skeptical of upside exhaustion signals of DeMark methods for the past couple of years. Our problem was simple – How can upside exhaustion signals work when there is no sign of the liquidity hose getting exhausted. So we stopped following these upside exhaustion signals during the days of global QE.
So why are we now looking at those signals? The answer is clear – Draghi & Yellen; more specifically their actions in replacing E by T.
The days of unlimited forever liquidity are over. Draghi announced a 50% cut in his QE from January 2018. Yellen has announced her own QT as well. If she begins this QT on next Wednesday, then she will have tied the hands of the next Fed chair at least through the the first half or quarter of 2018.
This will prove to be a major change for global markets next year. As liquidity starts getting reduced, the probability of upside exhaustion signals proving correct will rise. At least, that is our view.
Send your feedback to editor@macroviewpoints.com Or @MacroViewpoints on Twitter