Summary – A top-down review of interesting calls and comments made last week in Treasuries, monetary policy, economics, stocks, bonds & commodities. TAC is our acronym for Tweets, Articles, & Clips – our basic inputs for this article.
Editor’s Note: In this series of articles, we include important or interesting Tweets, Articles, Video Clips with our comments. This is an article that expresses our personal opinions about comments made on Television, Tweeter, and in Print. It is NOT intended to provide any investment advice of any type whatsoever. No one should base any investing decisions or conclusions based on anything written in or inferred from this article. Macro Viewpoints & its affiliates expressly disclaim all liability in respect to actions taken based on any or all of the information in this article. Investing is a serious matter and all investment decisions should only be taken after a detailed discussion with your investment advisor and should be subject to your objectives, suitability requirements and risk tolerance.
1.Weekly vs Monthly
This week is why so many like seasonality as a factor in trading. Week before Memorial Day is usually strong as we have been told and this one was no exception – Dow up 94 bps; S&P up 1.2%, NDX up 2.1%, Russell 2000 up 2.4% & our favorite IWC (micro-cap) up 3.3%. And TLT up 52 bps with zero-coupon EDV up 95 bps. Credit flat and Dollar up 18 bps.
But for the month, S&P was only up 55 bps, NDX was down 1.3% and TLT was down 17 bps. So that fit the “grinding 70 bps expected return” laid out by Nomura’s Charlie McElligott on April 30, as we reminded readers last week.
The real action was in Emerging Markets both this week and this month. Broad EM ETFs beat the S&P handily on both counts. But the absolute star was Brazil with EWZ up 5.2% this week and up 9.5% this month. And the star of stars for the month was Petrobras, the stock we discussed on May 7 remembering Mark Fisher’s great call in February 2016. Yes. PBR was up 20% this month.
So it handily beat IBN, the ADR of Indian Bank ICICI, which was only up 11% in May. The broad Indian ETFs which were up 8.5% – 8.9% for May.
As we found out from @Macrovoices & Larry McDonald that India & Oil may be closely related next year & beyond despite their inverse correlation forever. More on that & Larry McDonald later.
The voice that proved right in the March decline in Nasdaq stocks spoke up twice this week. First,
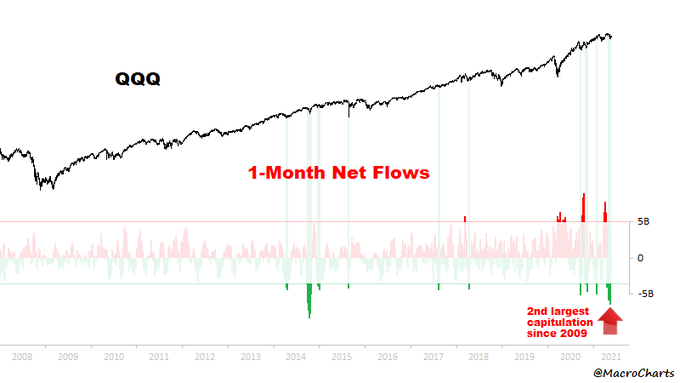
- Macro Charts@MacroCharts – May 24 – Everyone has a foot out the door: $QQQ had another mini-panic this month. The market dropped a little and everyone ran for the exit. The story of 2021: a rally that keeps renewing itself, with minor pullbacks shaking everyone out. A textbook Bull market – follow the trend.
Then the next tweet three days later:
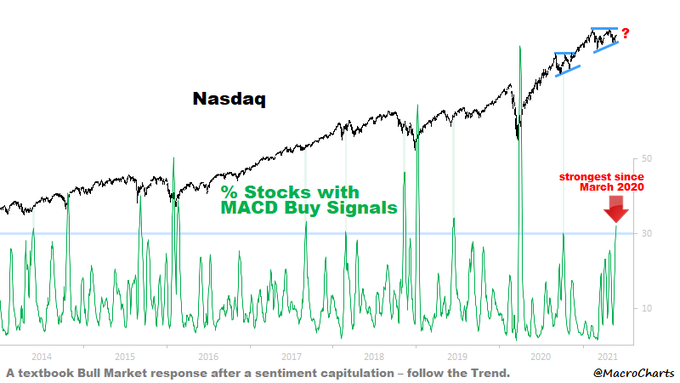
- Macro Charts@MacroCharts – May 27 – Important strength in Growth Stocks: One third of Nasdaq Stocks have triggered Buy signals – the most since March 2020. Most spikes of this magnitude led to bottoms or *big* rally extensions. A textbook Bull Market response after a sentiment capitulation – follow the Trend.
This strength might have had something to do with David Tepper’s comments as articulated via Jim Cramer – that he is bearish on Bonds but if the message the Bond market is sending is correct, then FAANGs are the cheapest stocks in the market. Except only the FMG performed this week (Facebook, Microsoft, Google).
Kinda consistent with that was the following on Friday:
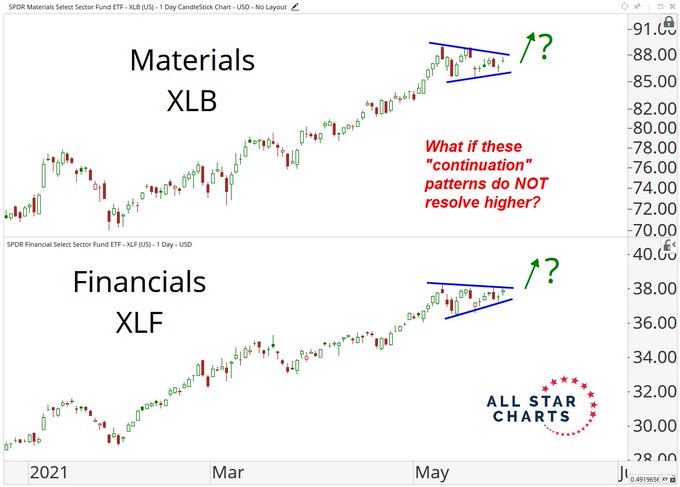
- J.C. Parets@allstarcharts – What if these consolidations don’t resolve higher?allstarcharts.com/what-if-these-
Parets elaborated in this piece:
- “Our upside objectives were met in Financials. So if these patterns were NOT going to break out in the direction of the underlying trend, and instead were going to resolve lower, this would be where that sort of thing would most likely happen. … And when “Continuation” patterns, or what the book says ‘should resolve higher‘, does NOT, then that is the signal. … But I think the higher probability outcome is a break lower, not higher. For me, this market is guilty until proven innocent. Let it prove itself, is how I see it.”
What was one asset class (if it is actually one such class) that gave excess return this week & for the entire month? VIX was down 10% for the month and a whopping 16.8% this week. So in the VIX Spike (Lawrence McMillan) vs. VIX Swell (Mark Sebastien via Cramer) battle, McMillan is right so far:
- “Volatility, as an indicator, remains bullish for the stock market. The latest $VIX “spike peak” buy signal, which came right on the heels of the previous one, remains in effect. Furthermore, the trend of $VIX is downward again, as it is probing the recent lows near 17″.
Yes, one is not supposed to qualify signals, but could the observation below be something to ponder?
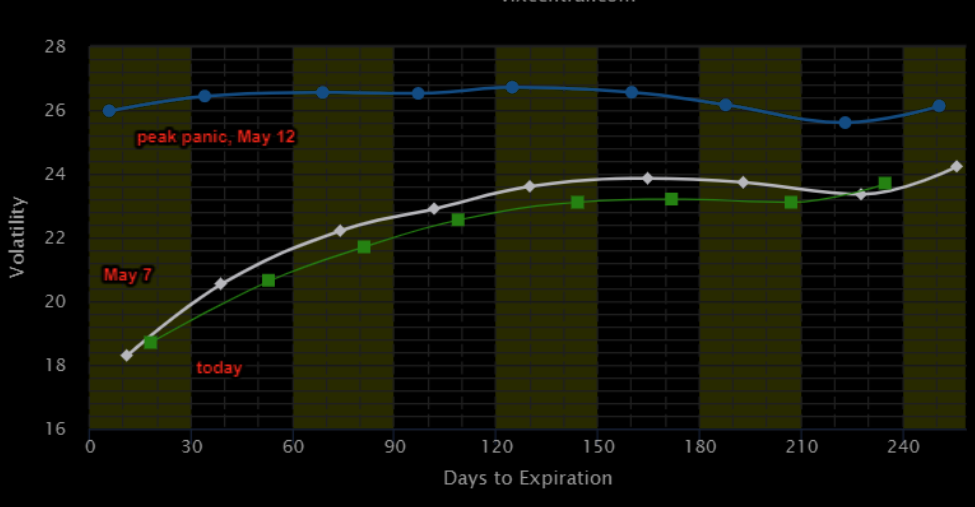
- The Market Ear – The panic to puke VIX – The entire VIX term structure is basically back to how it looked on May 7, the low close of VIX pre the most recent panic. Note the “evolution” from May 7 to the most recent panic highs on May 12 and the current structure. We have seen extreme moves across the entire VIX vol structure. Nothing is moving, but the short end of the VIX curve is becoming rather “depressed“.
Then came the “hammer candle” observation:
- The Market Ear – VIX – was that the low for now?VIX loves making local lows with the similar type of psychology candles, the classical hammer candle. You do not trade VIX based on charting, but after epic moves lower in VIX, these type of days like we saw today are to be observed closely. As we outlined earlier today, VXHYG reversed two days ago already, and the little late gap vs VIX should come in as the natural low for VIX here.
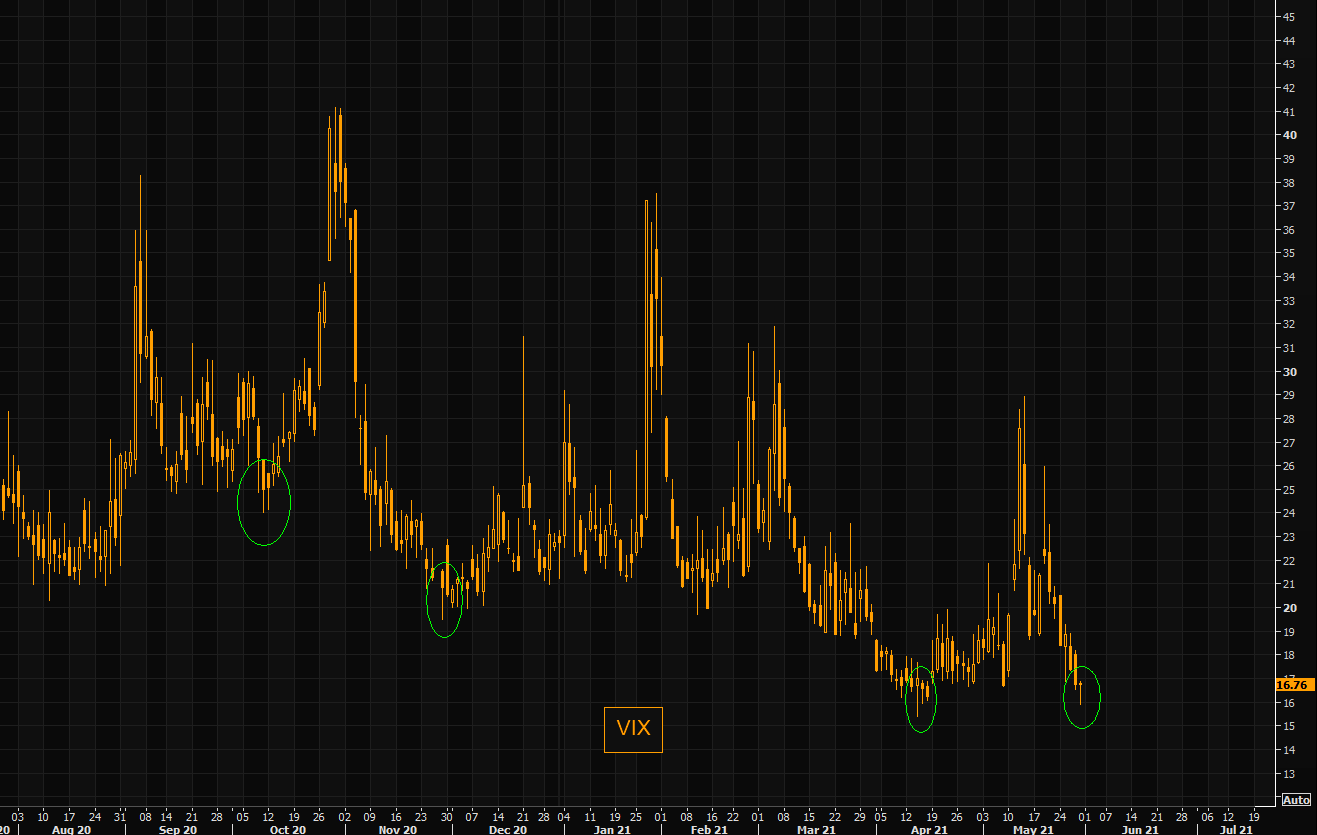
VIX closed at 16.76 on Friday just above the 16.69 low three weeks ago on May 7. And Monday is a holiday for exchanges. Mean anything?
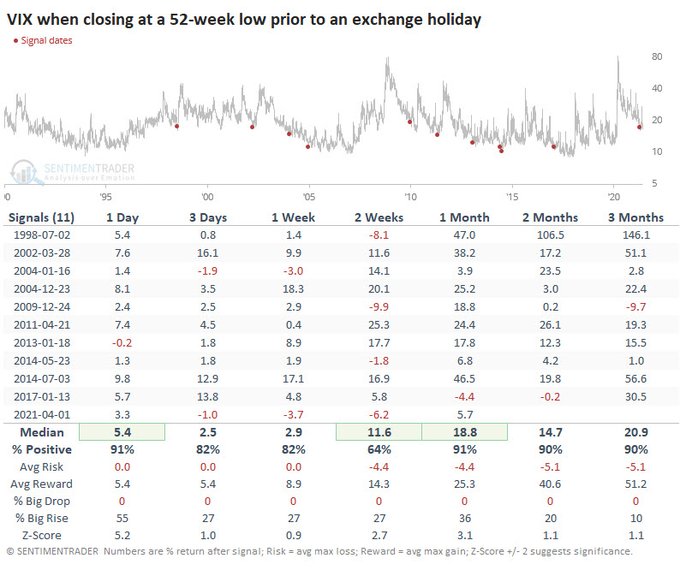
- SentimenTrader@sentimentrader – Volatility event ahead? There have been 11 other times when the #VIXclosed at a 52-week low ahead of an exchange holiday. It jumped an average of 25% at some point during the next month when traders (and volume) returned.
Given this conflict between gurus, how can simple folks decide? Lawrence McMillan of Option Strategist gave one way in his Friday’s article:
- “In summary, there are still some conflicting signals (confirmed buys and sells) as $SPX deals with the fact that it’s still in a trading range. A breakout above the top of the range would be very bullish. However, there is still the possibility that the resistance at or just above current levels will hold. We continue to wait for $SPX to break out of this 4060-4238 trading range.“
When might some one say something to break this range? June 16th perhaps, either in the FOMC statement or in the Powell presser?
2. Interest Rates
The real action in Treasury rates was on Friday. Rates arose initially after the numbers at 8:30 am, numbers that were hotter than expected:
- Brian Chappatta@BChappatta – PCE: higher than even the quite high estimates. Headline PCE y/y: 3.6%, est. 3.5% Headline PCE m/m: 0.6%, est. 0.6% Core PCE y/y: 3.1%, est. 2.9% Core PCE m/m: 0.7%, est. 0.6%
But then rates began to give up gains & went negative by early afternoon to close about 2.7 bps lower in long duration maturities. The rest of the curve was ho-hum for the week except for the 30-year which closed down 2.4 bps on the week.
One reason might have been:
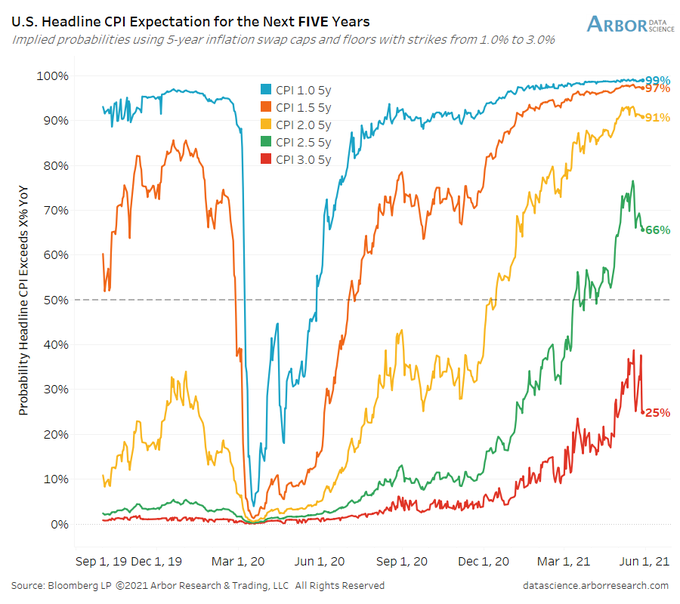
- Ben Breitholtz@benbreitholtz – Inflation tail risk has stumbled a bit since mid-May. Inflation swap caps/floors implying a diminished 66% probability headline CPI averages above 2.5% YoY over next 5 years.
Another reason might be what Blackrock’s Rick Rieder highlighted couple of months ago that the Treasury was going to send $800 billion in cash to the Fed at the same time when the Fed was caught in a markets-DemPols pincer about the “Supplementary Leverage Ratio”.
Did anything happen on Thursday? Institutions placed a record $485 billion in cash on Thursday at the Federal Reserve’s overnight reverse repurchase facility. We urge all to read the Bloomberg article by Brian Chappatta titled “The Fed Is Mopping Up Its Own Mess in Reverse Repo“. He elaborates:
- “… it’s overwhelming some of the biggest U.S. banks. They don’t want any more reserves because it means they need to hold more capital, but that’s exactly what happens when the Fed is adding so many assets to its balance sheet (reserves at the Fed are the offsetting liability). … So, naturally, the only thing left for primary dealers to do was to scale back on their Treasury holdings … :“
Chappatta explains that large institutional money market funds are placing their cash balances with the Fed at 0% interest rate because that, actually is the better option. Why is this a better option? Chappatta explains:
- “As Bloomberg News’s Alex Harris reported on Thursday, the going rate on overnight general collateral repurchase agreements opened at -0.01%, and the bid-ask spread was 0%/-0.2%, making the decision to go to the Fed something of a no-brainer. …. In the secondary market, bill yields are sometimes negative. With choices like that, a 0% overnight rate at the central bank makes the most sense.”
If that is not enough, look what he tweeted on Friday:
- Brian Chappatta@BChappatta – While we wait for the next RRP numbers, here’s an insane stat from a reader: Federal Home Loan Banks auctioned 4-week discount notes yesterday. Stopped at… -0.001%. Can’t go below zero in T-bill auctions, but elsewhere we’re learning it’s fair game? fhlb-of.com/ofweb_userWeb/
A Federal Agency paper auctioned at a negative yield? And the yahoos keep talking on Fin TV about a “taper”?
There is already a flood of money coming into money market funds from nervous investors & from these funds into the Fed. What if we get a reasonable stock market correction & investors sell, what would that influx of cash to do the Fed’s reverse repo? Why do you think the 2-year & 5-year Treasury auctions got so much demand?
Now in this mess, the Fed is going to reduce its Treasury purchases? If they do so at the shorter end, they almost have to buy the same amount at the longer end? Can you spell Yield Curve Control or a Twist? So should we cry or laugh at this utter mess?
We prefer to laugh & sing in both versions:
And the Bollywood version:
Now comes the crying, beginning with a gulp:
- Liz Ann Sonders@LizAnnSonders – Homes under construction and reaching completion have quickly rolled over @DataArbor @uscensusbureau
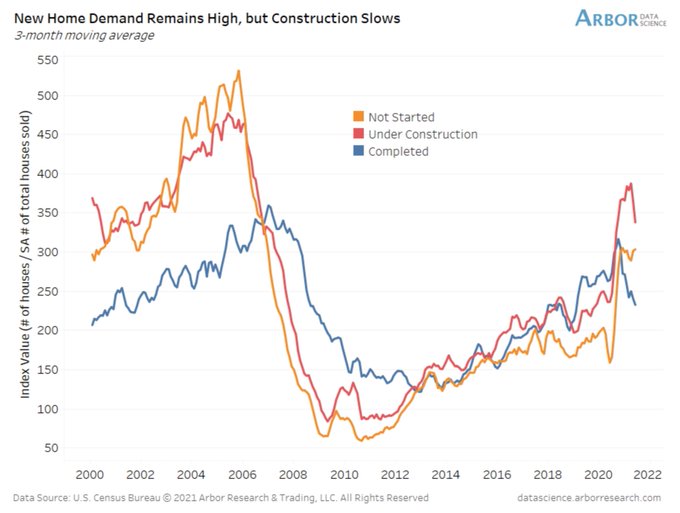
Then a scary look ahead courtesy of Tom McClellan’s article Real Estate Boom in 2021 is Fueled By Demographics:
- Those echo boomers who were born in 1988-92 are now 29-33 years old, just now arriving at that sweet spot of initial home buying interest in a big wave together. So no wonder there is a big squeeze on “starter homes”, as the bulge of Echo Boomers are all competing with each other for the available supply. This is a squeeze that is likely to fizzle out in a few years on its own.
- All of the Echo Boomers who are chasing the market right now and bidding up starter homes are eventually going to want to sell those starter homes, so that they can try to upgrade to that 5-bedroom McMansion. When they reach that point, they are going to be frustrated to find a much smaller market of first time home buyers into which they can hope to trade-in those starter homes.
Now tears of fear from someone utterly misnamed as “Rosie“:
- “The U.S. housing market is in a massive price bubble. Maybe this is what has the Fed reticent about ever moving away from its current super-accommodative policy setting. The ensuing asset deflation from the mean-reversion implosion in residential real estate price declines promises to be spectacular.“
3. Commodities, India, Brazil & Larry McDonald
Listen to this podcast, we suggest.
- MacroVoices Podcast@MacroVoices – May 27 – MacroVoices @ErikSTownsend and @PatrickCeresna welcome @Convertbond from @BearTrapsReport to the show to discuss inflation, bond yields, market outlooks, and much more. bit.ly/3hZZMbY
Commodities came back this week with CLF up 11.8%, Copper, Gold, Silver & Oil all up. Speaking about reopenings & commodities, look what Larry McDonald said in the above podcast:
- “Well, the big thing is the reopening. So India a month ago was in a horrific COVID cycle. And now, cases are crashing in India, crashing in Europe. We’re going to have much better vaccine distribution in India. India is a colossal diesel fuel user, oil user. You’re talking about 6% of the global consumption up from 3% maybe eight or nine years ago. So in growing fast, I mean, India population is growing three times faster than the European continent or I should say more. So Germany and Italy for example. So you’re talking about 1.4 billion people that’s growing at a very strong clip and you’re talking about a large group of people that are still vastly addicted to diesel fuel and oil. And so this sets up for with vaccine distribution with a much better situation in Europe in terms of reopening and vacations.”
What does this mean for or because of ESG? LarryM said:
- “I talk to a lot of bankers in our chat and our Bloomberg chat and institutional chat and around the world. And it’s just the ability of coal companies and shale companies to finance projects has just collapsed. And this the snapback in the United States, the United States has lost the control of the production snapback, and that’s going to put more price control in the hands of the Saudis and the Russians, and they’re just going to drive. You know, I think we can have $100 oil and much higher coal prices over the next 12 months. Especially in the ESG side on coal, because coal, met coal is the steel producer of the world right now. I mean, we’re years and years or years away from hydrogen produced steel. So you’re talking about companies like coal, ARCH coal A-R-C-H, that I think would be a double over the next 12 months trading at three and a half times EBITDA. Dividend increase probably coming by year end. So we’re looking at, we have a basket of what we call our ESG backfire basket and that’s kind of the focus of it is, is energy, oil, and coal.”
And even a better trade from his vantage point is buying Uranium ETFs with the entire Uranium market cap being $21-22 billion.
Before all that, the big question is what President Biden does with Fed Chairman Powell. That might be a good indication of how much the Administration wants to spend before the November 2021 election.
Send your feedback to editor@macroviewpoints.com Or @MacroViewpoints on Twitter