Summary – A top-down review of interesting calls and comments made last week in Treasuries, monetary policy, economics, stocks, bonds & commodities. TAC is our acronym for Tweets, Articles, & Clips – our basic inputs for this article.
Editor’s Note: In this series of articles, we include important or interesting Tweets, Articles, Video Clips with our comments. This is an article that expresses our personal opinions about comments made on Television, Tweeter, and in Print. It is NOT intended to provide any investment advice of any type whatsoever. No one should base any investing decisions or conclusions based on anything written in or inferred from this article. Macro Viewpoints & its affiliates expressly disclaim all liability in respect to actions taken based on any or all of the information in this article. Investing is a serious matter and all investment decisions should only be taken after a detailed discussion with your investment advisor and should be subject to your objectives, suitability requirements and risk tolerance.
1.Trends Continue!
VIX, the signal that has shown us the way all year, was up from Monday to Thursday with a 18.85% rocket move up on Wednesday, August 18. How did this look on Thursday, August 19:
- jeroen blokland@jsblokland – Aug 19 – Another #VIX spike! But as the chart reveals, periods of elevated #volatility have been very short and the magnitude of the spike has come down over the last 18 months or so. Is this time different?
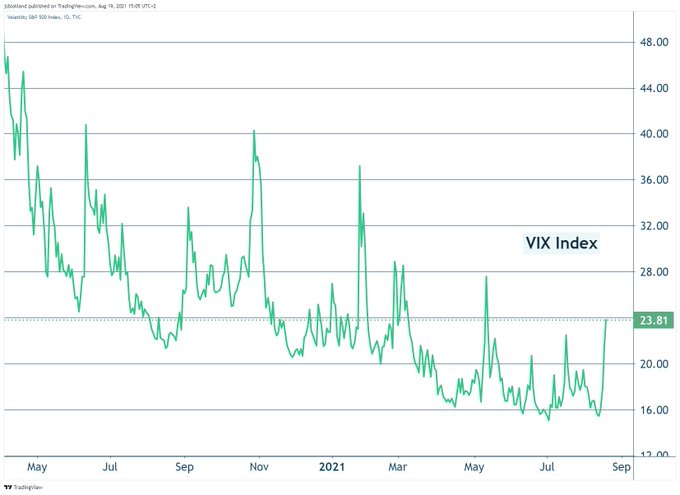
Nope, said the VIX and dropped 14.6% on Friday to close at 18.50. Does that mean what we think? Indeed as Lawrence McMillan of Option Strategist wrote in his Friday summary:
- “The $VIX “spike peak” buy signal of July 20th was nearing its 22-day “expiration date” this week, when it was stopped out on August 18th, by the fact that $VIX returned to “spiking mode.” Now, just one day later, a new $VIX “spike peak” buy signal has been confirmed.“
- “So, we have mixed signals, accurately reflecting the dichotomy between the strength of $SPX and the weakness of the “average” stock. We will trade confirmed signals in either direction, within the proviso that the overall “core” position should remain bullish as long as $SPX holds above support at 4370.”
VIX is one trend. What is the other?
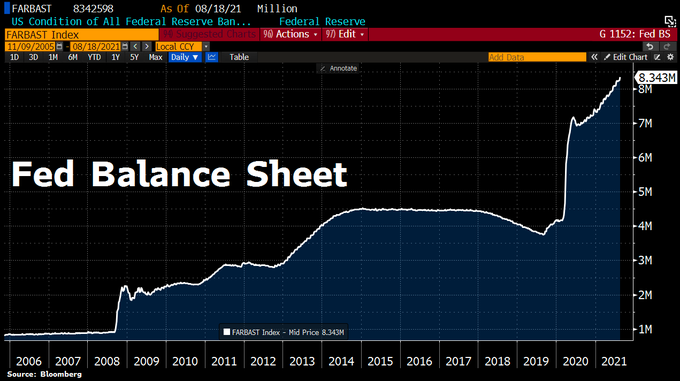
- Holger Zschaepitz@Schuldensuehner – Aug 19 – #Fed expanded its balance sheet sharply. Total assets rose by another $85.4bn to a record $8.34tn as Powell keeps printing press rumbling. Total holdings of US securities up $101.01bn mostly due to surge in mortgage-backed securities. Balance sheet now equal to 37% of US’s GDP.
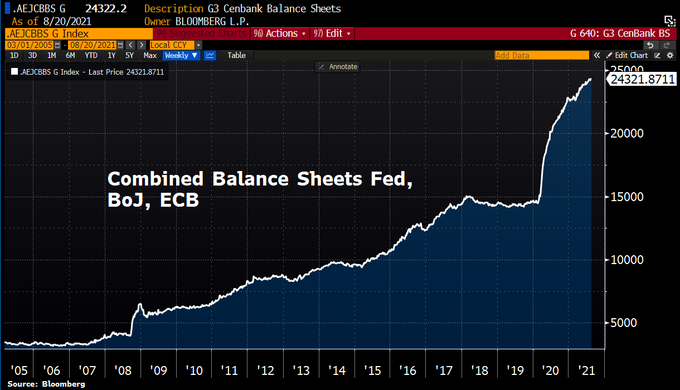
Not just the Fed:
- Holger Zschaepitz@Schuldensuehner – As long as the music is playing, you’ve got to get up and dance! Combined balance sheet of G3 CenBanks has hit fresh ATH this week at $24.3tn.
Given this, you would expect the sentiment to be greedy or at least positive right? But Sentimentrader.com says the opposite:
- Fear in force. The Fear & Greed model plunged to its lowest level in a year on Thursday. Investors have been increasingly less enthused about stocks as they’ve rallied in recent months…but be careful about simply interpreting this as a knee-jerk contrarian would. This also happened in 2015.
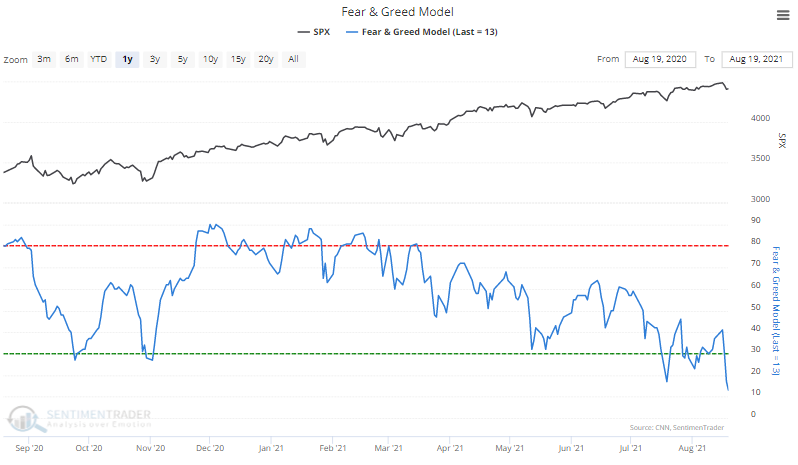
This got the attention of one who has been right since March:
- Macro Charts@MacroCharts – Everyone with a foot out the door… Again.
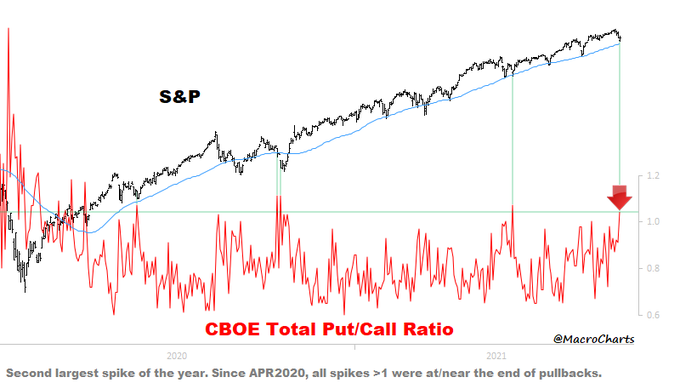
Amazing isn’t it? The S&P closed at a new all-time (5 straight new highs, by the way) on this past Monday. What does it mean to get a new all-time high when consumer sentiment is so bad? Sentimentrader.com told us:
- “Assuming the S&P doesn’t completely fall apart in the coming weeks, this month’s reading would be the 2nd-lowest all-time for any month when stocks closed at a 12-month closing high. Only December 1991 would have a lower reading. A low Consumer Sentiment reading during a month when the S&P closed at a new high tended to be a good sign.”
Ok then! Does that mean the really oversold might actually bounce?
- The Market Ear – Russell’s RSI – Last time Russell futs traded in the lower part of the range and RSI was this low,small caps decided reversing violently higher. Is this time different, or do you buy the dip?
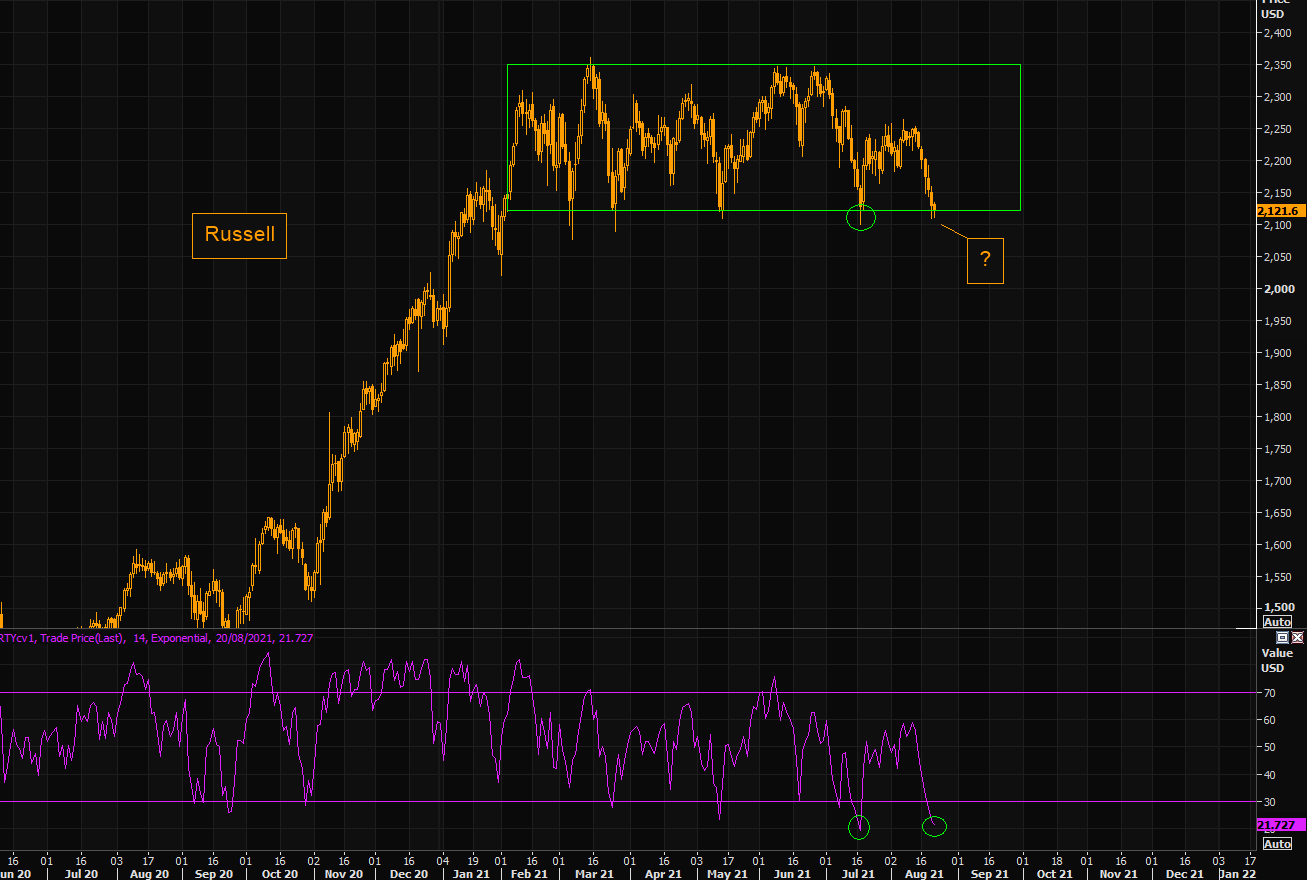
Wouldn’t that be perfect for Tom Lee’s rally call for next week?
2. On the other hand,
Does the NDX have to fade some to get Russell 2000 up? It could be a coincidence but Tom McClellan warned on Friday about Waning Number of NDX Stocks In The Uptrend:
What was his commentary?
- “It is reasonable to examine each of these example divergences, and note that the bigger and hairier ones tended to result in more significant declines. The 2000 divergence is a great example, and so was the one in 1998, when global currency crises eventually came around to bite the US stock market in August 1998. The current divergence now in 2021 is a gentler one, so perhaps not foretelling great calamity this time, but still saying that the energy of the advance has been waning, and setting up for a decline of some kind.”
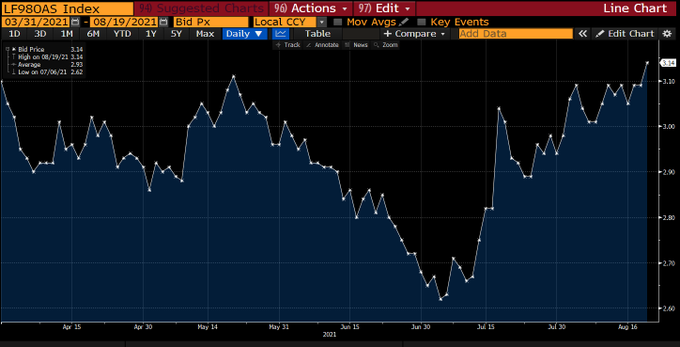
Also credit is not singing a very happy tune:
- Lisa Abramowicz@lisaabramowicz1 – The U.S. high-yield bond market, once considered a leading indicator for risk assets more broadly, is showing a greater degree of caution than earlier in the year. Relative yields on the debt have risen to the highest since March.
And this credit back-up is happening as Treasury yields are going down?
- This week, the 30-year yield fell 6.8 bps to 1.869% or below 1.9% level; 20-yr yield fell 4.8 bps to 1.787% breaking the 1.80% level. Fortunately the 10-year yield at 1.255% still remains above the double bottom of 1.22%. And TLT rose 1.2% on the week (EDV up 1.8%) as the S&P fell 50 bps and the Russell 2000 fell 2.5% on the week. with Micro-caps IWC down 3%.
Is this mainly Delta fears or is the economy going down as Rosie had predicted it would after July?
3. But a more hopeful sign?
The U.S. Dollar ETFs were up 1% this week and you can’t get worse news for global financial conditions. But that may be about to change as Carter Worth of CNBC Options Action said on Friday:
The dollar is pressed for a pullback but there’s one shining opportunity overseas, says @CarterBWorth of @csm_research. The traders give their takes on $EEM pic.twitter.com/6RtH64XeEr
— CNBC's Fast Money (@CNBCFastMoney) August 20, 2021
Tim Seymour of Fast Money actually recommended buying INDA, an India ETF and Nadine Terman recommended shorting EEM against long INDA. Coincidentally a Bloomberg article pointed to the reason, the same reason why S&P has been rallying all -year:
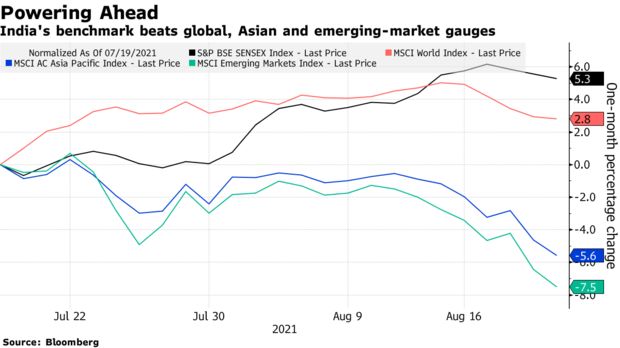
- The Reserve Bank of India is helping to fan a world-beating share market rally with record-low interest rates and huge injections of liquidity — even as inflation threatens to break back out of its target range.
- Investors are betting the easy money won’t end anytime soon, with central bank Governor Shaktikanta Das keeping a lid on dissent as he nurses the economy back from its pandemic lows.
- “The market is fueled with liquidity, which will absorb a fall, if any,” said Ashish Chaturmohta, director of research at Sanctum Wealth Management Pvt. in Mumbai. “Enough money has been pumped in to support the economy and many sectors are seeing continued growth with great future prospects.”
- “Even as Asian stocks have witnessed a broad selloff this week — the MSCI Asia Pacific Index has lost more than 4% — the Sensex is down just 0.2% for the period.”
Carter Worth also recommended buying Gold and GDX, the Gold Miner ETF. But what about the worst acting commodity? Oil was down 8% this week & Brent down 7%. And OIH, the Oil Services Holder, was down 8.5% this week. But per Stat Box from Sentimentrader.com,
- “Energy ETFs like XOM and XLE have declined for 6 consecutive days, tying their longest losing streaks since the pandemic crash. The few other 6-day streaks all preceded at least short-term bottoms, so watch for a change in character.”
And,
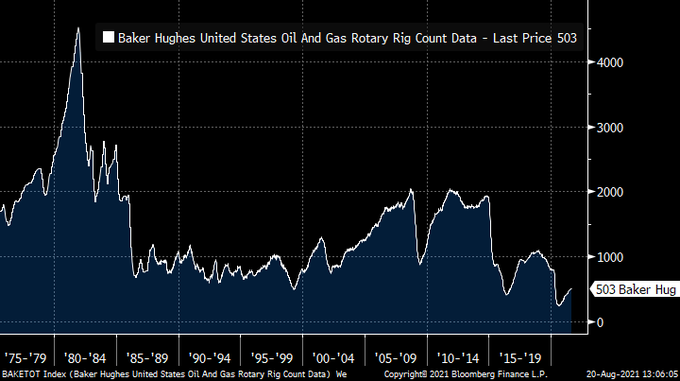
- Richard Bernstein@RBAdvisors – US #rigcountrising but unlike most other economic statistics it remains well below historical norms. If the global #economy continues to expand#oilprices will likely go up.
But what about the real fundamental?
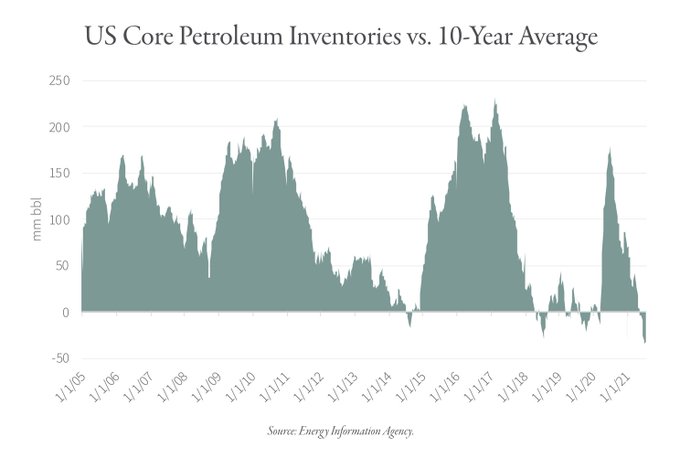
- Goehring & Rozencwajg@Go_Rozen – Aug 19 – After peaking at 178 mm bbl above 10-year seasonal averages, US core petroleum inventories are now significantly below their 10-year averages – the lowest reading in nearly two decades. Blog: hubs.li/H0VzRNm0#energy #stocks #oil #commodities
Send your feedback to editor.macroviewpoints@gmail.com Or @MacroViewpoints on Twitter