Editor’s Note: In this series of articles, we include important or interesting videoclips with our comments. This is an article that expresses our personal opinions about comments made on Television and in Print. It is NOT intended to provide any investment advice of any type whatsoever. No one should base any investing decisions or conclusions based on anything written in or inferred from this article. Macro Viewpoints & its affiliates expressly disclaim all liability in respect to actions taken based on any or all of the information in this article. Investing is a serious matter and all investment decisions should only be taken after a detailed discussion with your investment advisor and should be subject to your objectives, suitability requirements and risk tolerance.
1. Bernanke-Yellen – Deja Vu all over again?
Remember the curve steepening of 2013? Bernanke shocked the bond market on May 22, 2013. The Bond market never forgot that. After that day, the long end of the bond market began selling off as soon as Bernanke began any Q&A session before any audience.
That’s essentially what we are seeing today but in the short end of the yield curve. Dr. Yellen shocked the bond market with her “6 months” comment on March 19, 2014. The short end has not forgotten that despite all her attempts to walk that comment back. That is what we saw this week. CNBC’s Steve Liesman pronounced after Dr. Yellen’s Q&A that the Fed had walked the “6 months” comment all the way back. The yield curve begged to differ.
The 5-year yield jumped 3.3 bps on Wednesday afternoon while the 30-year yield fell by 1 bp, a 4.3 bps flattening in the 30-5 yr curve. The entire curve rose in yield after a strong Philly Fed number with the 5-year yield jumped 7.6 bps and the 30-yr yield rose by 6.4 bps. As of Thursday’s close, the 30-5 year curve has flattened by 44 bps to 179 bps from 223 bps on December 31, 2013 – a 20% decrease.
The bond market is mocking Dr. Yellen’s “forward guidance” message and serving notice that it believes her “6 months” comment more than any verbal gymnastics the Fed might attempt. And that it will flatten the yield curve on any stronger than expected economic data. Note that the 3-year yield crossed 90 bps on the upside on Thursday. Is 1% on the 3-year that far behind?
And this is happening while the economy is “losing its growth drivers” according to Robert Brusca:
- “we have lost increase in housing prices, the housing market is slowing; we have no increase in wealth beyond the stock market and …. job growth hasn’t picked up and wages are flat“
Tell it to the 5-year Treasury, Mr. Brusca.
And what about the U.S. Dollar? Thursday morning’s tweet & cartoon from Hedgeye tells it well:
- Hedgeye @Hedgeye – Today’s @Hedgeye Cartoon: Weak in the Dollar app.hedgeye.com/
unlocked_conte nt/34886-cartoon-of-the-day-weak-in- …the-dollar
$UUP @federalreserve #JanetYellen pic.twitter.com/Uzl0099Jbm
2. US Treasuries
David Rosenberg wrote that “long duration bonds are an accident waiting to happen“. Could that accident happen simply because so many people are now bullish on Treasuries? We saw two well written articles this week with cogent analysis explaining the action of the Treasury market in 2014. The second is Wednesday’s article from GaveKal titled Update On The Taper Through The Lens Of Bond And Stock Performance. It tells the story via charts. The first is Monday’s article by Vince Foster on Minyanville titled Why Long-Term Interest Rates Are Falling and May Continue to Drop. Foster tells it succinctly:
- “the massive reserve growth coincided with the steepest yield curve in history. Conversely, as this reserve growth peaks, so too should the slope of the curve. … the yield curve is responding more to the level of accommodation, and any reduction should produce a flattening bias and a headwind for the shorts. …As the Fed removes stimulus, the market is reducing the inflation premium embedded in the yield curve.”
What bothers us is the timing of these well written & smart articles. We don’t recall seeing such articles in December or January. The past 3.5 months have featured steady dose of weaker than expected data. When does the worm turn? When do the expectations of weak data get so priced in that an uptick in data causes convulsions in the bond market? Is the reversal in the long end on Thursday a sign of what may come?
We don’t know, of course. But we do know we don’t like seeing articles that tell us Foreigners Flocked To US Treasuries In February.
3. Equities
That was some sell off on Tuesday morning. It felt like an emotional liquidation. And it reversed almost on a dime and ratcheted up. The action in the Nasdaq from about 1 pm on Tuesday to the close on Wednesday was breathtaking. Veteran trader Laurence Altman tweeted early Wednesday morning:
- traderxaspen ?@traderxaspen – Important to acknowledge yesterday’s extreme volatility. Could signal a short term Low daily stochs crossed positive in nasd sp buy dips
Art Cashin apparently agreed on per the following tweet on Wednesday morning:
- Barry Ritholtz ?@ritholtz – CASHIN: Morning action seems to support the contention in today’s Comments that yesterday’s solid reversal may have ended selloff
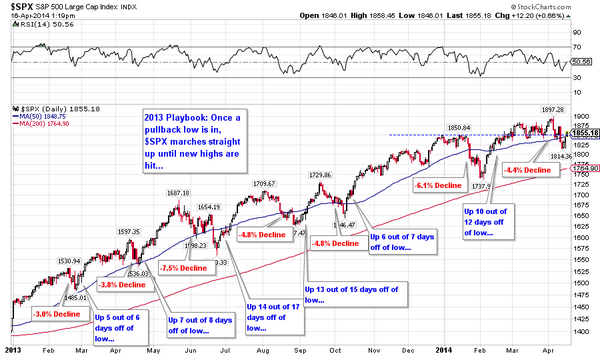
If Tuesday was indeed a low, then most important question becomes:
- Charlie Bilello, CMT ?@MktOutperform – Remember the 2013 playbook. Once a low is in, $SPX marches straight up to new highs. Will it happen again? pic.twitter.com/HXeOlnFLGM

Negative answers came from the following:
- the market’s reaction to Chipotle’s & Intel’s positive earnings & IBM’s & Google’s negative earnings
- Wednesday 4/16 morning – Traderxaspen ?@traderxaspen – I still think a much larger correction will unfold patience!!
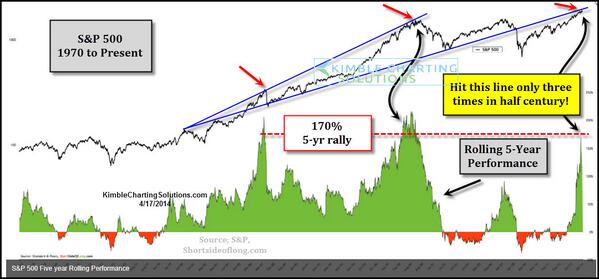
- Thursday afternoon – Kimble Charting – Chris Kimble – only in 1987 & 2000 was this reached, until now! $SPY $IWM $QQQ $STUDYhttp
://stks.co/t0DnE –StockTwits @StockTwits This has only happened twice before, both times followed by significant downside—> http://stks.co/e0SAr $SPX pic.twitter.com/3ehQ4Pf5Q6
Positive answers were from:
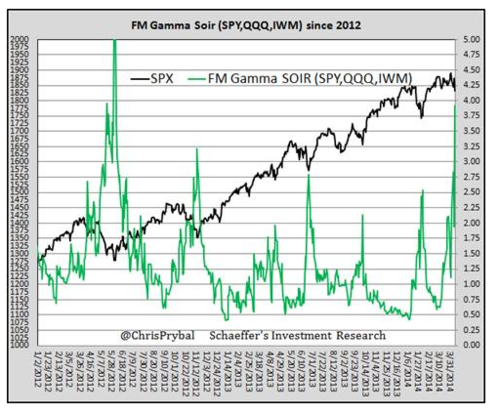
- Monday – Ryan Detrick – “Going back the past 40 years, the SPX has bottomed on exactly April 14.
That is today if you lost your calendar. Now, most years April is also
higher at this point though. Still, things usually bottom now and
rally till the end of the month. … We’ve seen a huge spike in puts in front month ETFs, the most since
mid-2012! If you think investors get worried and load up on ETF puts
when they get scared, you like seeing this. Plus, previous spikes have
nailed some major bottoms. Could it be right again?”

and from,
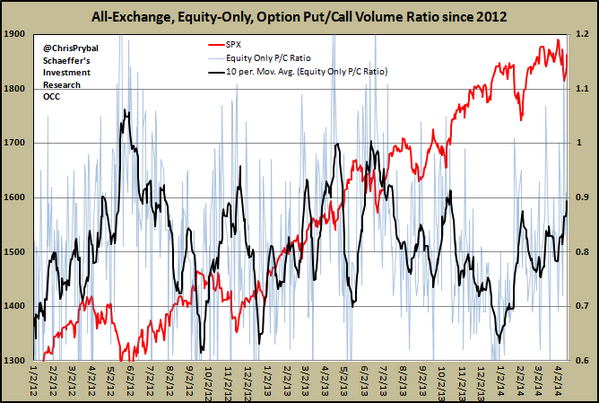
- Friday afternoon – Chris Prybal @ChrisPrybal – New 2014 high in the All-Exchange, Equity-only, Put/Call option ratio (10-day average). Historically bullish – pic.twitter.com/Ze1in6vKao

What about seasonality?
- Tuesday 4/15 afternoon – Ryan Detrick, CMT @RyanDetrick – Yr 2 of Prez cycle is the worst year from May-Oct! Also only one with neg returns. Be aware. $DJIA stks.co/e0RbK
- Bloomberg article on Wednesday – Stumbling S&P 500 Reaches Worst Stretch of Election Cycle
What about sentiment & positioning?
- Elliott Wave Int’l ?@elliottwaveintl – Indicators registering extremes in optimism just keep coming. Retail investors are now more committed to the markets Urban Carmel @ukarlewitz – Active managers (NAAIM) 76% long. Remarkably, their long skew is now highest of 2014. Most bearish mgr is flat; most bullish is 167% long
4. Gold
Gold was slammed early morning on Tuesday and never recovered. It was a major event according to Tom McClellan as he wrote in his article Gold’s Cycle is in Left Translation:
- “On the “blood red moon” day of April 15, gold had an impressive downturn which changed the whole picture for gold prices over the next few months.”
- “About every 13-1/2 months, there arrives what I like to call a “major cycle low”. Those tend to be the more important cycle bottoms, and the next one is due in July 2014, plus or minus a month. So between now and around July 2014, we can expect the normal sort of decline that is associated with price behavior leading into a major cycle low.”
- “Seeing the left-hand peak higher than the right-hand peak is called “left translation”, and it is a bearish message about the future. It says that the price ought to be expected to dip below the level seen at the mid-cycle low. The sad news for gold bugs is that this is the situation we are seeing right now. ”
- “Gold futures prices turned down after peaking on April 14 at $1331/oz, well under the $1420 level, and indicating a left translation condition. This is the 3rd cycle in a row with left-hand translation, meaning that gold as not yet broken out of its bearish chart configuration.”
- “For now, the expectation is for a decline to take out the levels of the December 2013 lows, which were around the $1190/oz level (depending on which contract one looks at). That’s a pretty big decline from here, and not likely to end until the arrival of the major cycle low due in July 2014.”
On the other hand, Richard Ross of Auerbach Grayson considered the big decline as a buying opportunity:
- “There are some signs that make gold very attractive at these levels,” said Ross. “I’m not a gold bug per se but I do like a nice chart and I think that’s what we can see here with gold. It has a lot of things in its favor”
- “In addition, the 200-day moving average is sloping higher,” said Ross. “That’s telling us both our short-term and longer-term trends are turning higher“
- “Ross thinks gold is headed toward a resistance level of $1,420 per ounce, though he sees a rocky road toward that level”
- “It’s not going to be a straight shot,” said Ross. “Every time we get a little head of steam, we pull the rug out from underneath us in gold. But, I still think it’s a good place to be as we transition from a period of strong seasonality in stocks into one of weak seasonality through the summer months”.
5. “Crowded, Lonely & Trapped Trades“
is the name of this week’s report from Michael Hartnett of BAC-Merrill Lynch. He reports of a “first outflows from floating rate funds (albeit small) in 95 weeks; big rotation from US growth to US value funds past 4 weeks; big unwind of “liquidity trades” post March FOMC.”
His crowded trades:
- “10-year Italian bond yields fell to lowest level since 1945,
while US IG corporate bonds hit all-time highs. April Fund Manager
Survey shows European peripheral and US HY bonds are today’s “crowded trades”. And flows show MLPs and Floating Rate Notes are very “crowded trades”
And Lonely, Trapped trades?:
- “Flows, CFTC data and the Fund Manager Survey indicate commodities
are the loneliest trade. Meanwhile markets subject to capital controls
and sanctions have surged as domestic liquidity is trapped (Chart 1), a
bullish argument for Russia”
His chart below of Trapped Trades did surprise us:
Source: BofA Merrill Lynch Global Research, Bloomberg
Send your feedback to editor@macroviewpoints.com Or @MacroViewpoints on Twitter
