Editor’s Note: In this series of articles, we include important or interesting tweets, articles, videoclips with our comments. This is an article that expresses our personal opinions about comments made on Television, Tweeter, and in Print. It is NOT intended to provide any investment advice of any type whatsoever. No one should base any investing decisions or conclusions based on anything written in or inferred from this article. Macro Viewpoints & its affiliates expressly disclaim all liability in respect to actions taken based on any or all of the information in this article. Investing is a serious matter and all investment decisions should only be taken after a detailed discussion with your investment advisor and should be subject to your objectives, suitability requirements and risk tolerance.
1. Iraq – When Governments Panic
The old monetary tenet says when “Central Banks panic, investors can stop panicking“. Thinking laterally, we apply that tenet to the meltdown in Iraq. The spectacular win in Mosul by ISIS (the new Al Qaida plus or Islamic State of Iraq & Syria) and the utter meltdown of the so-called Iraqi army in Mosul stunned every government. The immediate assault on Tikrit and Samarra in their march on Baghdad literally sent panic through both America and Iran. Come Friday morning, we had seen reports of a company of Iranian Republican Guards supporting the Iraqi Army in Baghdad, reports of Kurdish Peshmerga forces capturing the strategic oil city of Kirkuk, and reports of revered Grand Ayatollah Ali-Sistani exhorting the Shia faithful to fight the Sunni ISIS.
There were reports of President Obama seriously discussing the possibility of both launching air-strikes and providing air support to Iranian Republican Guards fighting alongside Iraqi army. Just that this possibility was being discussed was the best indication of the level of panic in Tehran & Washington DC let alone Baghdad. This panic was mirrored on Financial TV on Friday morning.
So we stopped panicking. We felt that the Iraq panic had reached a crescendo and that the near term reality was likely to be a consolidation calm. So we put on our Demark-like trend exhaustion cap and announced to a Fin TV show that a peak in panic had been reached. After all, when major Governments panic, investors & folks should stop panicking.
By pure coincidence, the stock market began rallying just after 10:00 am and stayed positive for most of Friday.
What next? If we are indeed correct and the situation remains in control, then will the stock market begin rallying as it has after every major crisis from August 2012 onwards? Will it get back to new all time highs? Or will this time be different? We know that Draghi is much stronger than Al-Baghdadi and he is all systems go. Will his friend in policy Janet Yellen remain an unflinching ally next Wednesday when she speaks? Or will she provide a negative surprise as BoE Governor Mark Carney did on Thursday from London?
We will know on Wednesday.
2. Volatility
We have been writing about volatility for the past three weeks. It kept trending down without any guru or champion saying buy it. Until this Monday, June 9:
- J.C. Parets @allstarcharts – NEW POST: Long Volatility Right Here http://stks.co/r0Pbo $VIX $VXX
The basic message of his Post was:
- We’re looking at a daily candlestick chart of the $VIX going back a couple of years. Last time we were down here, Volatility spiked 23% in a few days and over 60% in less than a month. I think we can see something very similar. I just like the price behavior, so I wanted to point out what I’m seeing. I hope this helps.
Did it help? VIX closed at 12.56 on Thursday, a jump of 16.5% over last Friday’s close of 10.78. It did fall by about 4% to close at 12.03 on Friday. What did Mr. Parets say on Friday afternoon?
- J.C. Parets @allstarcharts – you have to be pleased with the action in volatility this week. closing week on solid note looks like. Next week could get interesting $VIX
He might have been lonely in recommending buying volatility on Monday. But by Friday he had lots of company at least on CNBC. As Jeff Kilburg said on CNBC Power Lunch on Friday “we like owning volatility“.
But the stunningly low level of the VIX does not suggest that a major market top is imminent, as Tom McClellan tells us in his article VIX Below 12!
- “when the VIX gets really REALLY low, the message changes. Sure, it is a sign of an absence of worry, and a correction is possible. But the really big price tops do not appear when the VIX is this low. In 2000, the SP500 topped after the VIX had climbed up from the really low levels of a few years earlier. The final price top came when the VIX was at 16.54. In 2007, the SP500 again topped with the VIX above 16. It had been much lower earlier that year, bottoming below 12 in April 2007 well in advance of the final price high. This is a consistent theme.”
- “The real trouble for short term price movements typically comes when the VIX rises up above its 50-day moving average (50MA). Seeing the VIX go this low is NOT the sort of condition consistent with the major tops of the past“
3. Treasuries
The 30-year auction on May 8 created a spike down in TLT and a spike up in yields. This month, the reverse happened. The 3-year auction on
Tuesday and the 10-year auction on Wednesday had been disappointing.
Yields had been rising all week and treasuries looked weak until the 30-year auction at 1 pm on Thursday. Then? Just look at the chart below:
Look at the vertical rally in TLT at 1 pm and the spike in volume – a vivid picture of the shock and awe of this auction. 30-year Treasuries rallied by 1% in price on Thursday. This action should have continued on Friday but for the stunning surprise delivered on Thursday evening by Mark Carney who told investors that the Bank of England could raise rates sooner than they expected. This was obviously negative for the short end of the Treasury curve. The 30-Year however closed virtually unchanged.
The 30-year yield was the only one that closed down for the week, down by 3 bps. The 10-year yield closed flat for the week. In contrast, the 3-year yield closed up by 10 bps and the 5-year yield closed up by 4bps. Can you spell flattening?
Jeff Gundlach told his investors on Tuesday that the 30-year yield will be lower between now and year-end. But David Rosenberg continues to argue that Treasury yields are too low, almost bubble-like low.
On Tuesday May 13, J.C Parets had tweeted:
- J.C. Parets ?@allstarcharts – it’s funny, now that everyone has come around to the bond trade (too little too late), I think rates get a little bounce & I sold bonds $TLT
He is backkkk… , it seems. Because on this Friday we saw,
- J.C. Parets @allstarcharts – Been talking about treasury bonds this week for a reentry point. I like them. $TLT we can be long all day above this week’s lows $ZB_F
Last week, we quoted GaveKal about kicking European Banks into leaving the safety of the ECB:
- “By moving to impose negative deposit rates, the ECB is instituting a tax on banks holding excess reserves. … So, where then do European banks part their excess reserves to avoid being kicked? If the last few years is any guide, some may end up in the US banking system via European banks intra-company transfers in order to earn the 25bps the Fed is paying”
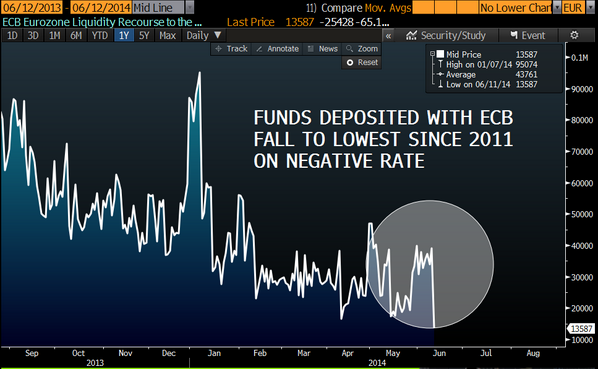
Is there any evidence that reserves at the ECB are actually going down?
- Thursday – Paul Gordon @pgordon66 – Cash Deposited at #ECB Plunges as Negative Rate Takes Effect

So where will this cash go?
- Wednesday – PIMCO @PIMCO – Gross: With German 10-year yields at 1.35 and relatively inert, they act as a magnet to bring U.S. Treasuries lower in yield.
While so many are bullish on Municipal bonds, Jeff Gundlach is not. In his webcast on Tuesday, he said “Munis are rich relative to Treasuries” and that he is less comfortable with Munis than he was in 2010. But he added that “taxes are still going higher” and he remains worried that “taxes on Muni income will come at least for wealthy people“.
4. Equities
There were a couple of blows to the U.S. equity market this week. First the stunning defeat of House Majority leader Eric Cantor and then the even more stunning collapse of the Northern Iraqi army in Mosul. That led to two consecutive triple digit declines in the Dow on Wednesday and Thursday.
Guy Adami of CNBC FM said the S&P could trade down to 1860. Lawrence McMillan also mentioned this 1860 level in his Friday summary:
- As far as the $SPX chart is concerned, it has support at 1900. In fact, there is really support all the way down to 1860. A close below 1860 would change things, turning the chart to a bearish state if that were to happen. In summary, the indicators are still generally bullish. Hence we are intermediate-term bullish, understanding that the overbought conditions can produce sharp, but short-lived pullbacks at any time
But one veteran trader talked about a change in direction of the U.S. stock market:
- Friday – traderxaspen @traderxaspen – Most important mkt has turned short term and as day trader looking for rallies to sell. !
The sentiment indicators are all as extended as we discussed last week. So we will not belabor those points again except to add:
- Thursday – Bespoke @bespokeinvest S&P 500 remains stuck in a short-term intraday downtrend that began at noon on Monday. Now at one-week lows, still overbought. $SPY
- Friday – Helene Meisler @hmeisler – ISEE Equity scoots over 200 again today
5. Gold, Silver
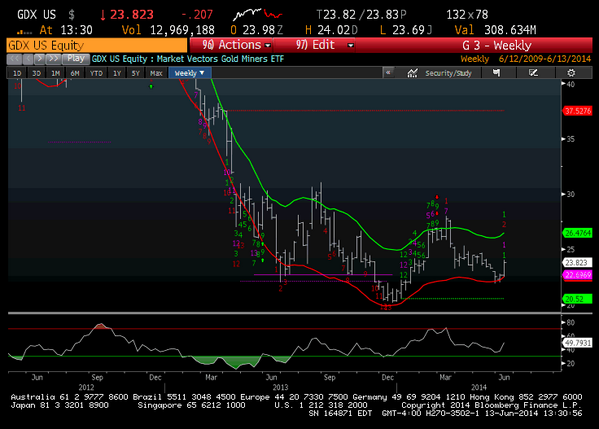
Gold & Silver began moving slowly last Thursday thanks to Draghi. This week they were the stars. Gold rallied 1.9% and Silver rallied 3.5%. The miners were explosive with lesser miners or GDXJ up by 13% and the majors or GDX up 6.5% for the week.Jeff Gundlach told his investors in his webcast on Tuesday that we “will see higher high in Gold in 2014; which means $1400; $1500 will be best case, might get close to it.” What do technicians say?
- Friday – Mark Newton @MarkNewtonCMT – My intermed term $GDX target lies up near $37.50-38.25, Has gotten stretched this week, but 26.60-5, 28 are short-term areas of importance
- Friday – Mark Newton @MarkNewtonCMT – Gold stocks made meaningful progress this week, $GDX up to near 4-week highs, carving out bigger reversal IMO, I own pic.twitter.com/am9sCKDI1d

And Silver?
- Friday – J.C. Parets @allstarcharts – Silver has held that key support over the last couple of weeks. That’s been impressive. Still watching and waiting patiently $SI_F $SLV
Send your feedback to editor@macroviewpoints.com Or @MacroViewpoints on Twitter