Summary – A top-down review of interesting calls and comments made last week in Treasuries, monetary policy, economics, stocks, bonds & commodities. TACs is our acronym for Tweets, Articles, & Clips – our basic inputs for this article.
Editor’s Note: In this series of articles, we include important or interesting Tweets, Articles, Video Clips with our comments. This is an article that expresses our personal opinions about comments made on Television, Tweeter, and in Print. It is NOT intended to provide any investment advice of any type whatsoever. No one should base any investing decisions or conclusions based on anything written in or inferred from this article. Macro Viewpoints & its affiliates expressly disclaim all liability in respect to actions taken based on any or all of the information in this article. Investing is a serious matter and all investment decisions should only be taken after a detailed discussion with your investment advisor and should be subject to your objectives, suitability requirements and risk tolerance.
1. “One of the Ugliest Days in History?”
Last week we wondered & guessed:
- “So will this week’s bounce in commodities & treasuries continue next week? The volume in Gold miners, the steep fall in yields does suggest betting that way if the stock market doesn’t rally hard.”
The stock market did not rally hard. But commodities kept getting clobbered and treasury yields kept rising slowly from Monday to Thursday. And Thursday was just awful for oil, precious metals & copper. Some on Fin TV attributed the fall to a drop in demand, some to expiration. Pete Najarian of CNBC FM simply attributed it to margin calls on large holders pointing out that at 2:15 pm, the price of oil dropped by $1. A similar point had been made on Tuesday by Raoul Pal, of Global Macro on CNBC FM:
- “you’ve got the biggest-ever position in the commodity in history, I think six standard deviations above its mean was the long positioning in oil”
Anthony Grisanti, a CNBC Futures Now contributor, stepped up on Thursday to announce that he had taken a long position:
- “I think we are at or near a bottom of crude oil … It is 74 or 73 dollars; there are a lot of weak shorts in the market; they have come in just now & gotten short;”
- “I have done that a little bit today [bought oil] and I would certainly buy at $70; I am not saying we are forming a bottom; but I think there is a bottom close to this market right now – there are players who are coming in and buying Out of the money calls because they are cheap right now; … the reward is lot greater to the upside than it is to the downside;”
Dennis Gartman said on Friday on CNBC Closing Bell that he had closed his short in Oil on Thursday afternoon. He explained that the term structure in Oil was not bearish at Thursday’s close on a “decidedly bearish day” like Thursday. His conclusion – “time for being short has passed us by“.
The big news in energy stocks hit on Thursday afternoon when the WSJ broke the story about Haliburton being in talks to acquire Bakes Hughes. This reduced the sell off in XLE & OIH but not in Oil. Then on Friday, Oil rallied hard, much harder than XLE & OIH. Both Oil ETFs, USO & BNO rallied more than 2%.
The rally in Oil was overshadowed by the ferocious rally in Gold, Silver & the miners. GLD was up 2.5%, SLV was up 4.41%, GDX & GDXJ were up 6.02% & 6.815 resp. A terrific rally but weaker than last Friday’s rally.
We have seen two ferocious rallies in Gold, Silver, Miners & Oil on two consecutive Fridays which reversed the selloffs from Monday to Thursday of both these two weeks. We haven’t heard any explanation and we certainly don’t know why. Is it the fear of being short over the weekend, especially this weekend with the G-20 meeting in Australia? Or is it just a bounce from taking profits on short positions that have worked extremely well? Because the big events are more than a week away with the OPEC meeting on November 27 & the Swiss referendum on November 30.
People who thought Friday, November 7, was a turn proved wrong. What about this Friday?
- Friday – J.C. Parets @allstarcharts – Nice upside reversal in a lot of commodities today to go along with the Euro rally. I don’t think this should be ignored.
And Brian Kelly of CNBC FM pronounced that “this is a completely changed gold market; completely changed FX market“.
In contrast, the S&P was wonderfully quiet all week, rallying on Monday by 31 bps and then moving + 7bps, 5 bps & 2bps on Tuesday, Thursday, Friday and declining by 7 bps on Wednesday. So why was Thursday, that closed up 5bps, called One of the Ugliest “Up” Days in History? Dana Lyons explains in his article with 5 charts and writes why that might be important:
- “within the context of a very mature rally and longer-term divergences aplenty, even one day can be a red flag. The location of many of the blue markers on the charts above indicate that while these ugly up days are at times 1-hit wonders, they have often been harbingers of worse things to come on an intermediate or longer-term basis”
A quick summary of the 5 reasons minus the revealing charts & explanation:
- Breadth on the NYSE + Nasdaq was among the worst ever on an up day in the S&P 500;
- Breadth on the Nasdaq was the 2nd worst ever for a 52-Week High in the Nasdaq Composite;
- NYSE Breadth was the 3rd worst ever for a Dow Jones Industrial Average 52-Week High;
- Yesterday’s 0.93% loss in the Russell 2000 was the 4th worst ever on a day the Nasdaq 100 made a 52-Week High;
- The Dow closed at a 16-day high, but so did High Yield rates
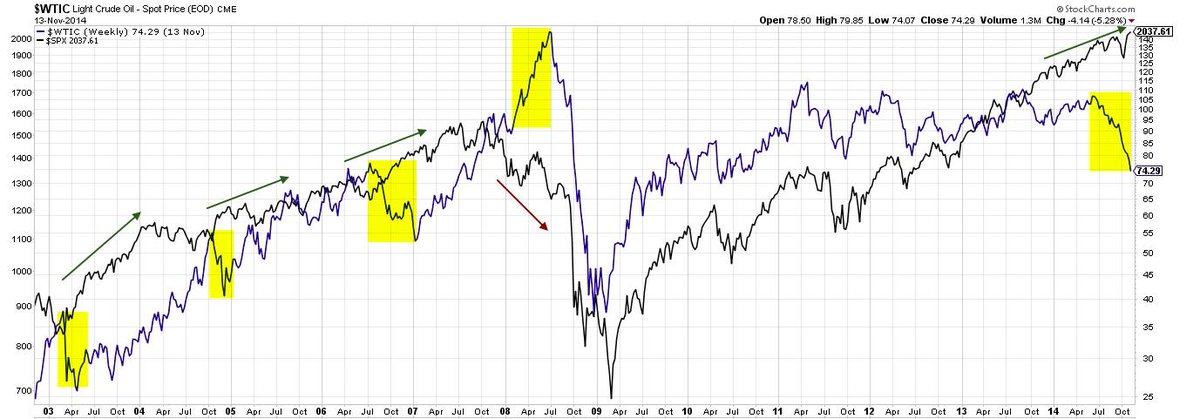
Getting back to Oil, what happens when S&P and Oil diverge?
- Friday – Urban_Carmel @ukarlewitz – Oil and SPX usually move together. When they don’t, it’s oil that normally changes direction

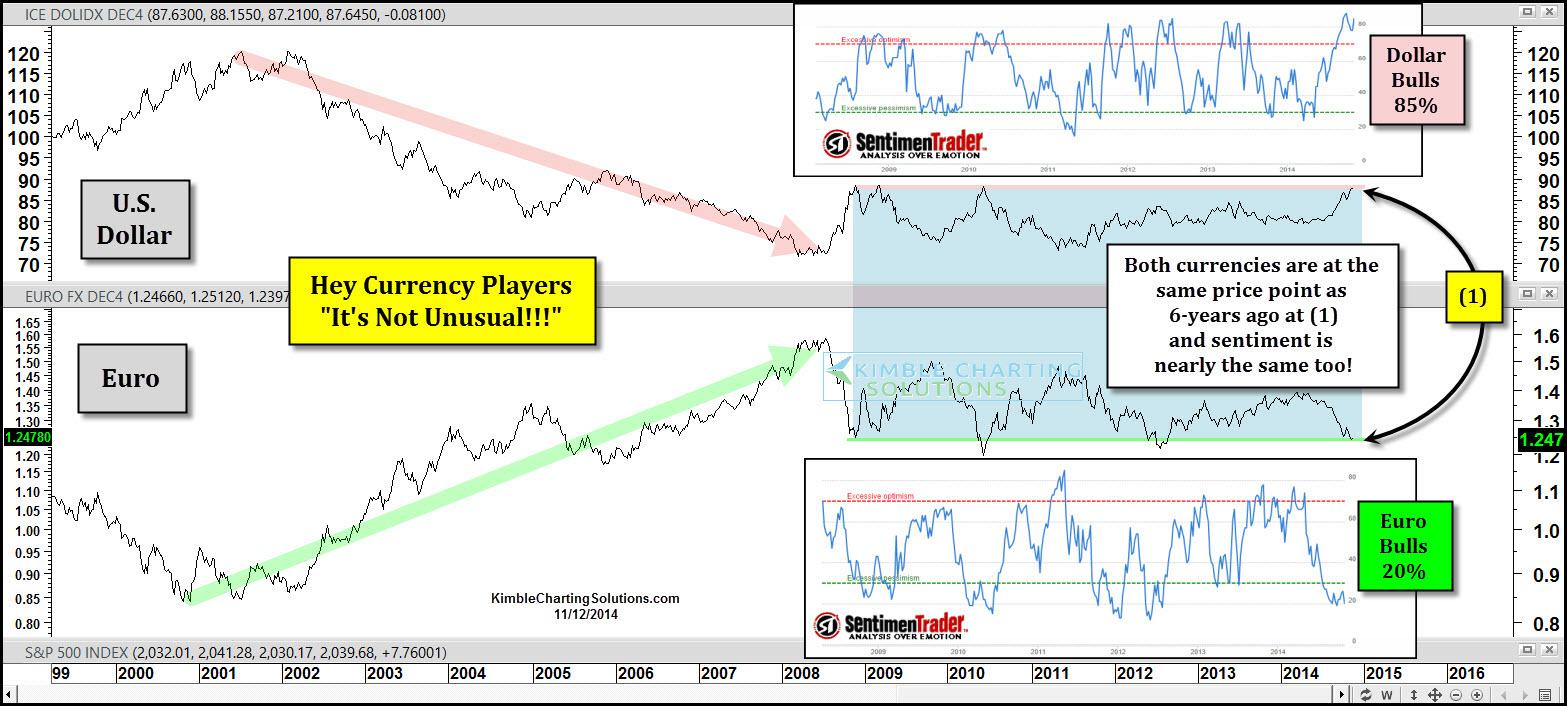
Since commodities are influenced by the U.S. Dollar:
- Friday – Chris Kimble @KimbleCharting – U.S. Dollar 6-year resistance. If the top of the channel holds and Dollar falls, metals will like it. $GDX $GLD $SLV

But can this pair move before the ECB meeting in December?
With all the above, we still don’t get why two consecutive Fridays featured a major reversal of the action from the Monday-Thursday periods.
2. Equities
Tony Dwyer of Canaccord Genuity has been generally correct all year. He did warn of a sell off late summer and said that would be a buying opportunity. This week, on CNBC Futures Now, Dwyer was unrepentantly bullish:
- “I am looking for a year-end ramp; it really hasn’t changed since the beginning of the year; the market historically, in a 3% inflation environment trades at 19 times; thats my core assumption; with $117.5 of earnings gives you a 2230 target this year and I haven’t changed it & I don’t intend to;”
Adam Parker of Morgan Stanley reiterated his one-year out target of 2,125 because the “US economy just keeps plugging along“. Chris Kimble (@KimbleCharting) posted a “new” buy call based on Dow breaking above “megaphone resistance“.
This is breakout of a 16-year megaphone pattern and remains valid as long as Dow remains above 17,000, as CNBC’s John Malloy explained on CNBC StreetSigns on Friday. A key point from Malloy’s article:
- “So in a technical analyst’s eyes, the panic selling last month on fears of higher interest rates and an Ebola outbreak, followed by the enthusiastic buying on optimism those fears were overblown, was a pattern very similar to the end of the credit crisis.”
Jeffrey Saut of Raymond James stuck to his indicators on Friday:
- “My own personal trading philosophy still leads me to believe that we are likely nearing the end of this recent sharp ascent, but the stock market appears to be on a mission of its own and has greedily failed to let us in on where its terminal destination will be. Most astounding to me during this melt-up is that yesterday was only the third trading session since the October 15th bottom in the S&P 500 where the low of the day fell below the previous day’s low. Now, I don’t have the statistics in front of me, but I’m willing to bet that doesn’t happen very often during a month’s worth of trading. Recent action certainly represents a buying stampede, but I’ll also point out that two of those three “lower low” days have occurred in the past two sessions, meaning that the move may finally be getting exhausted. I remind you that overbought readings are generally corrected either by falling prices or a period of sideways consolidation that allows the internal energy to rebuild. Either one of these cases could realistically happen, but I think a modest decline is more likely.”
Then you have:
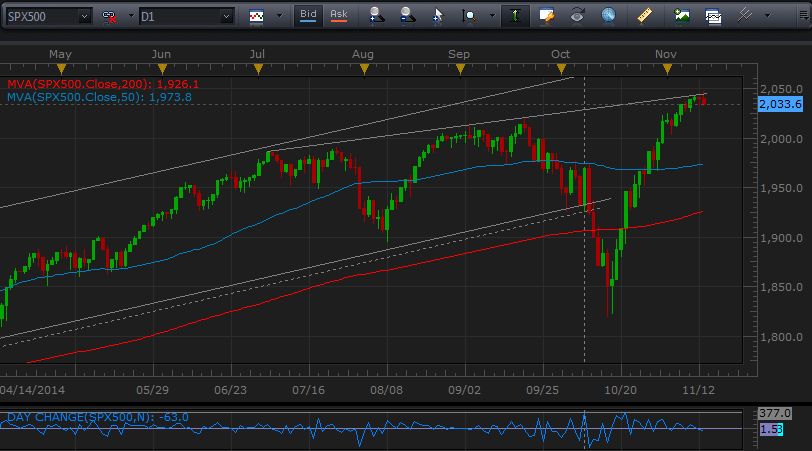
- Thursday – John Kicklighter @JohnKicklighter – $SPX chart looks like the contrail of a rocket that didn’t leave the atmosphere and at risk of falling back to Earth

and the article Is It Time For A Decline? by Chad Gassaway:
- “As we continue to grind higher, a loss of momentum is taking place. Average true range (14 period) has continued to decrease over the past two weeks. While this is not extremely bearish, it does show that the trend is maturing and losing strength.”

- “Meanwhile, the VIX is backtesting trend line support. Should this level in the VIX hold, we could see volatility in the weeks ahead.”

- “Additionally, over the past year and a half the market has struggled when it has extended this far from the 50 day SMA. Three of the four times this took place led to a couple weeks of sideways movement before a market pullback.”

So? Gassaway writes:
- “While we are in the middle of a strong seasonal period, a good reward versus risk trade is presenting itself when a stop over the upper broadening pattern trend line is used.”
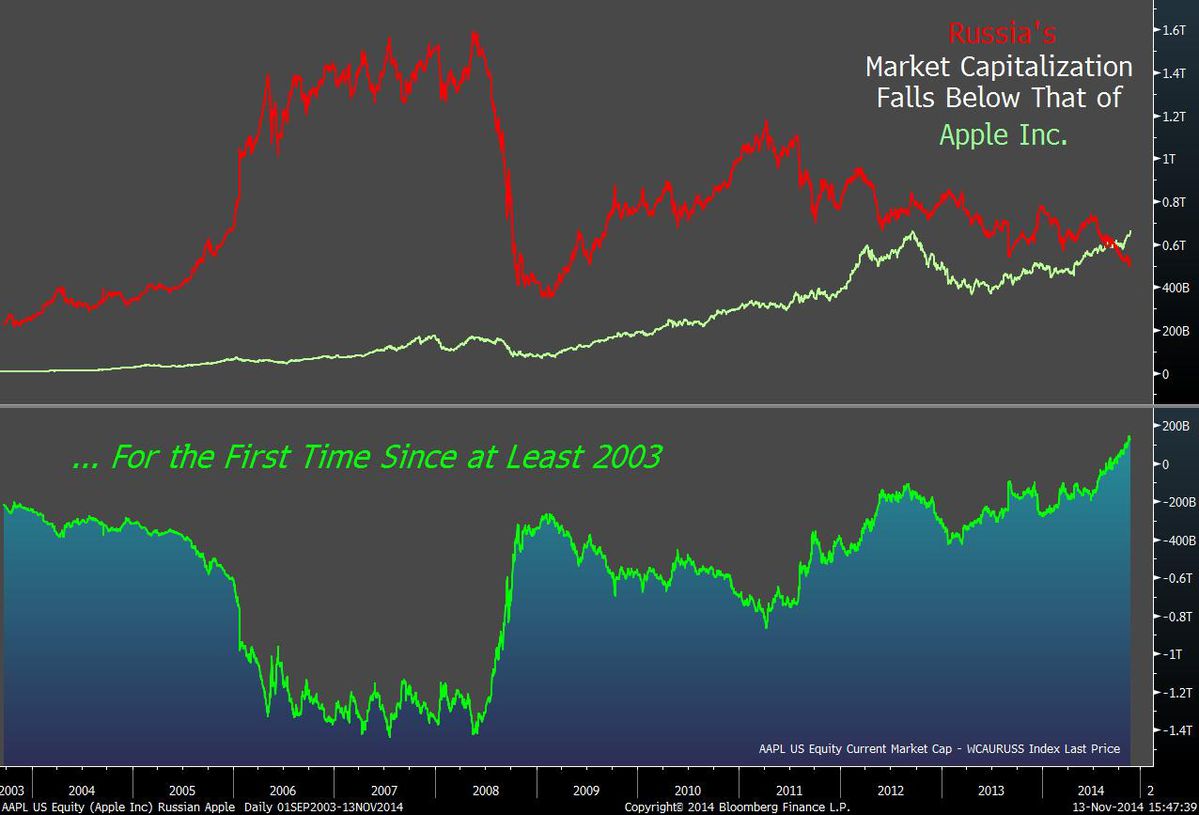
We all remember when the land under the Emperor’s palace in Japan was worth as much as California or something like that. Something like that seems to be the intended implication of the tweet below:
- Boris Schlossberg @Fxflow – RT @BloombergNews: Apple now worth more than the entire Russian stock market: http://bloom.bg/1wycM5V /pair trade?

3. Interest Rates.
Jonathan Beinner of Goldman Sachs Asset Management apparently lost a bet with CNBC Squawk Box folks but didn’t want to admit that because the 10-yr yield closed above 2% on the day of the flash crash in Treasuries. Guess the CNBC FM gang are the not only ones who refuse to pay up when they lose a bet on interest rates. Mr. Beinner has now pushed his 3% target for the 10-year yield to some time next year. He still bets on a Fed hike by mid-2015.
In the other corner is J.C. Parets whose new post is titled Why Economists Will Get Bonds Wrong Again in 2015:
- “I’m thinking my “big idea”, if there is such a thing, is that economists will be wrong once again and rates stay down.”
- “Wall Street Economists Consensus is that Fed Funds will end next year near 1%. They are so stubborn. Meanwhile, the forward looking Fund Fund Futures market is pricing in half of that, and the probabilities are nothing to be excited about. There’s actually only a 63% chance of the first hike in September, based on the price of fed fund futures contracts. Is that enough to sell bonds? Not for me. No thank you. Economists who don’t put any money to work can keep telling everyone to sell bonds. The free markets that, by definition, are made up of people who actually put money to work continue to tell us to buy bonds and overweight higher dividend paying stocks.”
- “I really think rates stay down. And I believe economists get it wrong again. The best way to express that, in my opinion, is to stay overweight higher dividend paying stocks and continue to buy any weakness in US Treasury Bonds, particularly on a relative basis to other countries’ debt“
4. Eminent Domain or lack thereof in China?
- History In Pictures @History_In_Pix – An elderly Chinese couple refused to sign an agreement allowing their house to be demolished for a new road:

.
Send your feedback to editor@macroviewpoints.com Or @MacroViewpoints on Twitter
