Summary – A top-down review of interesting calls and comments made last week in Treasuries, monetary policy, economics, stocks, bonds & commodities. TACs is our acronym for Tweets, Articles, & Clips – our basic inputs for this article.
Editor’s Note: In this series of articles, we include important or interesting Tweets, Articles, Video Clips with our comments. This is an article that expresses our personal opinions about comments made on Television, Tweeter, and in Print. It is NOT intended to provide any investment advice of any type whatsoever. No one should base any investing decisions or conclusions based on anything written in or inferred from this article. Macro Viewpoints & its affiliates expressly disclaim all liability in respect to actions taken based on any or all of the information in this article. Investing is a serious matter and all investment decisions should only be taken after a detailed discussion with your investment advisor and should be subject to your objectives, suitability requirements and risk tolerance.
1. “she is probably getting whip-sawed”
said Greg Ip about Janet Yellen on Friday afternoon on CNBC Closing Bell. This week’s action was enough to whip-saw anyone. Thursday featured a sharp up spike in treasury yields. So a strong a payroll number on Friday morning was supposed to result in a Treasury sell off. The number was 252K in what David Rosenberg called “one rock solid report”. Treasuries sold off initially and then they turned.
- Will Slaughter @NWPCapital – US bond market is behaving very curiously for an
economy allegedly closing in on full employment
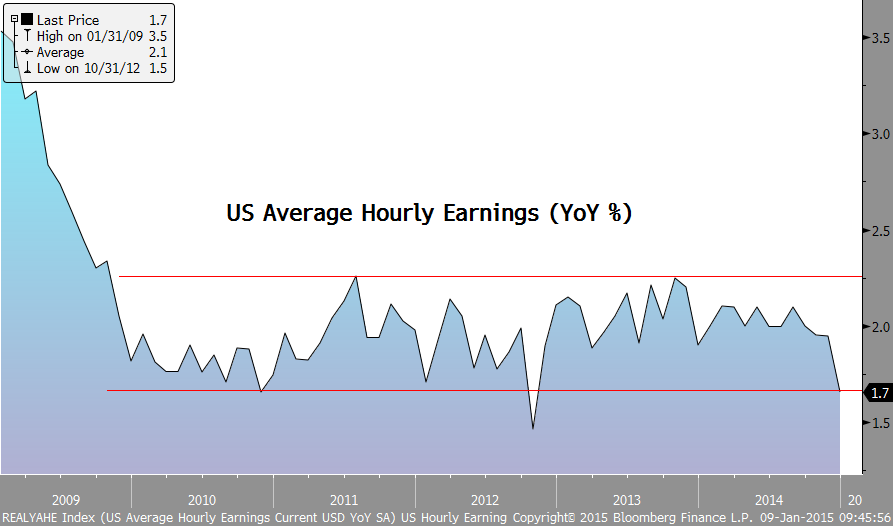
What does this report do to Chair Yellen’s desire to get off their zero interest rate policy? Prima facie, it should support it because current lower inflation pressures are transitory, right? On the other hand, as Bill Gross said on Bloomberg Radio’s Surveillance, “level of wage growth is not enough to sustain growth“. How low is wage growth?
- Charlie Bilello, CMT @MktOutperform – Average hourly earnings, YoY down to 1.7%.
.
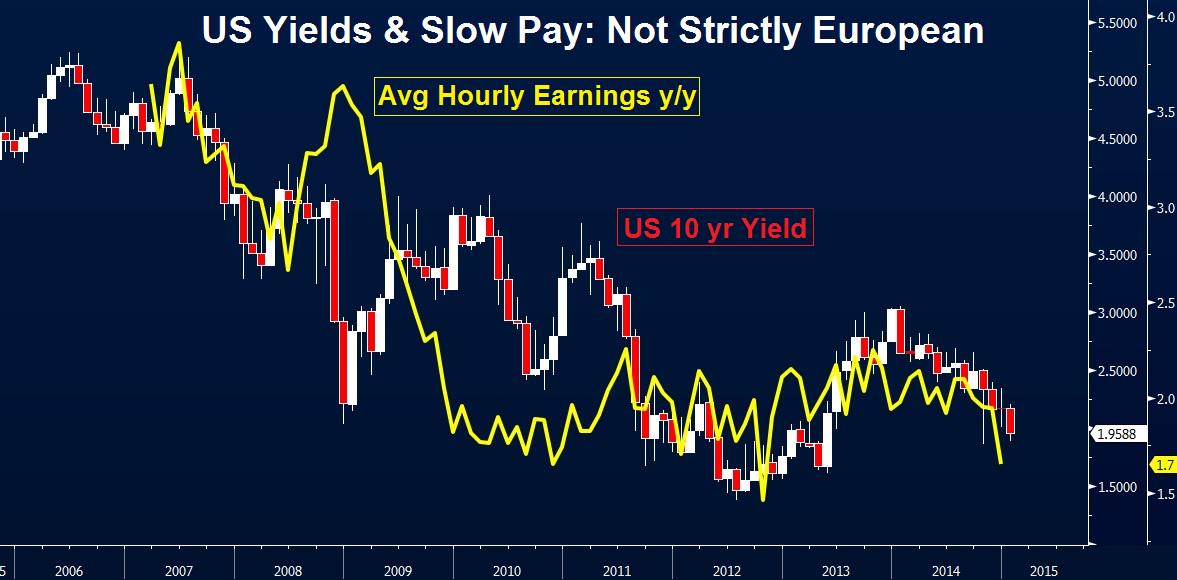
And how does wage growth matter?
- Ashraf Laidi @alaidi – Wages overshadow jobs growth #forex #FOMC #NFP
http://www.cityindex.co.uk/market-analysis/market-news/36101492015/wages-overshadow-jobs-growth//?cid=0000215115 …
The picture is still murky in job growth:
- Jim Rickards @JamesGRickards – Using new Dec data & revised Nov data; month-
over-month job creation fell 101,000 in Dec; steepest drop in over a year. #SomethingHappened
But what about net jobs & what does it mean for rate hikes?
- Lawrence McDonald @Convertbond 2014 USA 2.7 Million Jobs Created 1.2 Million People left the workforce = No 2016 Rate Hike 1.94% US 10 Year Only 1.5m net new jobs
Then you have:
- Matthew B @boes_ Goldman’s global economic surprise index has been negative for the last month but now lowest since Oct. 1
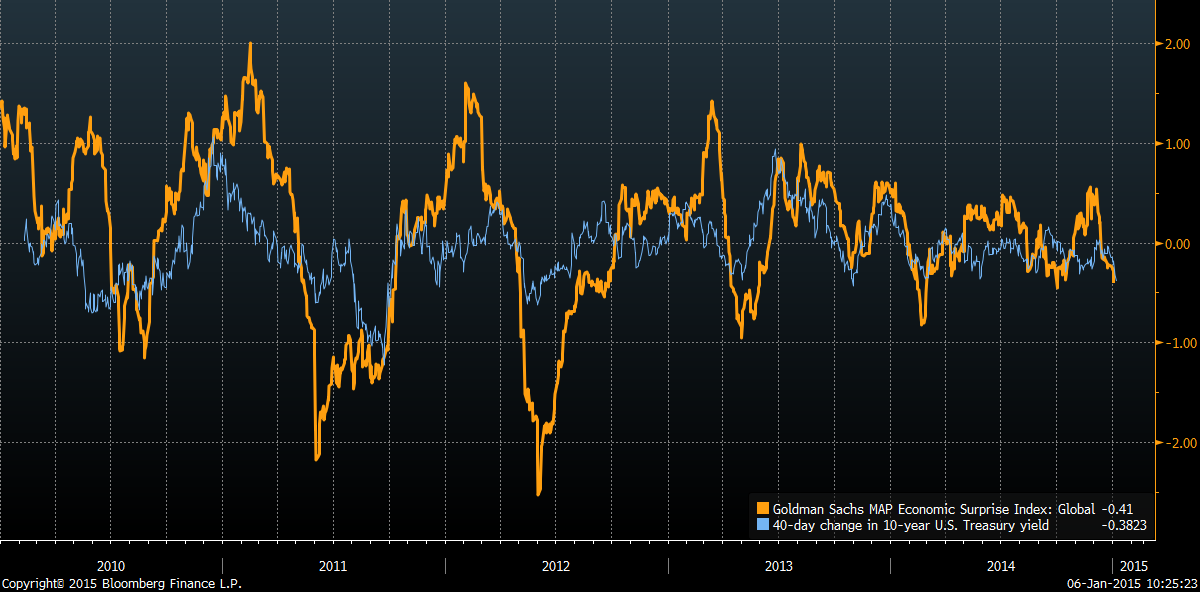
But we keep getting told that the Fed is absolutely sick of remaining at zero. So how could they justify raising rates with the above data? One answer was suggested by acrossthecurve.com:
- “the Fed is well aware that tumbling energy prices will pull inflation lower—maybe a lot lower—for a time. But the FOMC might raise rates anyway if their models suggest inflation will return to 2%”
In other words, if the Fed can convince themselves of their own confidence that inflation will move back toward 2% over time. How can they do that? By looking at Fed’s long-run inflation models. But, as acrossthecurve.com pointed out:
- “Note that Fed’s long-run inflation models don’t include include oil or the dollar, only the unemployment rate and inflation expectations. Oh, and they don’t like the market measures of inflation expectations, which are very low at the moment. They prefer consumer measures of expectations, which takes years to move. … In other words, the FOMC is as convinced we will soon see rising inflation in the US as Jens Weidmann was about EU Inflation six months ago“
Now do you understand why the new FOMC voting member Charles Evans said in his speech on Wednesday that “raising rates would be a catastrophe“. On the other hand Bill Dudley of the NY Fed remembers what their low rate policy created 10-8 years ago. No wonder Janet Yellen is getting whip-sawed. But, as things stand, the “Fed is determined to tighten” as acrossthecurve.com said this week. What was the verdict of the Treasury market on that on Friday?
- InterestArb @InterestArb – 5yr sector was the post NFP champion of the day as both 2-5’s & 3-5’s flattened while 5-10’s & 5-30’s steepened. Belly outperforms wings!
The 5-year is the best or least Fed-impacted determinant of probability of Fed hiking rates and it spoke clearly on Friday as it has been speaking for the past two weeks – the 5-year yield fell 18 bps this week and it has fallen by 32 bps during the past two weeks. The steepening of the 30-5 curve began on Fed-minutes Wednesday with 2 bps, accelerated to a bear-steepening of 6.5 bps on Thursday and bull-steepened tiny bit on Friday – another clear indication of easier liquidity expectations.
2. Panic in Treasury yields
We thought we saw a buying panic in Treasuries on Monday but that was nothing compared to what happened on Tuesday morning. TLT reached an all-time high of $132.49 and the 30-year yield fell below 2.50% on Thursday mid-morning. The tweets & charts below tell it much better than we can:
- Eric Scott Hunsader @nanexllc – Flight to Treasuries approaching warning levels
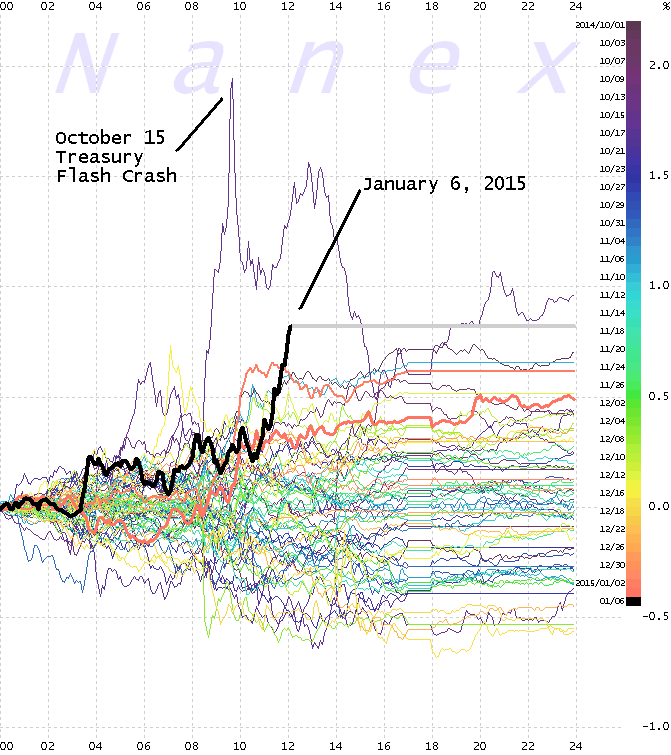
- Eric Scott Hunsader @nanexllc – Something is happening in Treasury Futures – starting 12:38 – liquidity started noticeably disappearing $ZN_F $ZB_F
- Eric Scott Hunsader @nanexllc – Black line is Liquidity in 10-year Treasurys today $ZN_F.
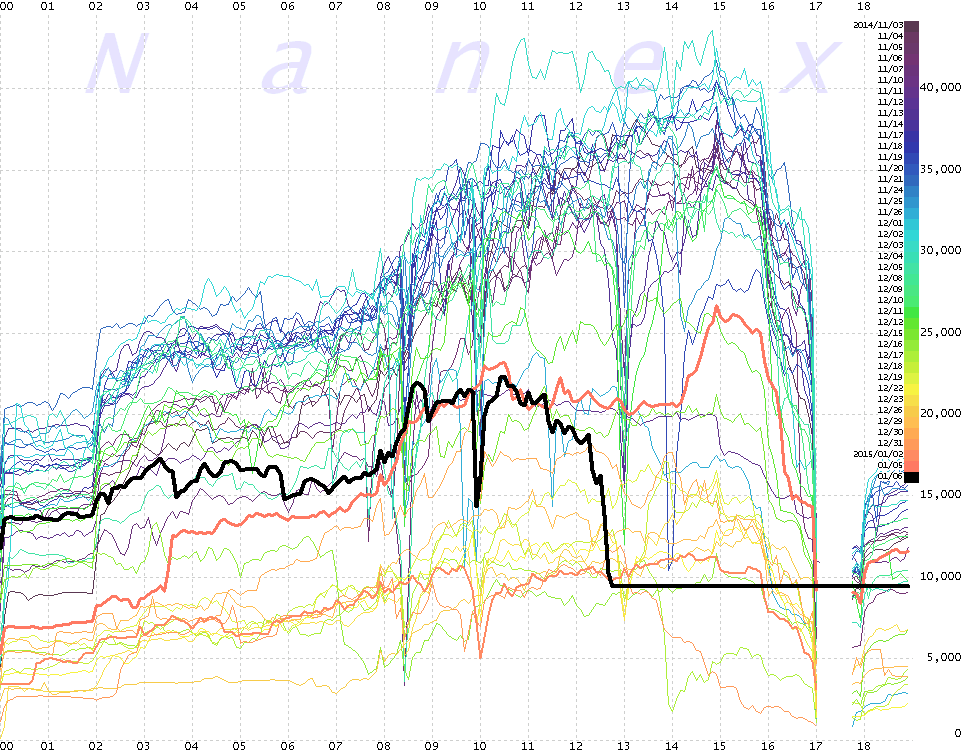
That was the bottom in yields for the morning & the 30-year regained the 2.50% level by Tuesday’s close. It did feel as if a panic bottom in yield had taken place. Brian Kelly of CNBC FM announced on Tuesday evening edition that he had sold all his Treasury Futures & TLT that day. The 30-year yield did rise a bit on Wednesday, spiked 8 bps on Thursday and then fell by 5.5 bps on Friday either due to the payroll report or due to usual Friday’s rally in Treasuries. And yes, the rise & fall in treasury yields is correlated to German bund moves. But who is leading the dance? UST or Bunds? How unusual is this fall in yields? This was discussed by Dana Lyons in his article Are Bonds A Better January Barometer For Stocks?
- “First, the decline in the 10-Year Treasury Yield (TNX) to begin the year has been the steepest in history (going back to 1962, the beginning of our daily data). In fact, it is double the next largest historical decline. Over the first 4 days of the year, the TNX has dropped almost exactly 10%. The next closest was 2008, at just under a 5% decline. So this year is pretty much unprecedented in that regard.“
The really interesting part of this article is the discussion of the specific years in which bond yields fell by 1% in the first four days of the year. We urge interested readers to read the article.
3. Volatility
When liquidity begins to disappear from treasury market, it is both a sign of intense volatility & of market makers walking away. The second point was addressed by the renowned trader Larry Altman on CNBC FM 1/2 – the regulators have taken liquidity out of the markets. He began by making this point about the incredible fall in oil and then about the stock market which he said is going up and down like air.
The first point was discussed by Dana Lyons in an article about VVIX (indicator of the volatility of VIX) titled Why Is VIX Volatility At Crisis Levels? First his facts:
- “Typically (i.e., 90% of the time), the VVIX ranges between 60-100. In the past few days, the 21-day average (approximately 1 month) of the VVIX reached a level of 110. Since the inception of the VVIX in 2007, this is just the 5th time its 21-day moving average has gotten that high. The other 4 occurred during times of legitimate — or pending — market turmoil.”

The other 4 periods you notice above are August 2007, October 2008, May 2010 (flash -crash) & August 2011 (debt ceiling/downgrade crisis). So what’s going on Dana Lyons asks and provides the following answer:
- “We’re not totally sure but the VIX and VVIX seem to be detecting something that isn’t readily apparent in market prices. Perhaps, there is some sympathy with the soaring volatility indexes in commodities and currencies. Perhaps it is in anticipation of something pending, ala 2007. That was the only prior instance that bore any resemblance to our current circumstances in that the market was 4 years into a cyclical bull market and had only experienced a relatively moderate decline in August. If that is the case, then the market could be setting up for some trouble ahead.“
His concluding sentence?
- “Our unsatisfying conclusion is that this is another one for the “Hmmm” pile, but slightly leaning negative due to the 2007 similarities. Only time will tell.”
4. U.S. Equities
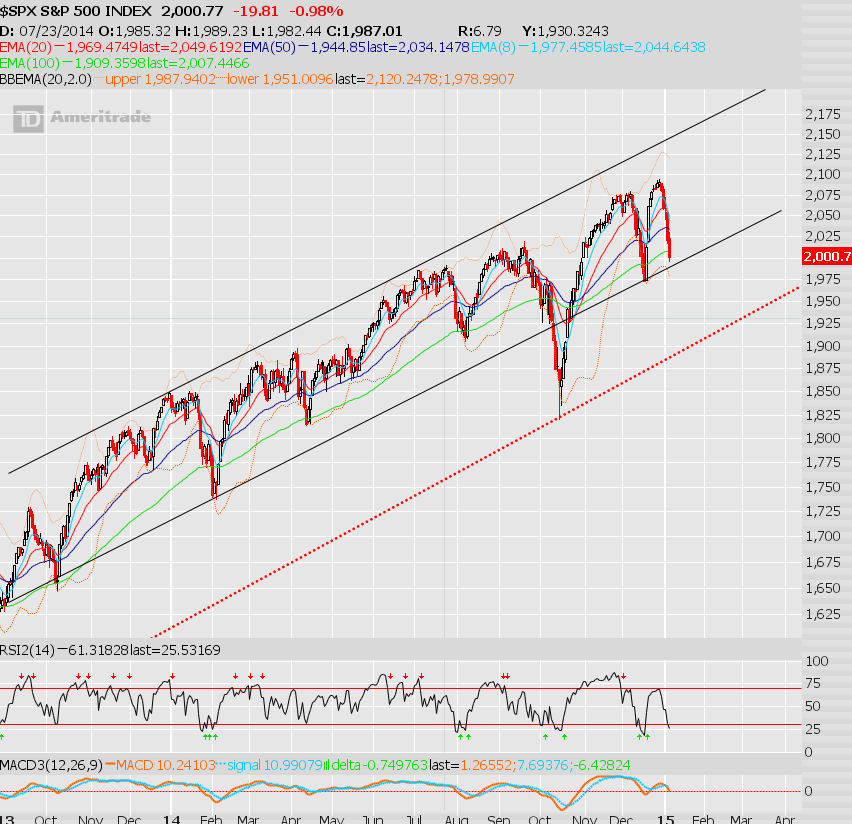
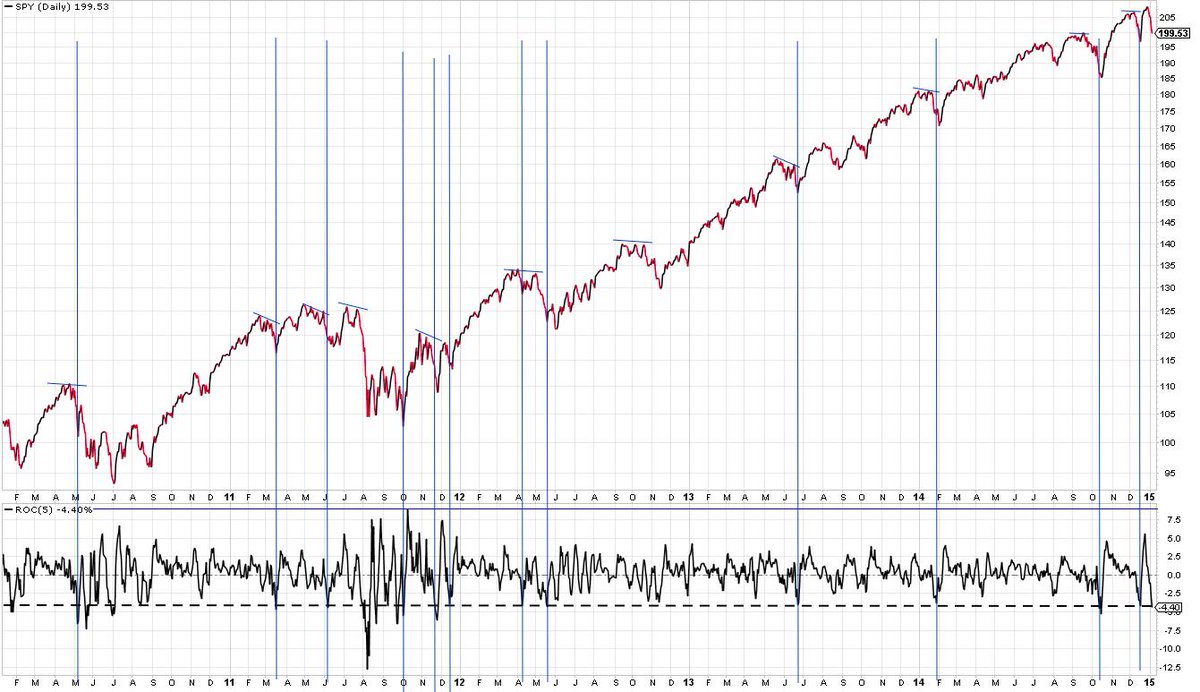
A few of the traders we follow tweeted about a rally in traders in the midst of the panicky selling on Tuesday. Two of them are:
- Tuesday – Joe Kunkle @OptionsHawk $SPX – Discounting the October blip..today lows tested key 2014 supports, 125 MA and near channel
and
- Tuesday – Urban Carmel @ukarlewitz – SPY – 4.5% drop in 5 days has been rare since mid ’12. Without a high retest, after 8 days up, never
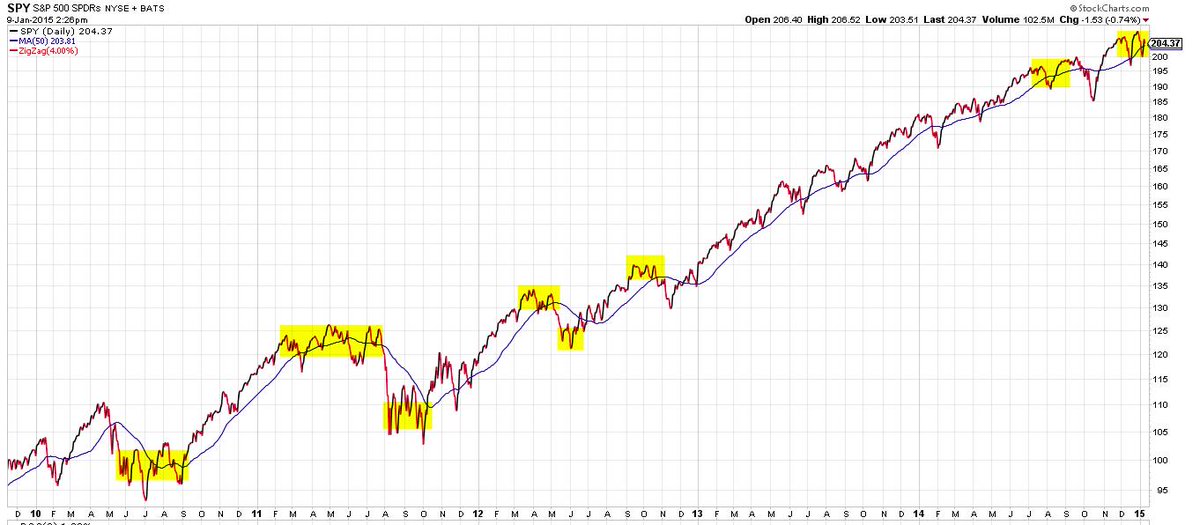
But is all this called into question by the sell off on Friday? What we worry was put very well in:
- Friday – Urban Carmel @ukarlewitz – Also fair to say that volatility increases when price may be changing direction. Losing 50-d again would be worrisome
We are focusing on charts & statistical analysis because there is simply nothing to go on right now. The volatility is the main driver and markets are going up and down on air. We can’t make any sense of what is really going in the U.S. economy and why the 30-year Treasury is behaving as it is. We think Europe is a mess but we don’t how much of a mess and whether the markets will rejoice if Draghi gives them something positive on January 22. We do concur that volatility peaks often signal a change in the direction of price but are clueless whether the price change will occur in stocks, interest rates, currencies or commodities. That’s why guru prognostications seem meaningless to us at this juncture.
5. One big breakdown & one big breakout?
The breakdown could be systemic and so that’s where we go first. What if this week’s volatility is like you ain’t seen nothing yet? What can trigger that? Read what Carl Weinberg said on BTV Surveillance on Monday:
- “There are still substantial risks, Tom, the biggest of which if Greece does elect the Syriza government and they do default on their foreign debt, EFSF bonds are going to turn to dirt & all the people & Institutions who hold that paper are going to have a 180 billion Euro problem.”
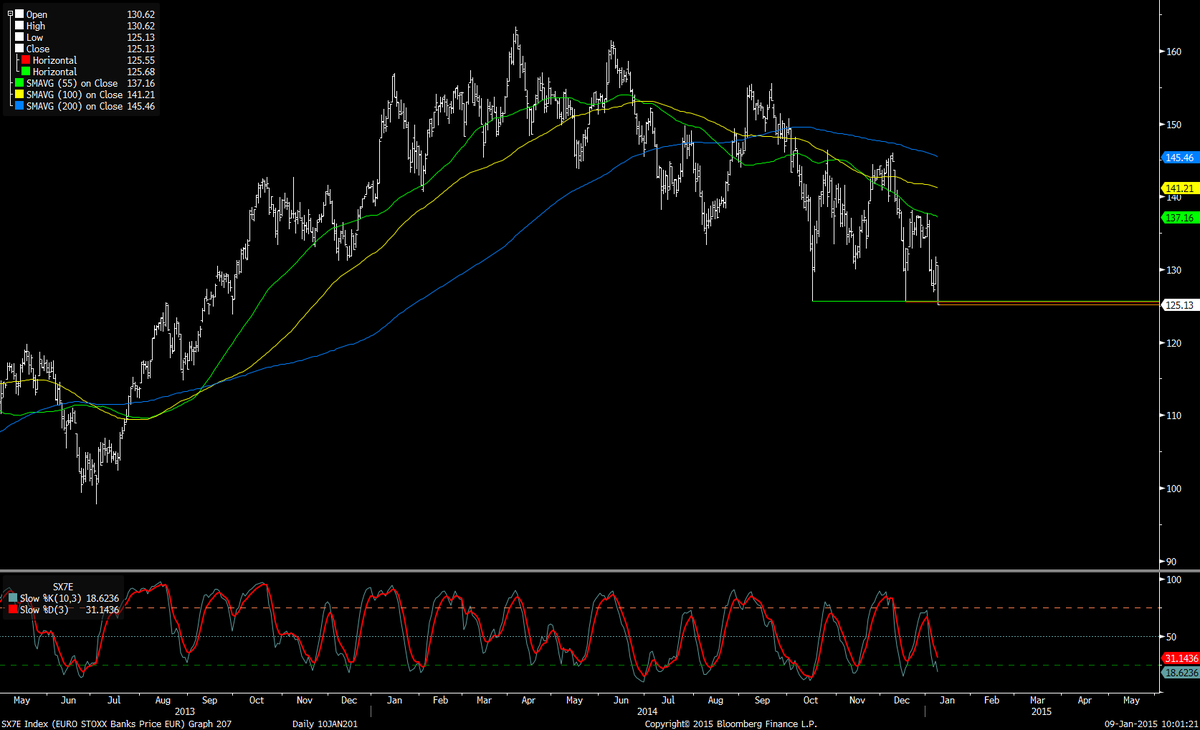
Yes, we do believe that Merkel & Syriza will get to some face-saving solution. But then, we were convinced that Paulson/Bernanke would not allow Lehman to fail. And Lehman was only a $140 billion bond problem. What about happen to European Banks and how would that get back into US banks?
- Friday – FxMacro @fxmacro – European financials breaking a big levels
- Friday – Charlie Bilello, CMT @MktOutperform – New relative lows in the banks. $KBE
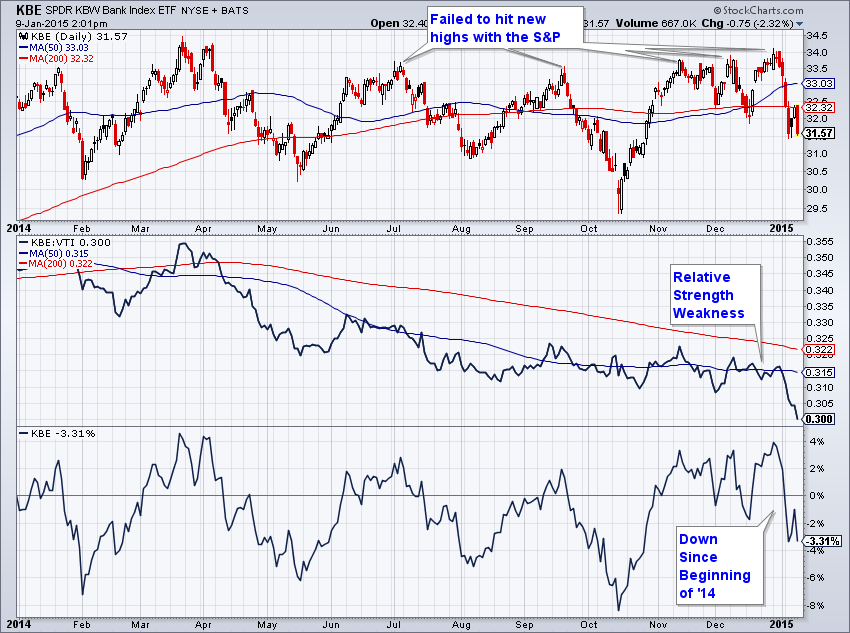
Fear of getting killed is worse than getting killed, they tell us. Suffice it to say few would want to get caught up in banks, at least few of those who worry about Greece making noises about not paying interest on bonds.
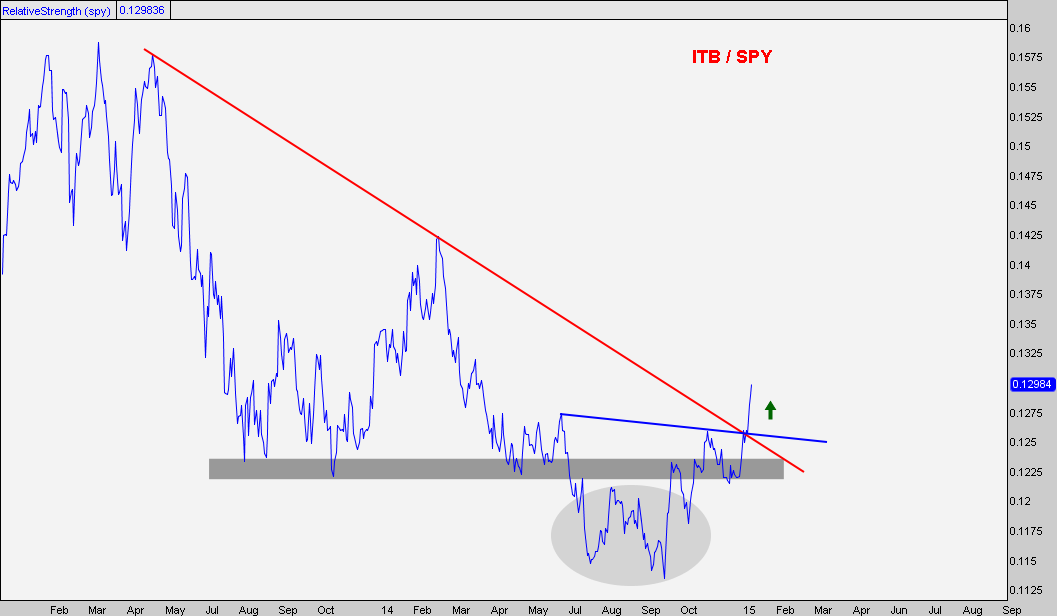
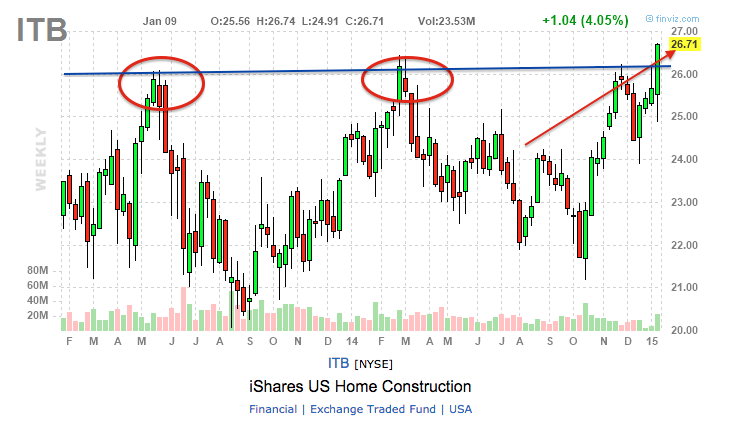
On the other hand. a beautiful breakout in a critical sector for the US Economy:
- Friday – J.C. Parets @allstarcharts – and the US Home Construction/S&P500 spread continues to roar higher after monster breakout to start 2015 $ITB / $SPY
- Friday – Downtown Josh Brown @ReformedBroker – Home builders breakout – dropping rates + roaring jobs numbers.
6. The Dollar
Last week, Tom McClellan argued that the Euro is poised for an upturn. This week he got some company. Larry McDonald said the following on Wednesday on CNBC Closing Bell:
- “Think back to the fall of 2013 – $ was getting out of hand, EM currencies & bonds were in flames, Fed started to talk the dollar down, $ went from 85 to 79 from the fall of 2013 into 2014 – we are getting to that point now – in the next couple of days we have Rosengren & Evans, Lacker on Friday, we have a lot of Fedspeak – if they mention the dollar as a concern, there is so much pent-up bullishness in the $ that could create a reversal; definitely a substantial pull back in a bull market for now – but if they continue that Fedspeak then you will see a more pronounced move“
He would probably like the message of the following chart from GaveKal’s article titled Central Bank EUR Reserves Plunge:
 .
.
GaveKal writes in that article:
- “IMF data released earlier this week revealed the largest ever quarterly decline in reserves held in euros. The more than 8% QoQ drop in holdings of the euro area’s common currency easily surpassed the 6% fall back in 3Q2008 and coincides with one of the more severe quarterly falls in the EURUSD exchange rate that we have seen in some time.”
On the other hand, Futures Magazine wrote on Tuesday:
- “If you recall, the dollar was in a freefall from 2001 through 2004. In 2005 the dollar began a strong upward correction that failed at the 92.50 level, matching a 2004 correction high. If resistance at 92.50 is taken out the dollar will have a lot of upward technical room to roam. … The dollar has taken out important long-term technical resistance points throughout this rally that began this past summer but the 92.50 would be the most important and would an even greater upward move”

7. Gold and Oil
First from Bank of America via forexlive.com: .
- “Meanwhile, BofA remains bullish on gold noting that while the advance has been very choppy, the repeated pattern of higher lows from the Nov-07 low says that gains should extend. … “We expect a test and break of 1241/1255 resistance which would clear the way for the Jul’13 high of 1345 and potentially beyond,” BofA adds.”
Then from Why Gold May Finally Be Turning Higher from Market Anthropology:
- “Gold appears to be finally breaking out of its broad base as the extreme correlation drop between durations that began with the taper in December 2013 exhausts. As we pointed out last year, this same dynamic – to a lesser degree, manifested with the previous tightening cycle that began in June 2004. Once the policy shift was digested, gold broke out of its much smaller consolidation range and correlations were reestablished in the Treasury market.”
But the really interesting chart came from Thomson Reuters:

Is that bullish for Gold or is it bullish for oil? Larry McDonald turned bullish on Oil ETFs USO & BNO in his proprietary Bear Traps newsletter and repeated that call in his discussion with Bob Pisani on CNBC Closing Bell on Wednesday:
- McDonald – the catalyst for that could be Fed talking the dollar down ; if the Fed starts talking the dollar down, it would be very good for oil; BNO, the Brent ETF, is trading 92% below its 200-day – that’s 3-standard deviations
- Pisani – only 5 times in the last 30 years, oil has been sold 50% down in 6 months & 6 months later all 5 times oil has been up an average of 50%
A similar call was made by Kathleen Kelley of FCStone on CNBC Closing Bell on Wednesday:
- “we have seen shorts starting to show up here – just at the time we are beginning to see some positive signs in terms of demand – we have started to see Chinese apparent demand has been higher, actually been pretty good, Chinese imports have been good, US gasoline demand and distillate demand is picking up in fact in December we were at the highest ever at that time of the year“
- “we have seen the put-skew really off as people are definitely positioned for the down side move in this now – think you are setting up you might see actually a move up; don’t forget we have an index rebalance that starts now – we start tomorrow for all the index re-balancing and that is very positive for both crude and Brent“
- “producers produce; that’s their job; they have been thru these cycles many times before; don’t forget as we have seen crude prices come down, we are also seeing cost of production come down; that’s one of the risks we are not going to see – production cuts as fast as we want to because cost of production are coming down at the same time crude price is coming down“
- “more likely to see OPEC make a move, see demand picking up in a lot of different countries, market is positioned wrong... ”
Send your feedback to editor@macroviewpoints.com Or @MacroViewpoints on Twitter