Summary – A top-down review of interesting calls and comments made last week in Treasuries, monetary policy, economics, stocks, bonds & commodities. TACs is our acronym for Tweets, Articles, & Clips –our basic inputs for this article.
Editor’s Note: In this series of articles, we include important or interesting Tweets, Articles, Video Clips with our comments. This is an article that expresses our personal opinions about comments made on Television, Tweeter, and in Print. It is NOT intended to provide any investment advice of any type whatsoever. No one should base any investing decisions or conclusions based on anything written in or inferred from this article. Macro Viewpoints & its affiliates expressly disclaim all liability in respect to actions taken based on any or all of the information in this article. Investing is a serious matter and all investment decisions should only be taken after a detailed discussion with your investment advisor and should be subject to your objectives, suitability requirements and risk tolerance.
1. What’s with the U.S. Economy?
Last week, we saw a “ripping” payroll number that shook the Treasury market. This week we saw really bad data. Even the author of the “ripping” comment, David Rosenberg, seemed confused this Friday:
- “Taking the sails out of the sales – It’s a strange backdrop when it is abundantly clear that employment growth is accelerating and yet the economy is slowing down to a crawl“
“What’s going on here” Betty Liu of BTV asked Chairman Greenspan on her “In the Loop” show:
- “We’re hoping you can solve some of this mystery as to why we are adding jobs, and it looks great, but we are not spending? What is going on here?”
For once, Greenspan gave a simple & straight answer:
- “Well, it’s unfortunately very simple but not a good story. It’s turning out that we’re using more and more people at the margin to produce less and less. Productivity, which is output for man hours as we conventionally measure it, is running at a very low rate of increase. And that’s the critical variable in the economy over both the short-term and the long-term.”
But why weak retail sales? Stephanie Pomboy of MacroMavens provided a simple explanation to Maria Bartiromo on FBN:
- ” … consumers are fundamentally changed after the housing bubble bust & their experience of leverage in reverse which is pretty painful; they are now really determined not to make that mistake again; to be more responsible in their finances”
But what about the deceleration in the last couple of weeks? The weekly model of the Atlanta Fed for Q1 GDP has come down from 2.3% two weeks ago to 0.6% on March 12.
What drove this deceleration? Is it the parabolic rise of the Dollar? David Rosenberg wrote on Friday:
- “It is incredible that so many pandits* can ignore the tightening impact of the stronger U.S. Dollar on the economy”
But how much is the impact? Ellen Zentner, Chief Economist at Morgan Stanley answered that on CNBC Closing Bell on Friday:
- “For every 1% increase in the trade-weighted value of the Dollar, it is the equivalent of about 14 bps widening between the 2-year treasury & 3-month T-bill. So it kind of trumps the boost we get or easy financial conditions we get from lower yields. And that’s how the Fed looks at it. Plus it slows our export sector. We import deflation through import prices.”
We saw that this week with negative ex-energy import price data negative core PPI. If the Fed is really data-dependent and this data is taking them in the opposite direction, can the Fed really tighten? Ellen Zentner argued no but said the term “patient” will come out next week.
May be that’s why Treasuries closed negative on Friday, a day when the long end should have been up 1% with the severe downdraft in stocks. It still is all about the Fed, as we wrote last week.
* Pandit is a Sanskrut word that the British borrowed & wrote un-phonetically as pundit. We see no reason to repeat the British mistake by misspelling the Sanskrut word.
2. Could the Fed make a mistake? What mistake?
We first wrote about flattening of the yield curve last year on January 11, 2014:
- “The action in the yield curve is asymmetric as well. On strong data, the yield curve tends to flatten more than it steepens on weak data. Rosenberg said “I expect we will probably have even a further steepening of the yield curve going forward”. That is not how 2014 is playing out. The curve is getting flatter not steeper.”
Through 2014, we wrote that, via flattening on strong data, the treasury market was signaling that the Fed would be making a mistake by raising rates. Last Friday confused us because the treasury market went the other way and bear-steepened on the strong payroll number. But that proved to be a one-day wonder and this week the 30-5 year curve flattened back to 110 bps, back to its level two weeks ago.
That the Fed would be making a mistake by tightening became a more accepted view this week. Jon Hilsenrath wrote in the Wall Street Journal:
- “When The Wall Street Journal asked economists last August what worried them more – that the Federal Reserve would raise interest rates too soon or too late – the response was overwhelming. More than 90% of those asked said they feared the central bank would be behind the curve, meaning they would raise rates too late and risk spurring inflation or a financial bubble. Their angst is shifting. The majority of economists still worry the Fed will be late to pull the low-rate punch bowl from the financial system party, but by much smaller margins than before. In the Wall Street Journal’s latest monthly survey of economists, released Thursday, more than a third of those surveyed said they feared the Fed would raise rates too soon, not too late.”

A number of luminaries expressed their misgivings about Fed raising rates:
- Jeff Gundlach warned in his webcast that “Fed raising rates will hurt the economy; The Fed my regret raising interest rates, and could even end up reversing its policy. Long end of treasury thinks the Fed tightening is a mistake. The short end is pricing in a tightening”
- Roger Altman of Evercore said on CNBC Squawk Box – “The Federal Reserve better not rush to increase interest rates in June because the labor market is really weaker than it appears;”
- Jim Rickards to Alix Steel of BTV – “by June they will realize how weak the economy is; they will blink & won’t raise rates“
- Stephanie Pomboy said to Maria Bartiromo on FBN –
- “to my mind, I don’t want to rule out the possibility they make a mistake & raise rates; if they do, its just going to increase the magnitude of the response eventually when they have to reverse course; because nothing I see in the economy suggests that they need to raise rates; in fact if you look at all the major economic indicators, many of them are below where they were when they launched QE2 & QE3; so if they were doing stimulus then, why would they argue for tightening now?”
On the other hand, the Fed has made it clear that they are frustrated at being forced to maintain zero interest rates. Gary Cohn of Goldman Sachs laid out their problem succinctly in his conversation with CNBC’s Carl Quintannia:
- “Fed is in a very difficult spot; I completely understand Janet Yellen and her view that zero interest rates were emergency measures and that she would like to have a higher Fed Funds rate; that would give her the latitude, the ability to lowwer rates if something dramatically bad happened in US; Intellectually I understand that argument; if I were in her place, I would love to have that latitude; but then she has to deal with the real realities of the world; we have a soaring dollar, the effects of that soaring dollar are just starting to be felt; it is going to make US exports more expensive; so what does that mean for US manufacturing? what does that mean for US jobs? It is not going to be positive“
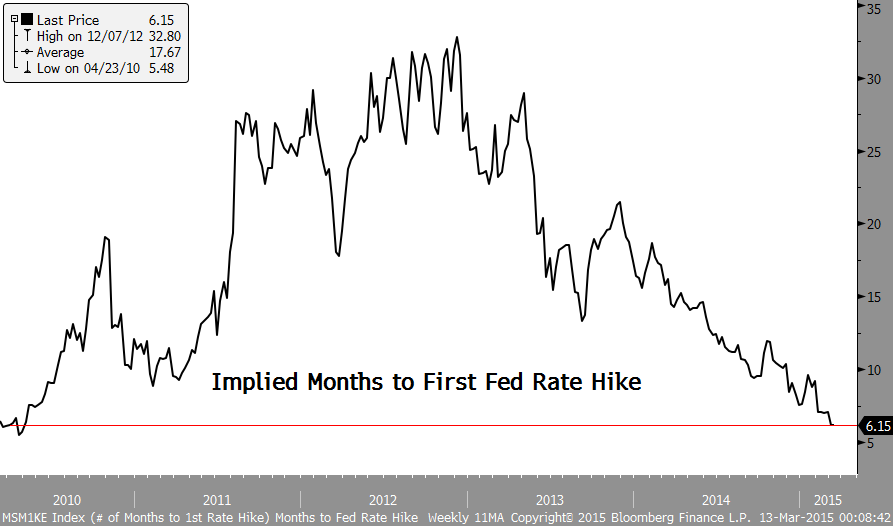
And what’s the hurry asks the chart below:
- Friday – Charlie Bilello, CMT @MktOutperform – At 6 months, this is the shortest expected amount of time to the first rate hike since the end of April in 2010…
3. Europe vs. America
If currency strength is causing deceleration in US data, then shouldn’t European data be improving with Euro weakness? Deutsche Bank said yes in on Friday:
- “European equity performance is being driven by record inflows, both foreign and domestic which are following strong positive data surprises in Europe even as US data has disappointed. European data surprises are running close to the top of their historical band. Relative to the US, they are at their highest recorded levels and 2.5sd away from average.”
And “Europe is on sale today” said Gregory Hayes, CEO of United Technologies, on CNBC Squawk Box & added “With the euro falling to near parity with the dollar, properties that once seemed out of reach may now appear actionable.” In contrast, “valuations are sky high” in the US, Hayes said.
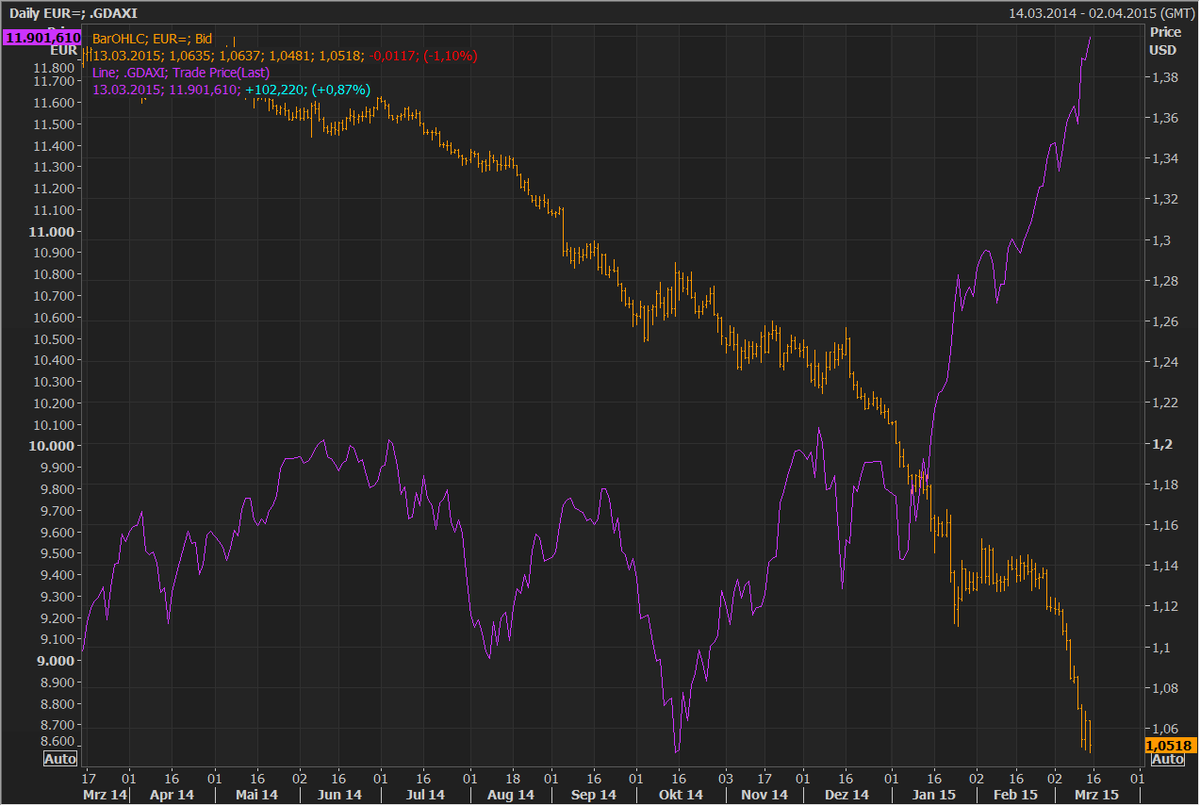
- Friday – Holger Zschaepitz @Schuldensuehner – My WOW-Chart of the week: While the #Euro hits fresh 12yr low, Germany’s benchmark index Dax closed at life-time high
Yield differentials are what drive currencies we are told. Look at the chart from Abnormal Returns:
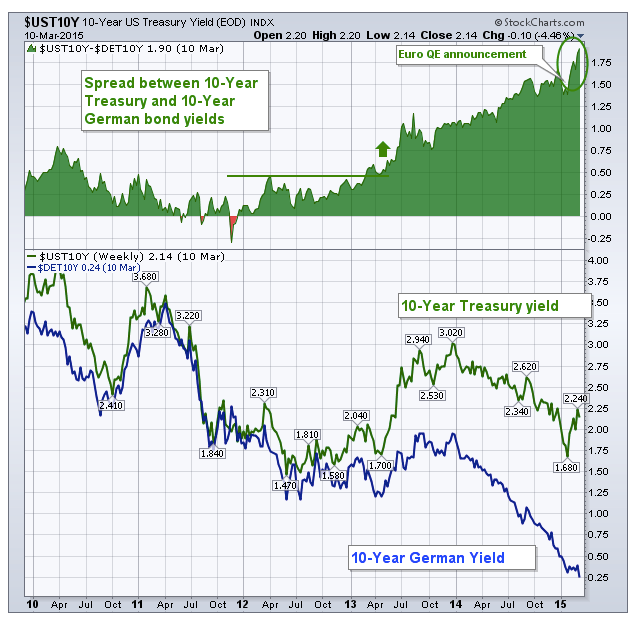
So this should mean record inflows into the US Dollar, right? Not according to Deutsche Bank:
- Since mid-Jan there has been a sharp break from the historical pattern, with large equity outflows from the US (-$43bn ytd, -0.9% of AUM) and inflows into Europe ($39 bn, + 4.0) and Japan ($6.6bn, + 2.8%). Over the last week, US bond funds have also seen outflows, but strong inflows into European bonds continued. A continuing dollar up cycle should eventually see the US get a large share of global flows.
4. Parabolic?
Art Cashin called the recent rise in the Dollar as “parabolic”. Frankly, it seems vertical rather than parabolic to us.
- Wednesday – Northy @NorthmanTrader – Central banks to the world: Trust us we had this all planned like this

Trajectory is one thing but what about the scale?
- Wednesday – Bespoke @bespokeinvest – This chart shows how the euro’s recent decline stacks up relative to history. https://www.bespokepremium.com/think-big-blog/euro-seeing-monumental-decline/
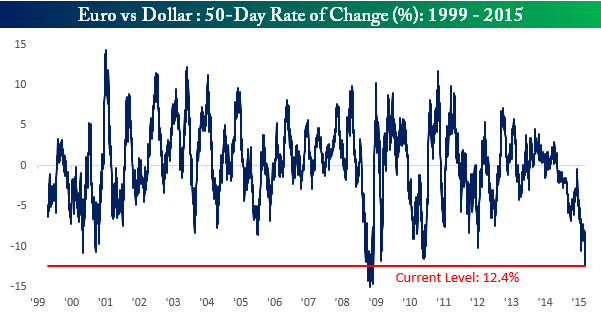
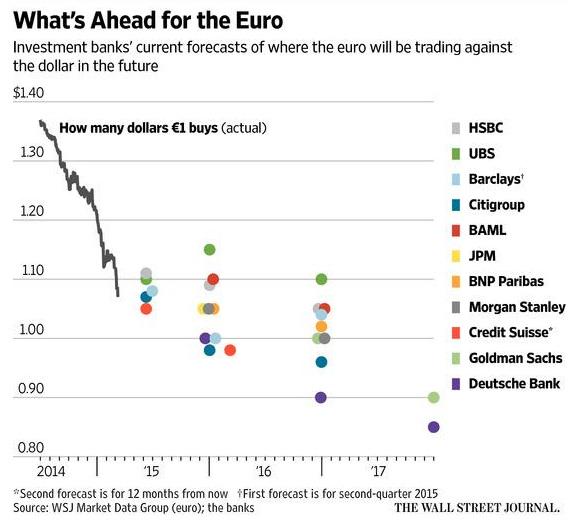
Such moves bring in their wake target changes from analysts who drove down their targets for the Euro to parity, 0.90 & 0.80 & so on. The chart from the Wall Street Journal tells this story.
Cashin suggested that parabolic moves tend to be get reversed. A more detailed case for Euro bounce was made on Friday morning in:
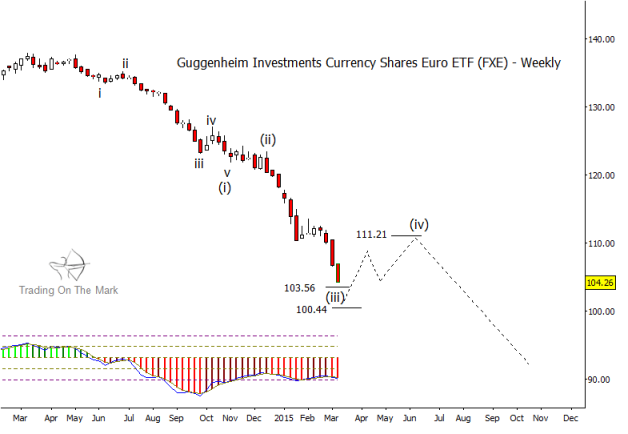
- Andy Nyquist retweeted See It Market @seeitmarket – New Post: “Euro & US Dollar ETFs Nearing Countertrend Moves” http://www.seeitmarket.com/euro-us-dollar-currency-etfs-nearing-countertrend-moves-14183/ … by @TradingOnMark $FXE $UUP
- The weekly chart for the CurrencyShares Euro ETF (FXE), which corresponds to a long position in EUR/USD, shows nearby extension targets that should act as a base for an Elliott fourth wave. The path we have drawn on the chart below is speculative, as there are a variety of forms that a fourth wave can take. However, a typical retracement target measured upward from the 100.44 support level would be around 111.21. We will be able to refine the upward target when the actual price low for wave (iii) becomes clear.
Is anyone ready for a sharp retracement in the USD-Euro price? And what would happen to the DAX if the Euro rallies hard in a squeeze?
- Northy @NorthmanTrader – #DAX: Up 27% in 9 weeks since January lows. Up 43% in 5 months since October lows. But it’s different this time.

5. U.S. Equities
Kudos to two long term bulls who turned cautious this past Monday just before the declines of this week.
- Jeremy Siegel of Wharton on Monday on CNBC Squawk Box – “If we’re going to get a June rise, there are going to be some ripples in the stock market before this is over, … I certainly would not be surprised to see a correction in the next three months that brings the market, down maybe 5 percent to 10 percent.”
- Sam Stovall, U.S. equity strategist at S&P Capital IQ – “believes the S&P 500 likely will enter a correction phase, defined as a drop of more than 10 percent but less than the 20 percent move that would constitute a bear market“
Gregory Hayes of United Technologies termed valuations of US companies as “sky-high”. Simplistically speaking, valuations tend to become sky-high when equity allocations are at an all-time high.
- Dana Lyons @JLyonsFundMgmt – (Post) 401(k) Stock Allocation Highest Since 2007 – via @YahooFinance $SPY http://tmblr.co/Zyun3q1ffqnAb
- “More than 7 years after the cyclical top in 2007, 401(k) investors are finally getting more comfortable with stocks again. According to Aon Hewitt, the average percentage of 401(k) accounts allocated to equities reached 66.5% in February. While still below the May/June 2007 cycle peak of 69%, this is the highest level since December of 2007. … One other point we will mention is that the “Household % in Stocks” series has surpassed its 2007 peak.”

And conversely,
- “According to Aon Hewitt, the biggest outflows from stock funds during that period occurred near the market lows in February 2003 and October 2008“
If the above 2007 comparison is not enough, see
- James Goode retweeted – jeroen blokland @jsblokland – Here’s a chart to get you nervous. Equity market rally matches those in the years up to 1929 & 1999. via @KarelMercx
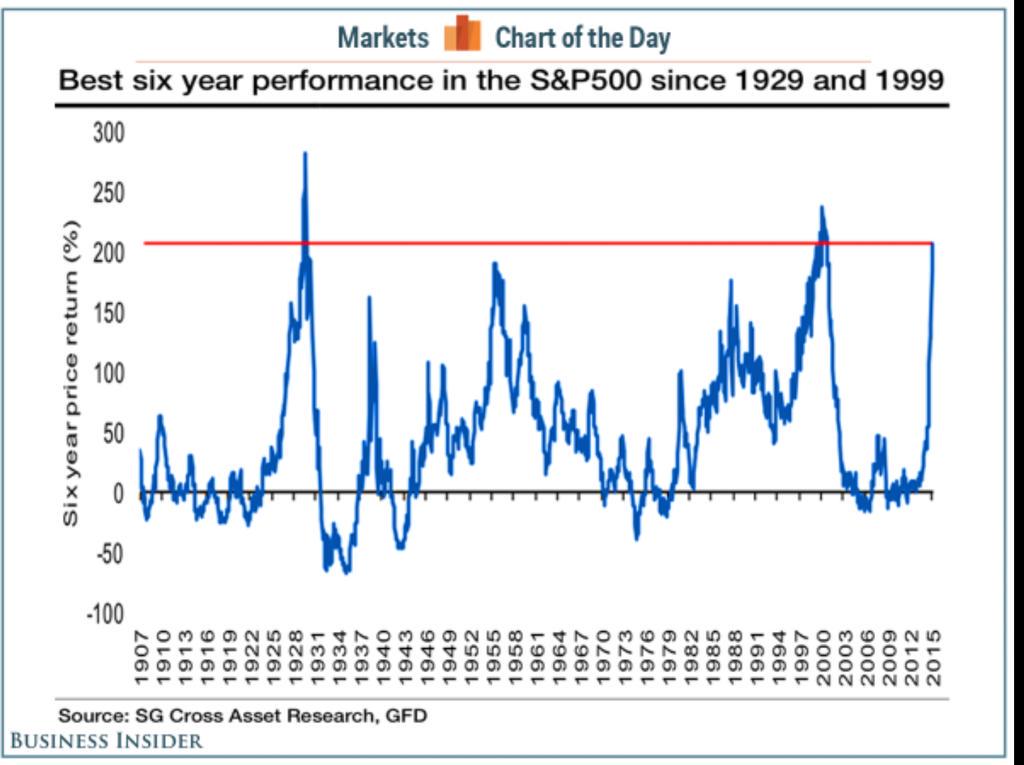
After these scary charts & warnings from Siegel & Stovall, wouldn’t it be ironic if the U.S. Equity market rallies next week with the Fed sounding dovish, with Dollar retracing & due to oversold conditions?
6. Relative Value or Leading Indicator?
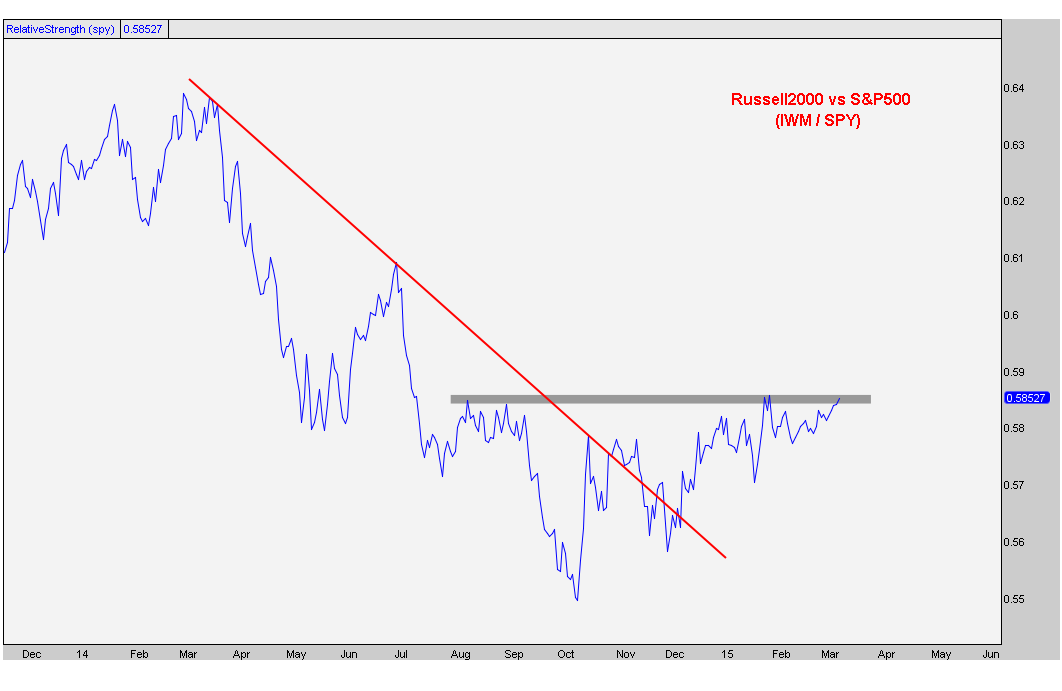
Russell 2000 & its ETF, IWM, outperformed this week by about 160 basis points.
- Friday – Karl Snyder, CMT @snyder_karl – $IWM performing nicely. relative strength impressive
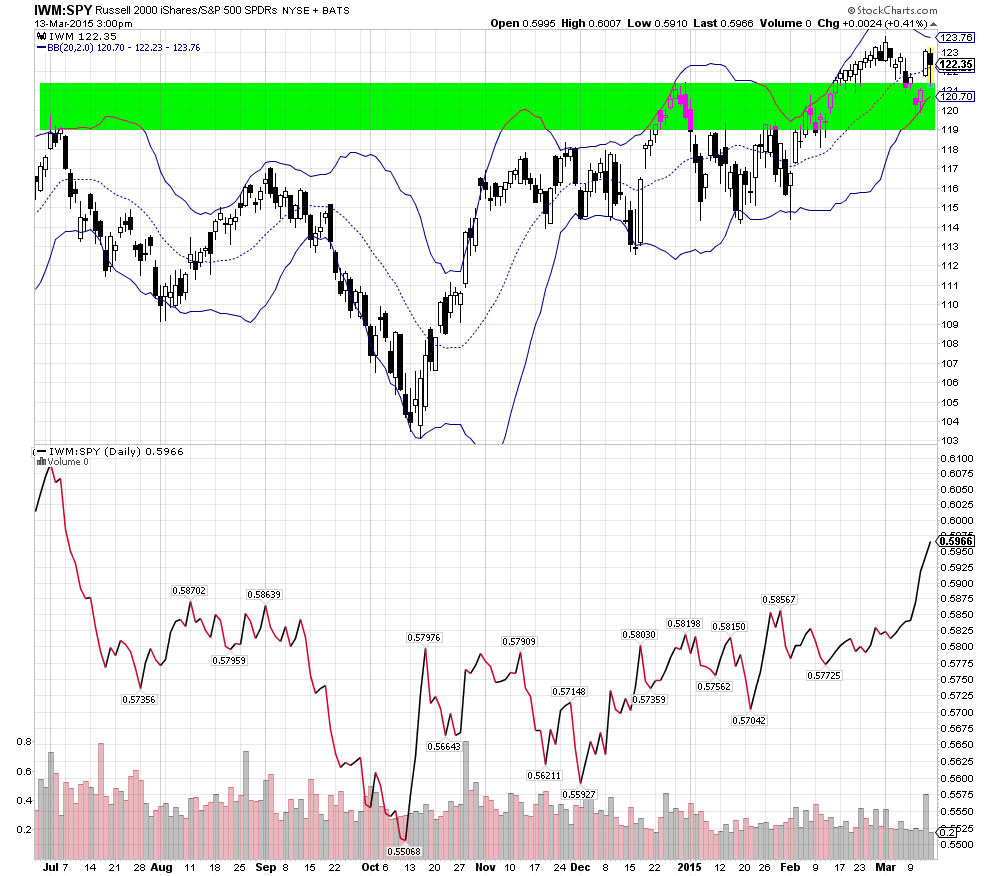
Kudos to J.C. Parets who alerted his readers on Tuesday in his article Small-Caps Could Be Emerging As New Leaders.
He followed up on Wednesday:
- J.C. Parets @allstarcharts – New 8-month highs today in Small-caps vs Large-caps ratio, specifically $IWM vs $SPY interesting developments this year. Different than 2014
7. Oil
Oil had a horrible week with USO, the WTI ETF, down 7.5%, and BNO, the Brent ETF, down 8.5% on the week. The story was all about running out of land storage in a month or two. The old adage about low prices becoming the cure of low prices is not playing out. Falling rig count is simply not curing the excess production of oil.
- Friday – John Kicklighter @JohnKicklighter – A fresh 5-year low in active oil rigs according to Baker Hughes. Rig count will continue down even after oil levels
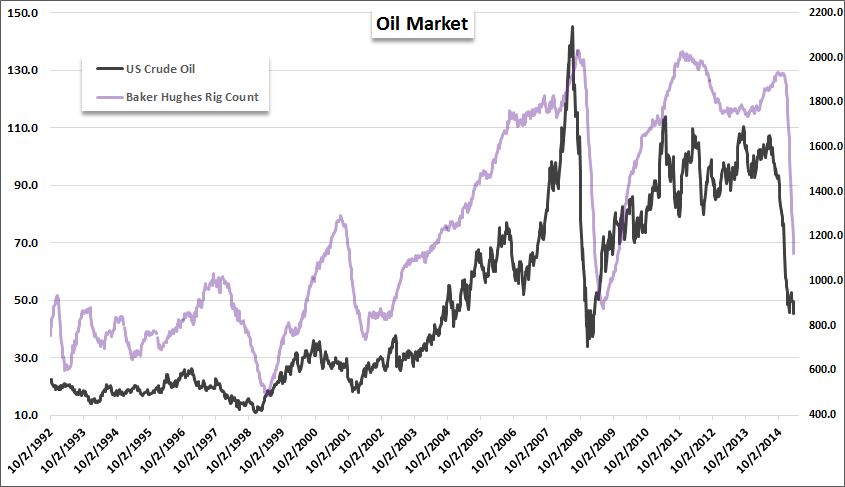
Why? Gary Shilling explained on BTV Surveillance on Monday:
- “Wood Mackenzie, an energy research organization, found that of 2,222 oil fields surveyed worldwide only 1.6 percent would have negative cash flow at $40 a barrel“
As a result,
- Bespoke @bespokeinvest – The current record 9-week increase in crude oil stockpiles exceeds the prior record by 60%. https://www.bespokepremium.com/think-big-blog/crude-oil-inventories-rise-to-a-less-than-expected-record-high/ …
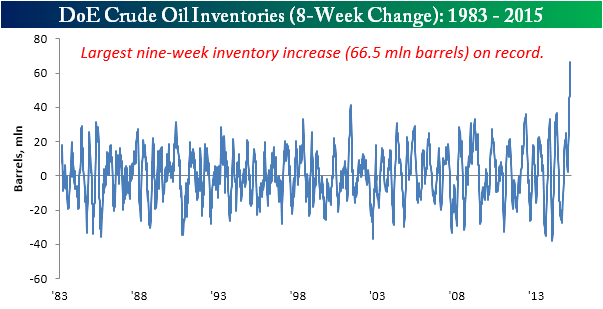
Goldman’s Gary Cohn gave voice to why and what might happen in a couple of months in his conversation with CNBC’s Carl Quintannia on Wednesday:
- “I am very much concerned about the short term window here in the turnaround cycle we have got going on in the US; we are coming out of the winter heating oil season; refineries are turning around refining capacity to manufacture more gasoline for the summer driving season; as they turn around refineries, they don’t need oil for weeks or months depending upon the turn around cycle and how much maintenance they do; that crude oil backs up in the system; I am concerned we are going to run out of storage, land based storage in the US especially in the mid-continent in Texas; and when we run out of crude oil storage, we really plummet the front end of the crude oil; so the forward prices could stay relatively stable but the headline may read we got $30 oil in the US;”
But the real reason Oil could remain low for awhile and could indeed plunge to $10 per barrel is demand destruction. That is what Gary Shilling argued on Monday on BTV Surveillance. Both Dr. Shilling’s track record and the deceleration in the global economy should dissuade people from laughing at this forecast.
And what about Gold? Jeffrey Gundlach said in his webcast on Wednesday that Gold could touch 1,400 in Dollar terms this year.
Send your feedback to editor@macroviewpoints.com Or @MacroViewpoints on Twitter

