Summary – A top-down review of interesting calls and comments made last week in Treasuries, monetary policy, economics, stocks, bonds & commodities. TACs is our acronym for Tweets, Articles, & Clips –our basic inputs for this article.
Editor’s Note: In this series of articles, we include important or interesting Tweets, Articles, Video Clips with our comments. This is an article that expresses our personal opinions about comments made on Television, Tweeter, and in Print. It is NOT intended to provide any investment advice of any type whatsoever. No one should base any investing decisions or conclusions based on anything written in or inferred from this article. Macro Viewpoints & its affiliates expressly disclaim all liability in respect to actions taken based on any or all of the information in this article. Investing is a serious matter and all investment decisions should only be taken after a detailed discussion with your investment advisor and should be subject to your objectives, suitability requirements and risk tolerance.
1. Confusion Laid to Rest?
Last week, we opened with confusion reigning about the economy – weak PMI data, weak GDP but strong employment numbers. Last month’s stunning 295,000 jobs number had conditioned people to expect a steady trajectory of good payroll numbers. The big drop in jobless claims on Thursday lent credence to the strong employment assumptions. Then came Friday’s shocker of 126,000 jobs. The Household survey was even worse at 34,000 increase. And prior good numbers were revised down by 64,000. Awful.
But which had a bigger market impact? This Friday’s shocker or the stunner on Friday, March 6?
- This Friday – 30-yr yield fell 3.6 bps, 10-yr yld fell 6.4 bps, 5-yr fell 8.9 bps, 3-yr fell 7.2 bps, 2-yr fell 0.6bps
- Friday March 6 – 30-yr yld rose 13 bps, 10-yr rose 13.5 bps, 5-yr rose 12.6bps, 3-yr rose 10.6bps, 2-yr rose 8.4bps
No contest here. The March 6 stunner had nearly twice the impact as this Friday’s shocker. Why? All we can offer are questions. Do they expect this week’s shocker to be revised next month just as the March 6 stunner was? Do they think this shocker is mainly weather related and will be reversed as in 2014? Or was much of the impact already realized in the bond market via the Fed on March 18 and via weak PMI data? The 30-yr yield has fallen by 36 bps, 10-yr by 40.5 bps, 5-yr by 44 bps, 3-yr by 35 bps & 2-yr by 24 bps from March 6 to April 3. So was the drop in yields on Friday just the icing on the cake that has been baking for the past month? Or was it simply the holiday session?
Notice that the 30-5 yield spread steepened on both payroll days – bear-steepened on March 6 and bull-steepened on this Friday. Is it simply because the volatility is shifting to the short end of the curve? Is that because of the shift in economic trajectory is becoming more rapid or because Fed is getting more & more data dependent? The inexorable trend of 2014 was flattening of the 30-5 year yield curve from 223 bps to 110 bps. This year it has widened from 110 to 123 bps.
A bear-steepening is easy to understand – Fed hiking rates in a strengthening economy will drive 5-year yields higher faster while low inflation moderates the rise in 30-year yields. But why the bull-steepening? Remember the yields on Tuesday May 21, 2013, the day before Bernanke dropped the Taper-bomb? The 5-year yld was 82 bps, while the 30-yr & 10-yr yields were 3.13% & 1.93% resp. If the economy is not able to get off the mat, shouldn’t the 5-year yield fall below pre-taper levels just as the 30-yr & 10-yr have? Or is the bull-steepening on bad data an early sign of new QE ahead?
The data & the bull-steepening seems to give credence to what Sam Zell told CNBC Squawk Box on Wednesday:
- “There’s a significant and growing disparity between the stock market and the economy”
Is that why Dow Futures ended down 200 points & S&P futures down 20 on Friday? Monday should be an interesting day.
2. April & US Equity Market.
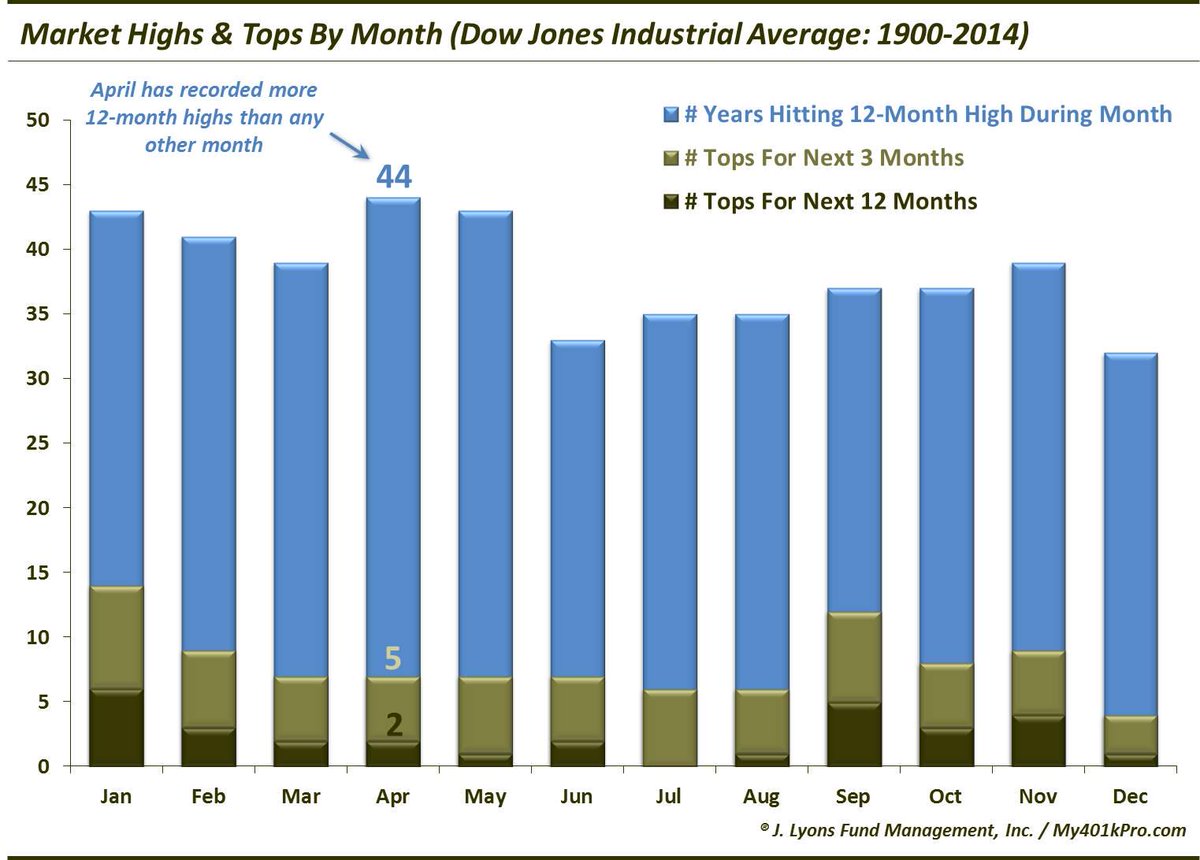
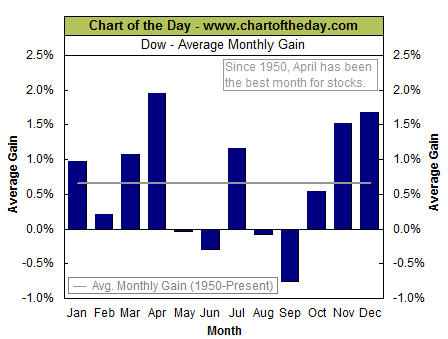
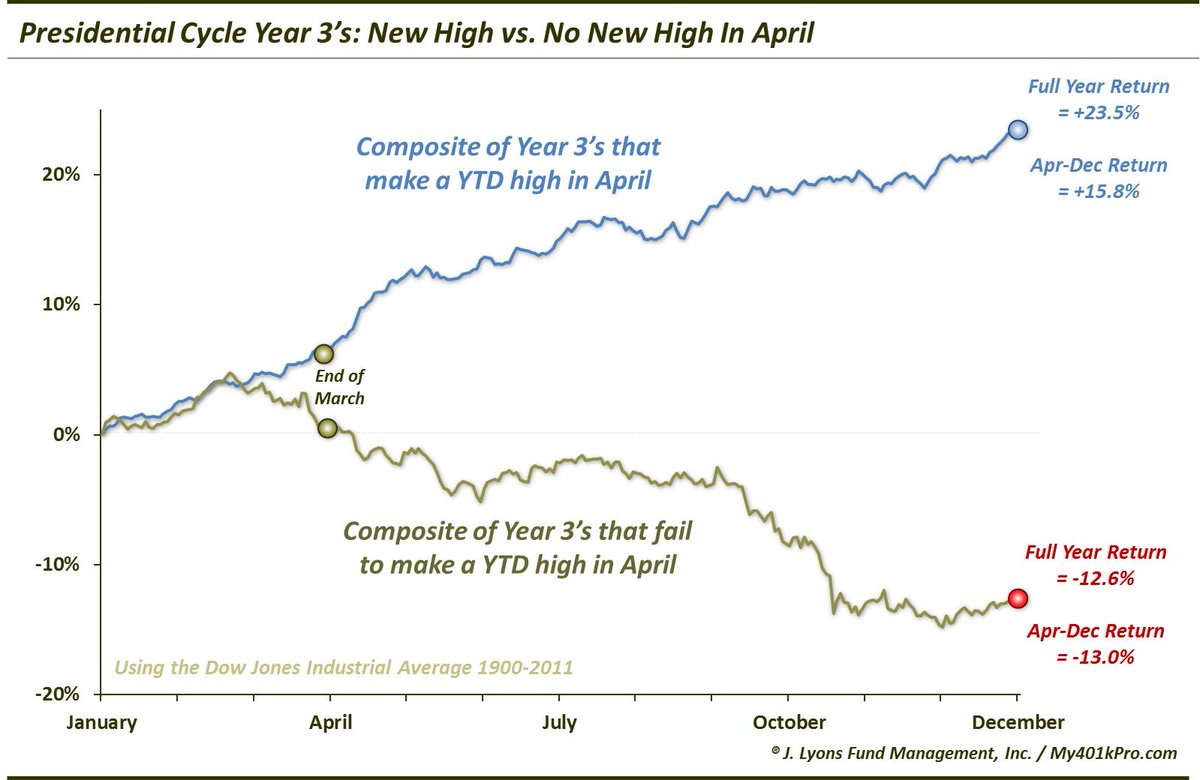
Three simple tweets & charts suggest that April is a critical month.
- Tuesday – Dana Lyons @JLyonsFundMgmt – ChOTD-3/31/15 April Has Recorded More 12-Month Stock Market Highs Than Any Other Month $DIA $DJIA
- Wednesday – J.C. Parets @allstarcharts – Since 1950 April is best month of the year for the Dow Jones Industrial Average $DJIA then tends to struggle til Fall
And the most explicit:
- Thursday – Dana Lyons @JLyonsFundMgmt – ChOTD-4/2/15 Presidential Cycle Year 3’s: New YTD High vs. No New YTD High In April $DIA $DJIA
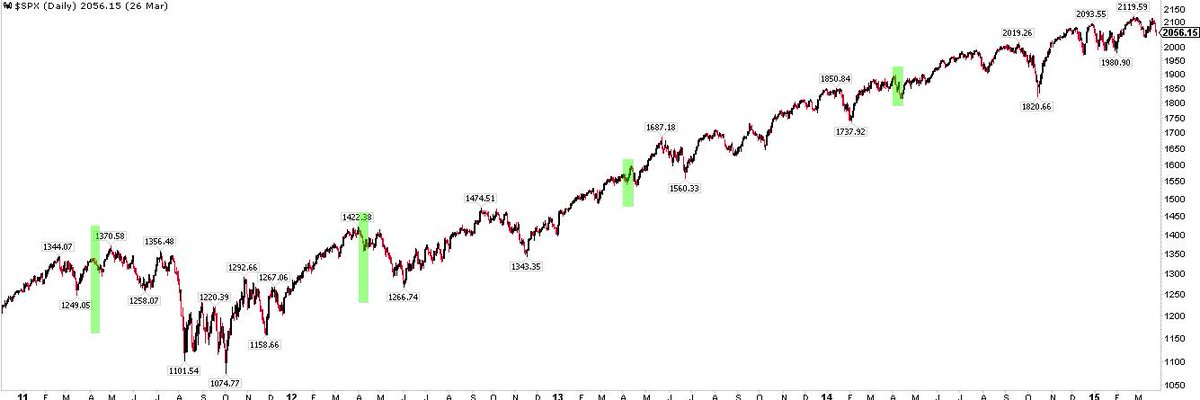
A tweet & chart from last week seems relevant here:
- Friday March 28 – Urban Carmel @ukarlewitz – The 1st two wks of April are supposed to be strong, but they’ve been crap the past 4 yrs. 2nd half of month better
3. Equity Opinions
- Friday – Ralph Acampora CMT @Ralph_Acampora – Dow Theory, Part III: Thursday the DJ Transport Average broke below its January 30th support level. Further weakness is expected.
Carter Worth went farther on Tuesday on CNBC Futures Now:
- “while the S&P 500 has maintained its uptrend, major sectors within the index have failed to make new highs. This, according to Worth, is a bearish sign of what’s to come…”
- “The issue from my point of view is always trying to come to a judgment about the market, not so much by looking at the market, but by looking at the parts that comprise the whole,” said Worth. “So while the chart of the S&P might say one thing, the other parts are giving a different message and that’s been the case for the better part of the past 10 to 12 months.”
- “We’re the same price right now [in the NYSE Composite] as we were 10 months ago. We’ve made no progress,” said Worth. “More often than not history shows that when you get deterioration in certain parts [of the market], you get deterioration in the whole.”
- I think the best thing we are hoping for is a ’98 type outcome,” said Worth, referring to the 18 percent decline in the S&P 500 from July 1998 to September 1998. “We saw a huge downdraft and then we recovered. We need a reset.”
Similar sentiment for the short term:
- Thursday – Urban Carmel @ukarlewitz – What’s needed is a more complete sell off to set up a rally that has some upside. Incomplete sell offs lead to weak rallies
What about support during a fall?
- Thursday – Karl Snyder, CMT @snyder_karl – S&P 500 Support Levels via @seeitmarket http://stks.co/c1zHJ
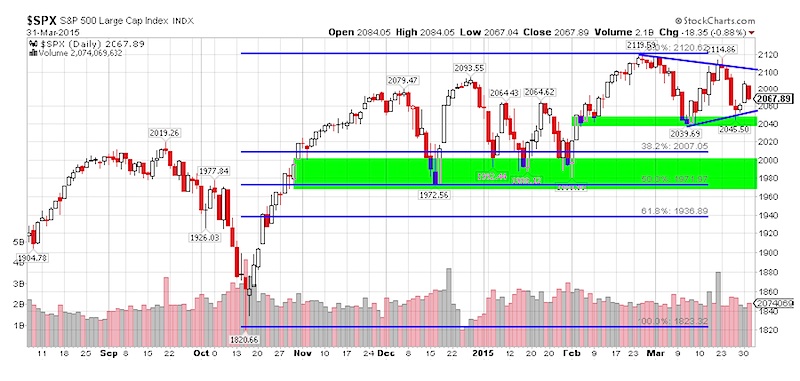
- “The S&P 500 (SPX) has been in consolidation mode since early March, forming a wedge pattern. Since the longer-term trend is higher, a breakout to the upside seems logical. However, we need confirmation and could continue to see more distribution. … Keep in mind most pullbacks occurring over the last two years have been between 3.5-7.0%, which suggests 2040, and 1970 respectively to be on our radar for support.”
And for looking past any valley:
- Wednesday – Mella @Mella_TA – Everyone is still a dumb bear lol. U all like bear targets but hate bull targets ! I’m still expecting $SPX 2250 + up next. #BTFD
4. Dollar-Euro, Gold & Oil
What did the 126K jobs print do to the USD-Euro pair?
- Friday – Lorcan Roche Kelly @LorcanRK – Euro USD!
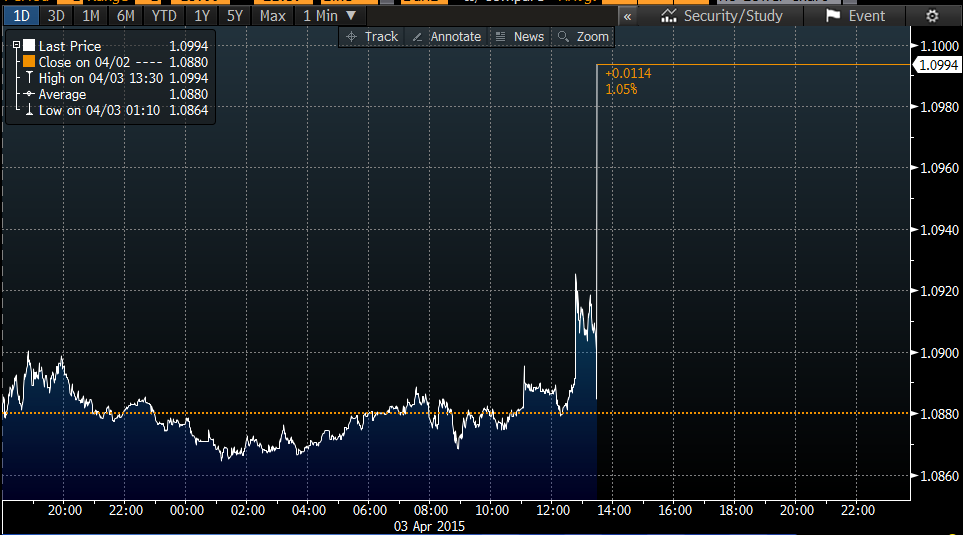
The Euro did back away from 110 level to close around 1.0978. Will this 126K number persuade Euro-USD shorts to cover at least partially? That goes to their conviction and the winter is over & summer is nigh sentiment.
Shouldn’t this be positive for Gold? At least Friday’s action matches the assumptions of Dollar churning & rates falling assumptions made last week by MacNeil Curry of BofA-ML in calling for Gold to get to $1307.
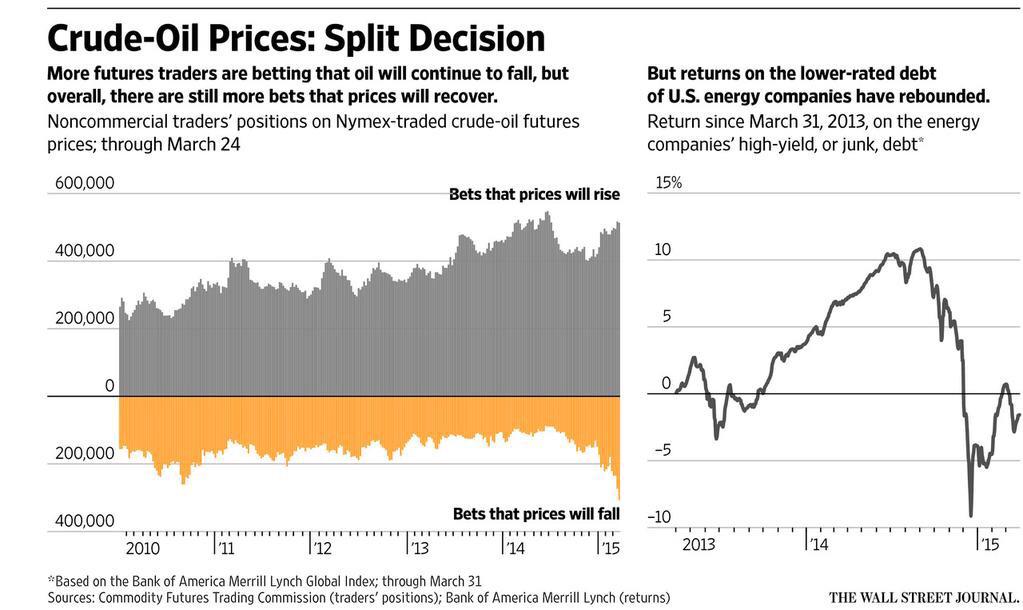
How will Oil behave next week? A weak dollar should be a positive but what about the negatives arising from the US-Iran deal? We hear so much about a flood of Iranian oil waiting to be unleashed on the market. This was supposed to cause a steep fall in crude. But the oil market defied this at least on Thursday afternoon. Both USO & BNO dropped but recovered to close well above their lows. USO only closed down 11 bps. BNO closed down 2.75% but above the 4%+ fall intra-day. And then,
- Thursday – Nick Timiraos @NickTimiraos – Net long positions on oil are at their lowest level since December 2012 http://on.wsj.com/1Cxt5G2 via @pat_minczeski
As we said, next week should be really interesting.
5. Featured Videoclip
We think the videoclip of Gary Cohn on BTV Market Makers is a great watch. It is too detailed & offers some different perspectives that are difficult to encapsulate in our sections above.
Watch the clip and/or read the summary provided by the good folks of Bloomberg Television PR.
GARY COHN:
- Right now we’re still in the mid to high $40. We’ve been ticking around $45 – $50. And what I said recently is I think the front end of oil can go down. And I think we’re getting to that point. If you look at the storage capacity in the mid-continent of the United States, we’re basically close to capacity. So if much more oil comes into the system in the United States, we’re going to fill up capacity. We’re going to fill up storage. We’re going to have to price in more contango to attract in more storage.
- So what I think we’re going to see happen is the front end of oil come down, the back end is going to stay unchanged, and the contango’s going to widen. That still means we’re going to wake up to one day where we see a headline where the spot price of oil is substantially lower than it is. And I still believe that’s going to happen.
- And a little bit of it is the extra supply but as you get into the turnaround cycle, refiners change their refining mix in the spring and the fall. Right now we’re changing from a heavy heating oil mix to heavy gasoline mix. And when they change that cycle, they stop consuming crude oil for a few weeks while they change. So we’re seeing crude oil back up in the system right now.
- So I still believe that’s going to happen even though we’ve seen this recent correction. There’s still correction has meant that we’ve traded between this $45 – $50 range.
STEPHANIE RUHLE: Distressed and high yield guys seem to think that oil is the holy grail right now, amazing opportunities.Do you agree?
COHN:
- I don’t really agree. I think we’re at this price level for a relatively long period of time. We’ve got a lot of supply of oil in the system and we’re continuously building supply. The new trend that’s going on that’s quite interesting is because there’s no demand for new wells, oil rigs, drilling rigs, have become very cheap.
- So what’s going on right now is people are starting to drill a lot of wells. They’re drilling the wells and they’re just capping the wells. They’re not fracking them; they’re not bringing them on production. That means you can drill the well, you can cap it, you can sell the forwards against it. If the price of oil goes up, you frack the well and you deliver into it. If the price of oil goes down, you back your hedges.
- So there’s going to be some natural cap in the oil market for the relatively near future, so I don’t believe the price of oil by itself is the next great trade. I do think there are going to be some distressed assets that come back if the price of oil stays this cheap this long, and I do think that’s going to happen. But it’s going to take some time for that to work through the cycle.
RUHLE: Do you think Janet Yellen is substantially different than you were expecting? I mean, we thought she’d be patient. We thought she’d be so dovish. That’s not the case.
COHN:
- I still think she’s going to be patient. … I still think she’s going to be dovish. I’ve been saying that for a long time. I still think that she’s got to be patient. I understand that Janet Yellen wants to, and I understand the need that she really wants to raise interest rates. If you were Janet Yellen, you would want to raise interest rates; you’d want to have the ability to lower interest rates if something went wrong. There’s nothing scarier than being head of the central bank and not having the ability to stimulate the economic cycle. That’s a bad position to be in.
- So I understand her position. On the flip side, she’s got a dual mandate. She’s got an employment growth mandate and she has an inflation mandate. There’s no inflation in the system; there’s no signs of inflation in the system. I think Q1 GDP is going to be lower than people think. I think Q1 earnings are going to be lower than people think. And I think she’s going to continuously be in this tough position of intellectually wanting to raise interest rates but fundamentally not being able to.
RUHLE: See, I think there’s nothing scarier than being a central banker in Europe. I mean, at least Janet Yellen is standing on top of a strong economy. What do you think of the state of Europe right now?
COHN:
- Well, a stronger economy. … I think the European Central Bank’s simple. They’re in a devaluation of the euro transition (ph). I mean, they’ve made it quite simple. We’re in, what, week three or week four of QE? They’ve got many, many more weeks ahead of us. They’re going to continue to buy debt in Europe. You know, the only parameter they’ve put on themselves is they won’t buy below minus 20 basis points and they won’t own more than 25 percent of any outstanding issue. But that’s the only parameters and we’re just at the beginning of this process in Europe, which I think will continue to lower rates in Europe, which will continue to put pressure on rates in the United States, which will continue to be deflationary for the United States.
Send your feedback to editor@macroviewpoints.com Or @MacroViewpoints on Twitter