Editor’s Note: This is an article that expresses our personal opinions about comments made on Television, Tweeter, or in Print. It is NOT intended to provide any investment advice of any type whatsoever. No one should base any investing decisions or conclusions based on anything written in or inferred from this article. Macro Viewpoints & its affiliates expressly disclaim all liability in respect to actions taken based on any or all of the information in this article. Investing is a serious matter and all investment decisions should only be taken after a detailed discussion with your investment advisor and should be subject to your objectives, suitability requirements and risk tolerance.
Regular readers might recall that we highlighted the bullish turn in the Indian stock market and the Indian Rupee on Wednesday, August 28, 2013, the day the Rupee went below 68 relative to the U.S. Dollar. It has been a glorious ride. Readers may also recall that we warned about a potential correction in the Indian Stock market on February 28, 2015.
That short-term warning came from Dana Lyons of J.Lyons Fund Management. His key chart is reproduced below for convenience.

This warning proved true. Since our article, the Sensex has fallen by over 2,000 points (7.5%) from 29,220 on February 27 to 27,011 this Friday. Kudos to Mr. Lyons for a terrific call.
We saw a tweet and its embedded chart this Friday that readers might want to see and ponder.
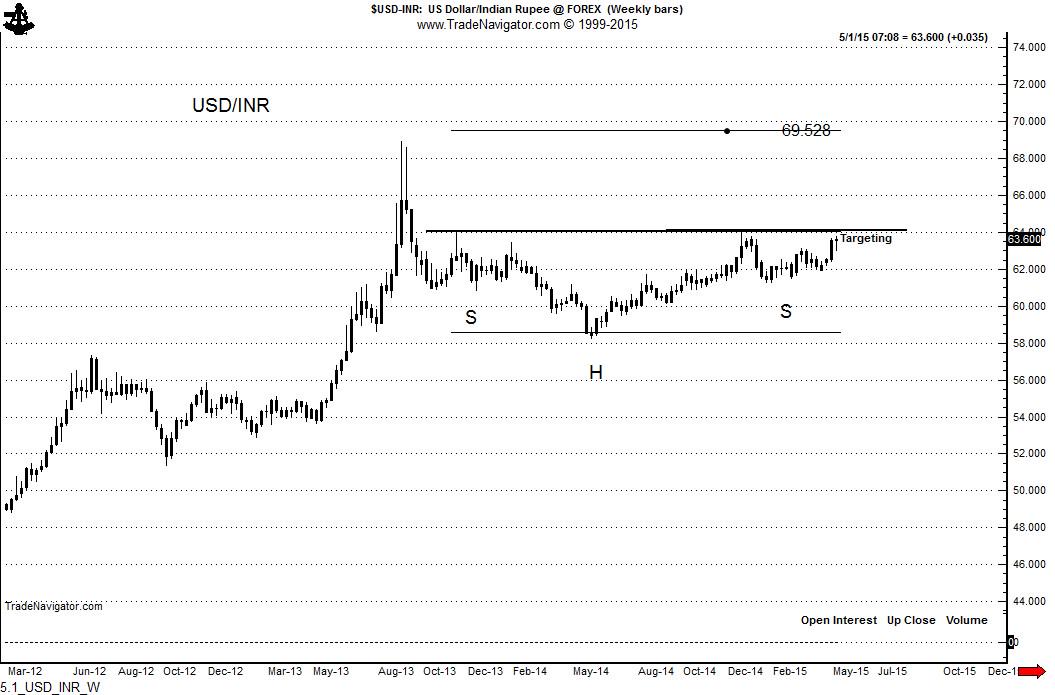
- Peter Brandt – @PeterLBrandt – Indian Rupee #RUPEE getting ever so close to completing an inverted H&S pattern. $USD/INR

A Head & Shoulders (H&S) pattern is a widely followed bearish pattern in analysis of financial charts. An inverted H&S pattern as shown above is a bullish pattern. The first decline & rally forms the Left Shoulder – the one from August 13 to December 13. The next bigger decline down to 58 in May 2014 forms the Head. The next decline virtually at the same level as the first decline forms the Right Shoulder in this case from say December 2014 to April 2015.
This pattern does not become effective or actionable until the “neckline” just above the right shoulder is decidedly broken. That potential break is what the above chart is warning. Because if the right neckline (drawn above) is decidedly broken, then there is nothing but free air above. Depending on your pen, the shoulder line break would occur between 63.6 and 64. If it were to break, then the inverted H&S pattern would target Rs. 69.52 for the Dollar-Rupee ratio.
Remember technical charts are simply techniques and are not to be taken as guarantees of any kind. They are useful because they represent patterns that have worked in the past and because many, many traders act on them thereby making them worthy of following. So the above doesn’t mean the Rupee will fall to 69.52. Remember the pattern gets nullified if the right shoulder line does not break. And even if it breaks, it doesn’t mean the fall will be as far as 69.52.
But the chart does represent a bearish warning. And that ties in with the macro risk for India we discussed in our March 14 article. We are bothered by an anomaly that we are seeing. Usually the Dollar-Rupee ratio goes up when the US Dollar rallies. But for the past month, the Dollar-Rupee ratio is rising even when the Dollar is falling against other major currencies. That is unusual and may reflect intensifying worries about India and Indian markets. Oil is up 20% plus in April and that is not a positive for India. US & European interest rates have begun to rise and that makes Western Fixed Income investments a little more attractive than before.
But the bigger concern might be about the relative strength of the Modi administration. Notice the peak of the Rupee or the lowest level of Dollar-Rupee in the above chart was in May 2014, the month PM Modi won his huge election victory. Belief in PM Modi is the biggest reason for over-weighting India and we wonder if that belief is eroding.
Hopefully, the Rupee rallies in May and the right neckline is not broken. But if does, at least we have made you aware of that risk.
Send your feedback to editor@macroviewpoints.com OR @MacroViewpoints on Twitter