Summary – A top-down review of interesting calls and comments made last week in Treasuries, monetary policy, economics, stocks, bonds & commodities. TACs is our acronym for Tweets, Articles, & Clips –our basic inputs for this article.
Editor’s Note: In this series of articles, we include important or interesting Tweets, Articles, Video Clips with our comments. This is an article that expresses our personal opinions about comments made on Television, Tweeter, and in Print. It is NOT intended to provide any investment advice of any type whatsoever. No one should base any investing decisions or conclusions based on anything written in or inferred from this article. Macro Viewpoints & its affiliates expressly disclaim all liability in respect to actions taken based on any or all of the information in this article. Investing is a serious matter and all investment decisions should only be taken after a detailed discussion with your investment advisor and should be subject to your objectives, suitability requirements and risk tolerance.
1. What’s gives
with the economy? The old reliable seer named “Rosie” wrote on Friday in his weekly summary:
- “Things are looking up – For a country with an ever dwindling supply of labor, churning out 223,000 new new jobs as was the case in April is hugely constructive … The jobless claims are a leading indicator and have already declined to a new 15 year low as we move into May”
On the other hand, almost every piece of data came in weaker.
- Charlie Bilello, CMT @MktOutperform – US economic data relative to expectations continues at weakest pace of the expansion in 2015 thus far…
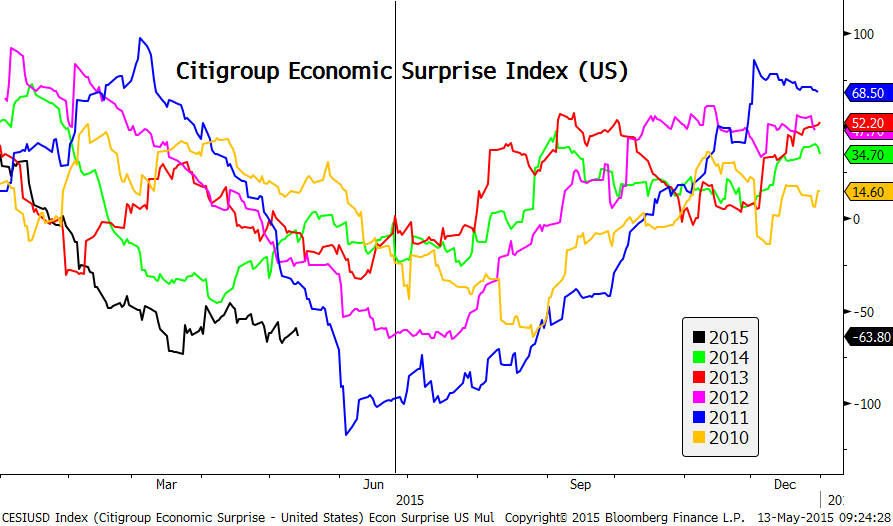
Perhaps the problem is with expectations. And most negative figures can be explained away like weak retail sales were skewed by 20% drop in gas sales, or weak industrial production doesn’t really tell an accurate story because, say,
- Urban Carmel @ukarlewitz – Industrial production is a very noisy series. Todays decline is not unusual. It was lower in 1993, 1996 and 2005. Oil and gas is the culprit
So, weakness in the economy that results from oil & gas collapse is really not a weakness of the economy? Frankly, data schmeta! What is important is what it is doing to the Fed? Since they don’t tell us, what are the inferences of the market?
- Michael McDonough @M_McDonough – Changes in the Fed Funds Target vs. Bloomberg Economic Surprise Index (BLink:http://bloom.bg/1Jl6nVK )
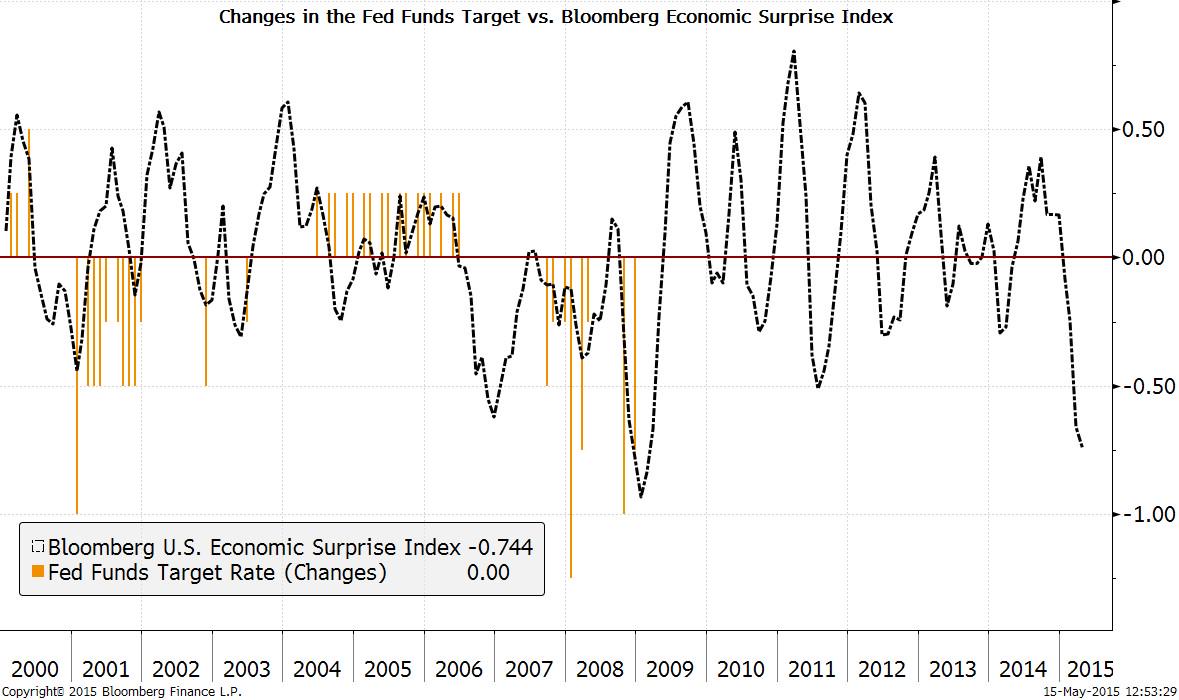
May be the problem is with the Bloomberg Economic Surprise Index:
- Jim O’Sullivan @osullivanEcon – Michigan expectations series still implies better trend in spending than is evident in latest data
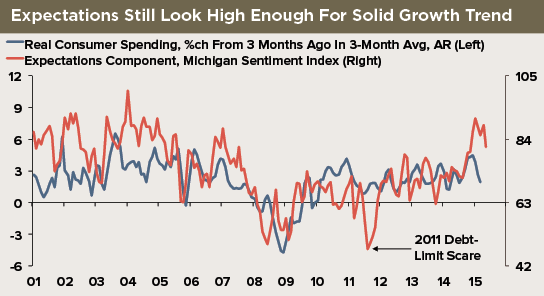
And income trends should suggest more spending given the steady strength in Jobless Claims. The moment you say “got it”, you see the following:
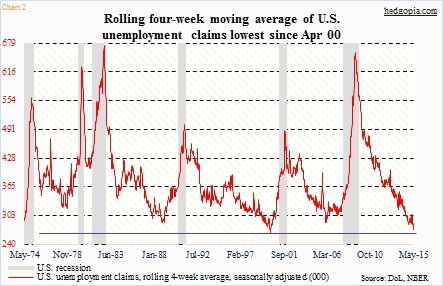
- See It Market @seeitmarket – New Post – “Are Unemployment Claims Nearing An Inflection Point?” http://www.seeitmarket.com/
are-unemployment-claims- nearing-an-inflection-point- 14363/ … by @hedgopia #FF $MACRO $FED
- “… we have to wonder if this is as low as claims can go. After all, 15 years ago, they started rising from around these levels. Having said that, back in 1972-73, unemployment claims remained under 300,000 for an extended period of time, before bottoming in the latter months of 1973. The economy went into a recession in 1974. This time around, claims have remained under 300,000 since last September, except for a few weeks.”
- “The attempt here is not to suggest that we are headed for a recession. Who knows anyway? We will leave that up to economists. But if macro data do not begin to improve soon, the claims data could very well be at an inflection point.”
The above is why we keep asking ourselves what gives with this economy?
2. Euro-Dollar.
Sounds weird to say this but Europe seems to be doing better:
- Lisa Abramowicz @LisaAbramowicz1 – The euro-area economy likely grew at the fastest pace in almost 2 years in Q1 on the heels of the ECB’s stimulus. http://bloom.bg/1bL8nZT
And,
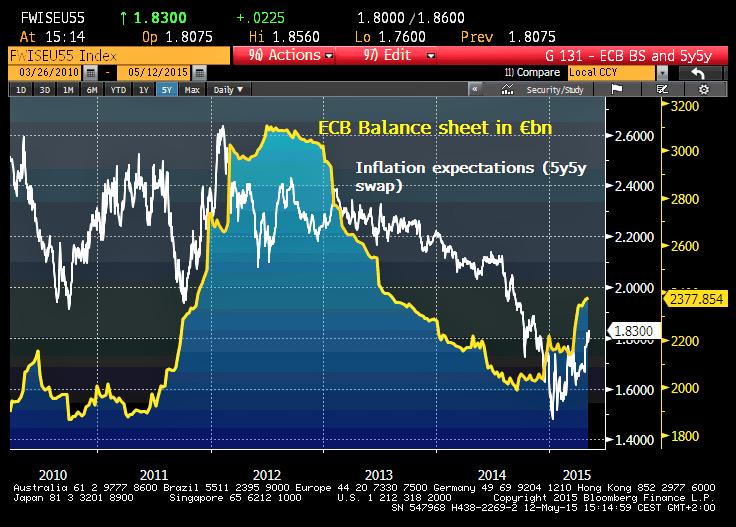
- Holger Zschaepitz @Schuldensuehner – Draghi seems to win the QE battle. Inflation expectations, measured by 5y5y swap, rise in tandem w/ ECB balance sheet
No wonder, Forexlive wrote:
- “EUR is the strongest currency this week. The weakest was the NZD. The EUR benefited from a strong 2.2% gain vs. the USD. That pair bottomed on Monday and rallied higher on each subsequent day of the week. The price traded at the highest level since February 6th.”
Another reason why the Euro is strong:
- Alasdair Pal ?@AlasdairPal – Getting out short euro trade is hurting trend-following hedge funds – & judging by positioning, still a way to go…
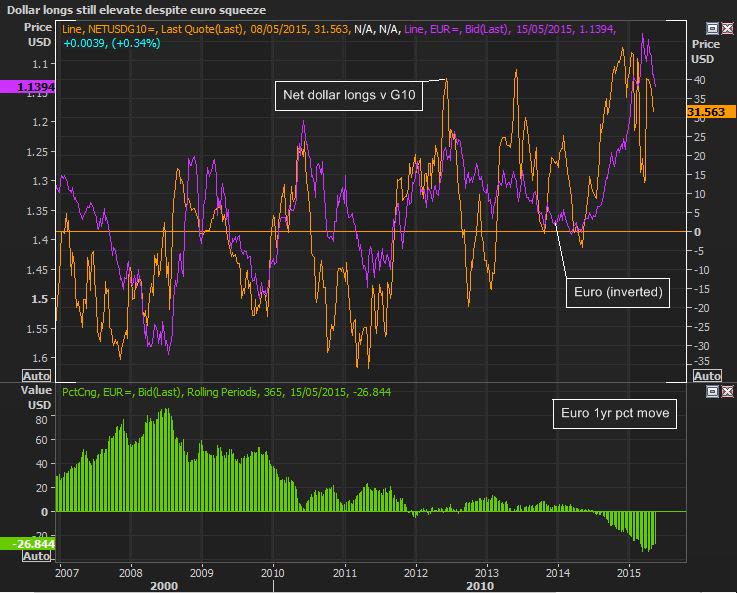
But how much of that positioning is in weak hands vs. strong hands? How we long for some chart or statistical analysis to show that distinction? Because the speed and extent of the move could just as easily call for a Dollar rally:
- Friday – Raj Dhaliwal ?@RSDTrading – EOD :Trades: New: Long $UUP Sept $25 Calls
Is the volatility driven by various trades that are in essence the same trade?
- @lemasabachthani this oil/eur/bund/dax correlation is a textbook
3. Treasuries – a position panic?
David Ader of CRT Capital used the term “position panic” in his conversation with Rick Santelli and added “prices have probably changed more than the facts“. Scott Minerd of Guggenheim expressed his frustration in his piece on Friday:
- “I can’t recall in my career where I had such an accurate forecast on the economy, and then was so surprised by the market’s reaction. Weeks before first-quarter U.S. gross domestic product (GDP) was announced, we were forecasting extremely weak economic growth—near zero or even negative for the quarter. Market consensus was 1 percent, so the shock of just 0.2 percent GDP growth should have driven rates down. Since 2010, GDP disappointments like this have led 10-year Treasury yields to fall by 5.5 basis points on average in the two days following the release. This time around, the opposite occurred—yields rose by double that, and continued to rise.”
He is absolutely right. Every piece of soft data generated a quick position reaction in Treasury prices which was viciously sold. It was as if every rally, however small, created a flight to liquidate long Treasury positions. The past 2-3 weeks have demonstrated that the long duration trade was global and a panicky liquidation of long Bund positions created a simultaneous selloff in Treasuries. It is only in a panic that neither data nor relative value matters.
- Polemic Paine ?@PolemicTMM – Things start to happen at 10am NY time in Bunds.

This week’s peak in yields was around 7-7:15 am on Tuesday morning when the 10-year touched 2.37% & the 10-year Bund 76bps. Friday’s close was much lower at 2.14% & 64 bps resp. To us, the tide turned on Thursday when the morning’s rise in rates was slowly taken away all day. Then on Friday, both German & UST yields fell hard and TLT rallied by about 3 points between Thursday morning and Friday’s close.
So is the rise in Treasury yields over?
- Art Cashin on CNBC – looks like that may be over
- Urban Carmel ?@ukarlewitz – Weekly 30 year treasury yield forming a text book gravestone doji $TYX
- Andrew Thrasher, CMT ?@AndrewThrasher – 10-year Treasury Yield is now back under it’s 200-week Moving Average. Unlikely to see a weekly close above that resistance level.
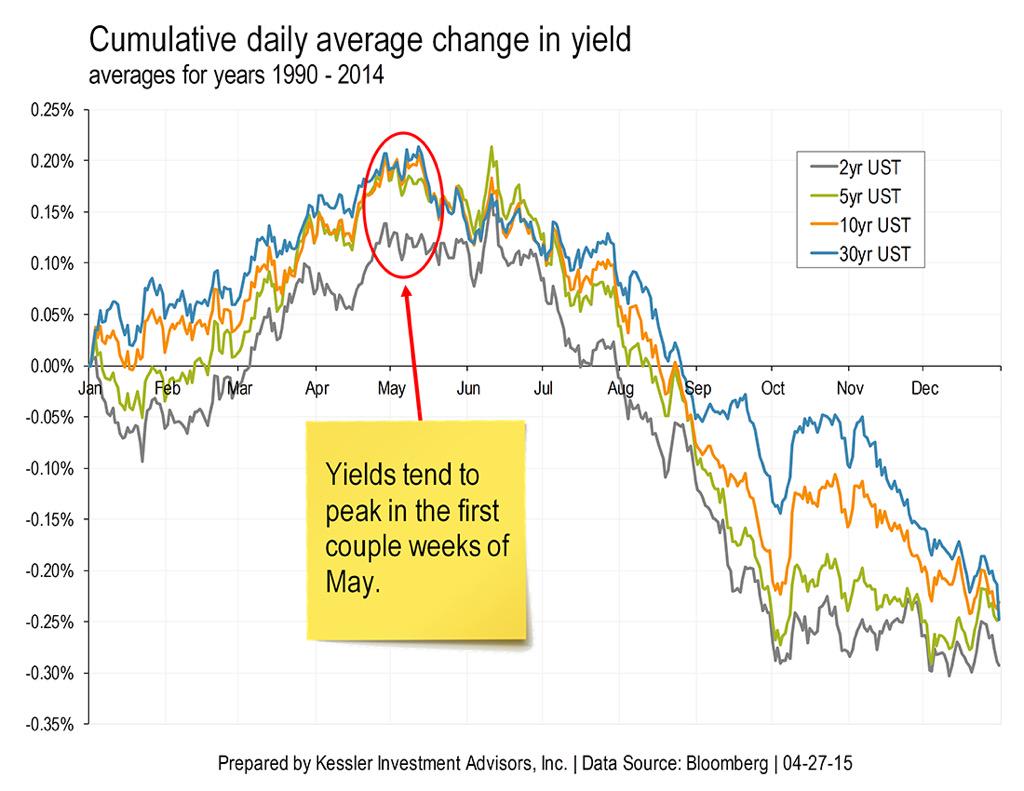
Our favorite measure has been the 200-day moving average and that needs to be decisively broken to the upside in Treasury prices & downwards in Treasury yields. Perhaps, the rally on Friday was triggered by Draghi’s comments about being steadfast in his QE. Perhaps, it was driven by an increasing belief that the Fed will be slower and later to raise rates. Our experience over the past ten years points to June being a month of reversal in Treasuries. But a smarter, wiser man says it is May:
- Monday – Jamie McGeever ?@ReutersJamie – This is about to severely tested: If last 25 yrs are a guide, US yields to peak in mid-May then tumble-Robert Kessler
This week reminded us of the auction week in June 2007. A bad 30-year auction created another ratcheting up of yields on that Thursday afternoon and the close was ugly. But, almost miraculously, yields began dropping on the next day. The fall in Treasury yields that began on that post 30-yr auction Friday kept going till December 2008. This Thursday’s 30-year auction was ugly and Treasuries sold off after that auction. We all saw the rally on Friday. The panic about higher yields seemed similar to what we recall of that week in June 2007. It remains to be seen if Treasuries act in 2015 the way they acted in 2007 post that 30-year auction in June 2007.
The real difference in the rally on Friday was the flattening of the 30-5 year curve with the 30-yr yield falling by 11.8 bps vs. 5.1 bps for the 5-year. Was this a countertrend snapback in the inexorable trend of 2015 – steepening of the curve? If so, what would that say about inflation & economy expectations in Europe & US? And would it say something about the Dollar?
- KimbleCharting – Chris Kimble – King Dollar and Bonds break support at the same time. Correlation surpris a few invetors? $EURUSD $TLT $UUP $USDJPY
4. Equities
There is a palpable sense of anticipation in the stock market:
- Antony Filippo ?@Vconomics – Big move coming after a period of consolidation. $SPX http://bit.ly/1JFv79g
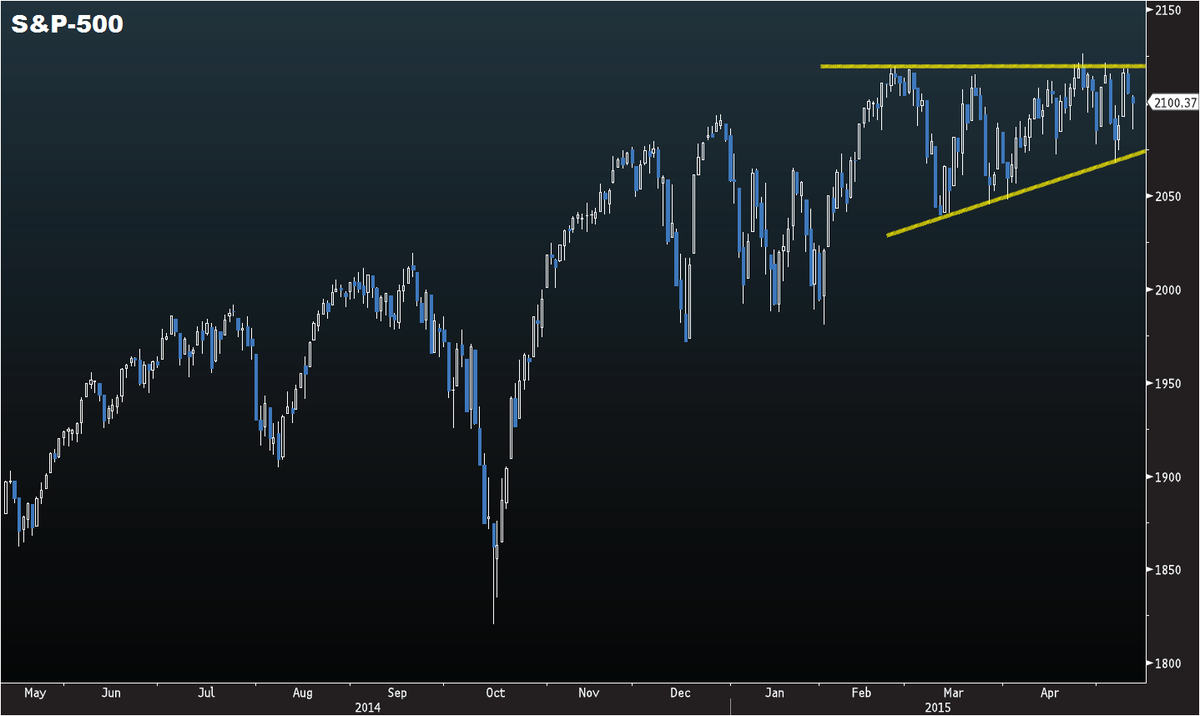
But in which direction?
- Wednesday – Joe Kunkle ?@OptionsHawk – Stocks had this same sideways chop Dec-Jan as Oil was getting slaughtered (and volatile) – we now appear to be waiting on Treasury stability
This is also consistent with what David Tepper said last week that either stocks go up big or bonds go down big. So if bond yields have topped at least for awhile, then stocks should take the next leg higher?
The S&P went to a new all-time high on Thursday, the same day bond & bund yields stopped ratcheting up. Was that the beginning of a breakout? Art Cashin scoffed on CNBC on Friday morning and said:
- “very, very, disappointing breakout; not really a breakout; just staying at the top of the range; we haven’t forced shorts to cover or drawn sideline money to come in“
A counter from,
- Mark Newton ?@MarkNewtonCMT – Lots of people quick to dismiss the Breakout given lack of followthrough today, but we still stand to make new Weekly All-time High closes
Is VIX still a reliable indicator?
- Lawrence McDonald ?@Convertbond – S&P 500 is trading in its narrowest intraday range (0.33%) since Christmas Eve. Via @bespokeinvest Big VIX spike back then 14.5 to 22
In this vein argues Dana Lyons in his article Stock Indicator Suggests Big Move (Lower?) Coming:
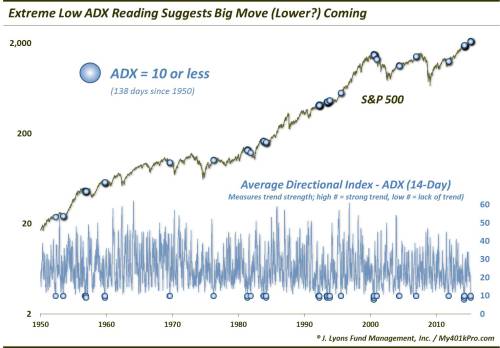
- “Many more of the readings, historically, have come near tops of intermediate to cyclical significance, including 1956, 1959, 1969, 1976, 1981, 1983, 2000, 2001 and 2007. Thus, the weight of the evidence is heavily skewed to a negative outcome.”
If the above makes it confusing, sentiment indicators seem make it even more so.
- Ryan Detrick, CMT ?@RyanDetrick – AAII bulls down to a new 2-year low. With $SPX making a new high that is simply amazing. $SPY

On the other hand,
- Helene Meisler ?@hmeisler – Last time the ISE was this high was 1/30/06 We had a little correction after that. 2-3%
And the ISE Index & ETF Call/Put Ratio registered its highest reading (228) in over 6 years, according to Dana Lyons:
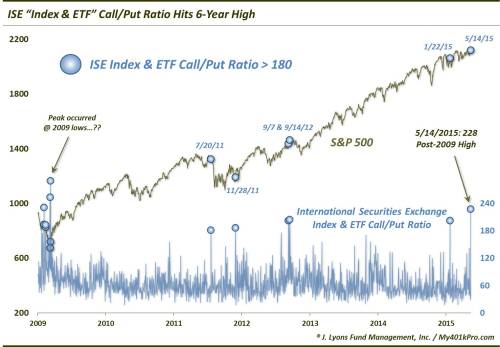
Once again, the sample size of this analysis is too small and the counterexample is March 9 & 11, 2009.
Isn’t all this a perfect opportunity to use Options? Use the low VIX to buy calls to go aggressively long or buy puts to go aggressively short or do both.
5. Oil
After 8 consecutive up weeks, Oil took a small breather this week. Is this a pause that refreshes? Once again, no shortage of opinions, technical or fundamental:
- Charlie Bilello, CMT ?@MktOutperform – Crude continues to progress towards the measured move target area around $63. $CL_F

- Blake Morrow ?@PipCzar – Looking ahead to next week, if Crude breaks 58 after failure at TL (red circle) a pullback to 55 seems likely USD/CAD .

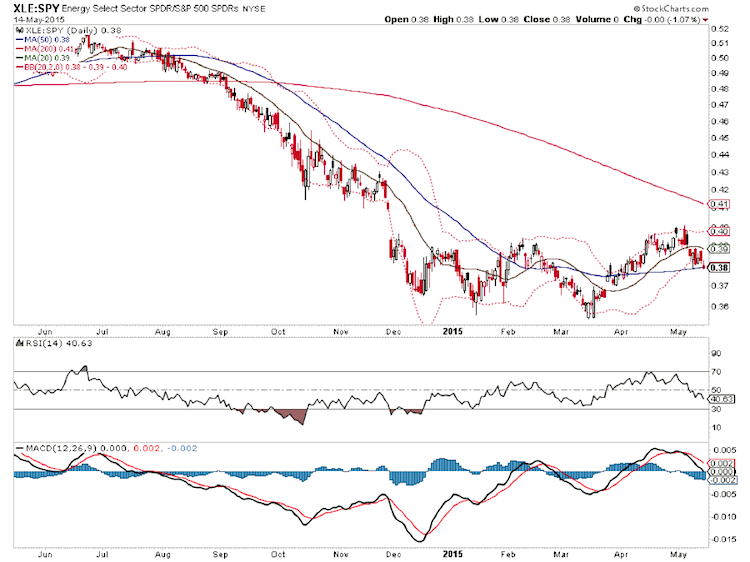
What about Oil stocks? Once again, a move in either direction in
- See It Market ?@seeitmarket – New Post – “Energy Sector (XLE): Acting Weak But Nearing Price Support” http://www.seeitmarket.com/energy-sector-xle-acting-weak-but-nearing-price-support-14367/ … by @ATMcharts $XLE
- “It’s worth noting the price and relative strength bollinger bands have expanded lower. Judging by the near-term action, I would expect a two point move in whatever direction the wedge breaks. With key support just below, let’s stay tuned to see if price and relative strength can rebound.”
6. Gold
Gold & Silver were unambiguous winners this week with Gold up 3% & Silver up 6%. And we saw two unambiguous calls this week:
- Ralph Acampora CMT ?@Ralph_Acampora – Silver broke above its choppy trading range when it pierced its 3/26/15 resistance level at 17.40. Next upside level is 18.50
Jeff Saut of Raymond James on Friday:
- “I actually came into this year believing the gold miners would outperform the overall stock market for a variety of reasons, and, so far, that has turned out to be a decent, though not mind-blowing, call. However, the pattern I am seeing now in the Market Vectors Junior Gold Miners ETF (GDXJ/$26.51) has me even more excited for the group and leads me to think there might be even more upside in the months to come. Looking at the weekly chart (at right), GDXJ has broken above a long-term trendline that had held prices in check since late 2010, and since pulling back to that line a few weeks ago, the fund has rallied to make what appears to me to be a bottoming formation, with higher lows and highs. It may just be the best long-term pattern I have seen since last summer’s breakout in the Shanghai Index, a breakout that has since translated into more than a 100% gain in Shanghai’s stock market. Of course, I am not saying the same thing will happen here with the miners, but I do believe that long-term breakouts like this should be respected, and if you are comfortable with holding this highly volatile fund, I do believe the risk/reward set-up looks favorable here.”
On the other hand, Larry McDonald of SocGen was negative on Gold Miners on CNBC Closing Bell both because of a 28% rally off their lows and because GDX/GLD ratio is just too rich.
7. Be glad for Index Put Options & VIX calls
Since much of the above seems to revolve around a steep move lower or higher, we thought pictures of a real-life journey on the edge of a precipice might be appropriate. The pictures below reflect daily life for drivers & passengers of Himalayan Road Transport in the mountainous Himayalan state in India.
At least, our perils can be protected via options for insurance. Sadly, the drivers/passengers of HRTC don’t have insurance and blithely remain sanguine of the risks involved. Check out the link for a total of 21 photos of the perils of Himachal Pradesh bus service.


Send your feedback to editor@macroviewpoints.com Or @MacroViewpoints on Twitter
