Summary – A top-down review of interesting calls and comments made last week in Treasuries, monetary policy, economics, stocks, bonds & commodities. TACs is our acronym for Tweets, Articles, & Clips –our basic inputs for this article.
Editor’s Note: In this series of articles, we include important or interesting Tweets, Articles, Video Clips with our comments. This is an article that expresses our personal opinions about comments made on Television, Tweeter, and in Print. It is NOT intended to provide any investment advice of any type whatsoever. No one should base any investing decisions or conclusions based on anything written in or inferred from this article. Macro Viewpoints & its affiliates expressly disclaim all liability in respect to actions taken based on any or all of the information in this article. Investing is a serious matter and all investment decisions should only be taken after a detailed discussion with your investment advisor and should be subject to your objectives, suitability requirements and risk tolerance
1. Pancake?
Chocolate pancakes are just yummy and we can’t get enough of them. But a yield curve that is getting flattened like a pancake – that’s just ugly to anyone who wants economic growth and especially to a Federal Reserve that wants to tighten. This ugly specter was evident to all on Friday which saw 30-yr yield fall by 8 bps & 5-year yield rise by 3 bps. What a fall was there & it may not be over yet:
- Monday – Two And Twenty ?@deuxetvingt – Based on oil moves, 5s30s should be about 25 bps flatter
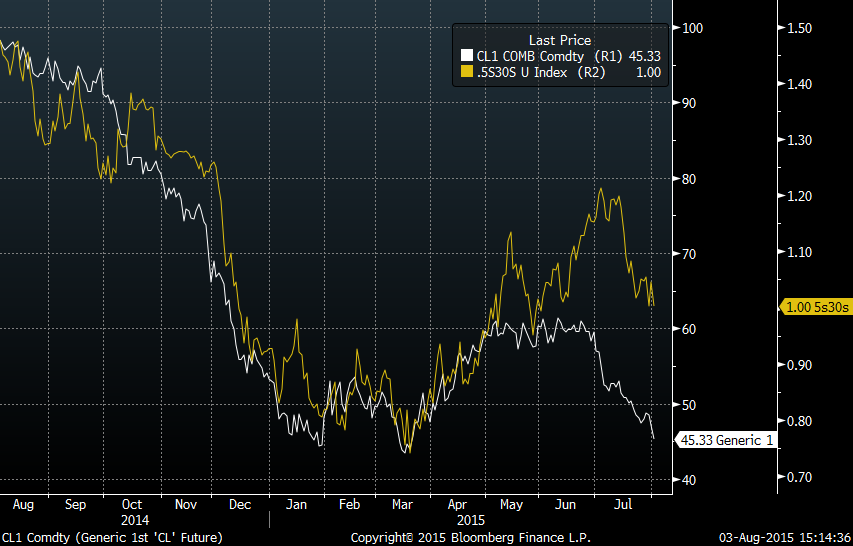
Clearly Chair Yellen must be dismayed by this reaction in the yield curve. But is she “boxed in”?
- David Rosenberg – Fed Boxed In – The Fed seems to be looking for real GDP growth to come in at least at a 2.5% annual rate in Q3 and nothing of the sort is happening- the handout from the second quarter is simply too soft … Last week’s revisions that came out with the tepid Q2 GDP rebound were stunning and not in a good way, either, showing the recovery to be even more feeble than originally thought
Rosenberg has said before that he doesn’t expect the Fed to raise rates this year. But the Treasury market disagrees based on the pancaky action of the 30-5 year yield curve. And the traders seem to concur with the yield curve:
- Thu – Bloomberg Business ?@business – Traders have never been more convinced of a September rate hike by the Fed http://bloom.bg/1OQGmy5
Bill Gross agreed with September hike in his comments on Bloomberg Radio:
- “There are reasons why the Fed shouldn’t move, but I think the Fed will move because of financial conditions. And I’ll just briefly describe that. It’s a situation in which I think central banks are beginning to recognize that there are negatives to low interest rates, as opposed to positives. The BIS put out a report last month that basically said there are medium term negatives, and they include some big corporations. And they include destruction of business models and a function in insurance land. And so I think they would simply want to get off zero and show the world that a move towards normalization as possible”
- He added, the Fed is: “mentally committed to moving before year end.” And that a move in September is “not a unanimous opinion, but it’s a majority opinion at the moment. “
Another reason to get off the Zero rate policy, according to Bill Gross:
- “Now with interest rates so low, I think we have to question whether a positive carry produces positive returns going forward. And so if you sense a deflationary world, and around much of the globe in terms of commodity prices and currencies, the dramatic decline in emerging market currencies basically are a deflationary force for the United States, but if you sense that then it’s rather negative, — or certainly not a positive for equities and risk market.”
This message was driven harder in:
- Lawrence McDonald ?@Convertbond – US Stimulus 2008-2014 – Fannie/Freddie:$6T
Federal deficits:$9T; State/Local deficits:$2T; QE: $4.7T; Total $21.7T = 215k jobs in July
How is the economy growing in the midst of this will they, won’t they debate? According to the Atlanta Fed, real GDP for Q3 is running at 1% now:

So:
- Fri – Raoul Pal ?@RaoulGMI – While the market obsesses over a small Fed hike, the @AtlantaFed GDPNow is currently running at 1% while market is at 3%. Buy bonds.
2. US Dollar
The strength of the Dollar is shown by:
- ForexLive ?@ForexLive – CFTC Commitments of Traders report: US dollar net longs hit highest since early June http://news.forexlive.com/!/cftc-commitment-of-traders-report-aug-7-2015-20150807
According to ForexLive,
- “with US dollar longs piling in and after a non-farm payrolls report that was just ‘okay’ we saw a wave of profit taking and position squaring.”
Is the Dollar likely to stall here?
- Mark Newton ?@MarkNewtonCMT – US Dollar index meanwhile has given up early gains, & Breakout above late July highs-Now seemingly Stalled out $
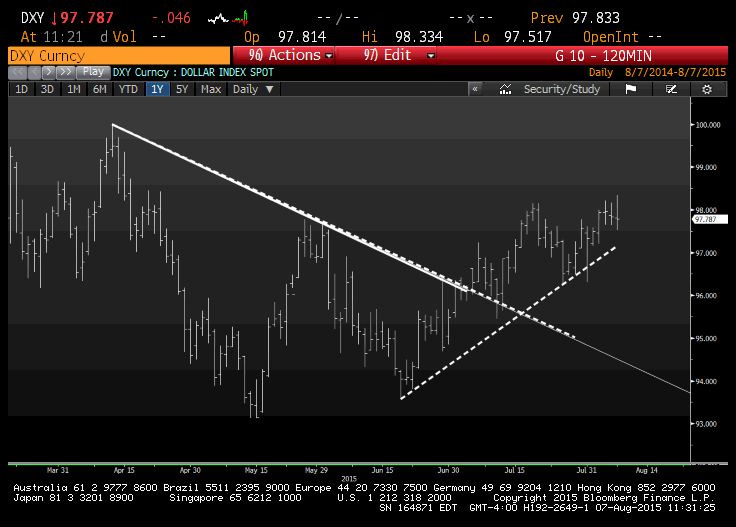
If the Dollar does stall, it could provide relief to metals, oil & other commodities.
3. Bonds
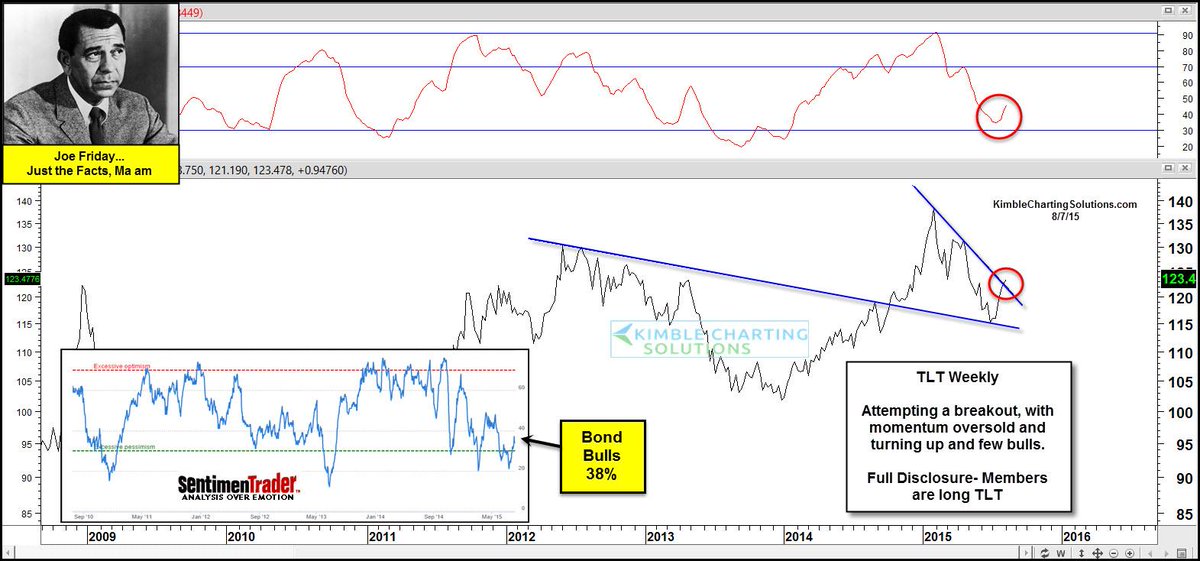
Long duration Treasuries, especially the 30-year Treasury bond, have rallied for three weeks straight. TLT, the 20-year ETF, has been terrific and is now poised just below its 200-day moving average. Will it break out or fade for awhile? Below are Raoul Pal’s comments from his Wisdom Tree interview:
- “Raoul believes that the best places to seek exposure are to the U.S. dollar and to be long bonds. From a sentiment perspective, the investor community is shunning bonds, but from a fundamental perspective, low commodity prices are keeping a lid on inflation, which tends to be good for bonds. From a positioning standpoint, mutual funds appear structurally under-weight in fixed income and over-weight in equities. Raoul believes the fund community that tend to allocate in and out of bonds are underweight bonds and will eventually become buyers“
Some have already been buyers:
- Chris Kimble ?@KimbleCharting – Breaking out, momentum oversold and few bulls. $TLT Full Disclosure- members have been long TLT for a while. $SPY
But some like J C Parets are cautious here :
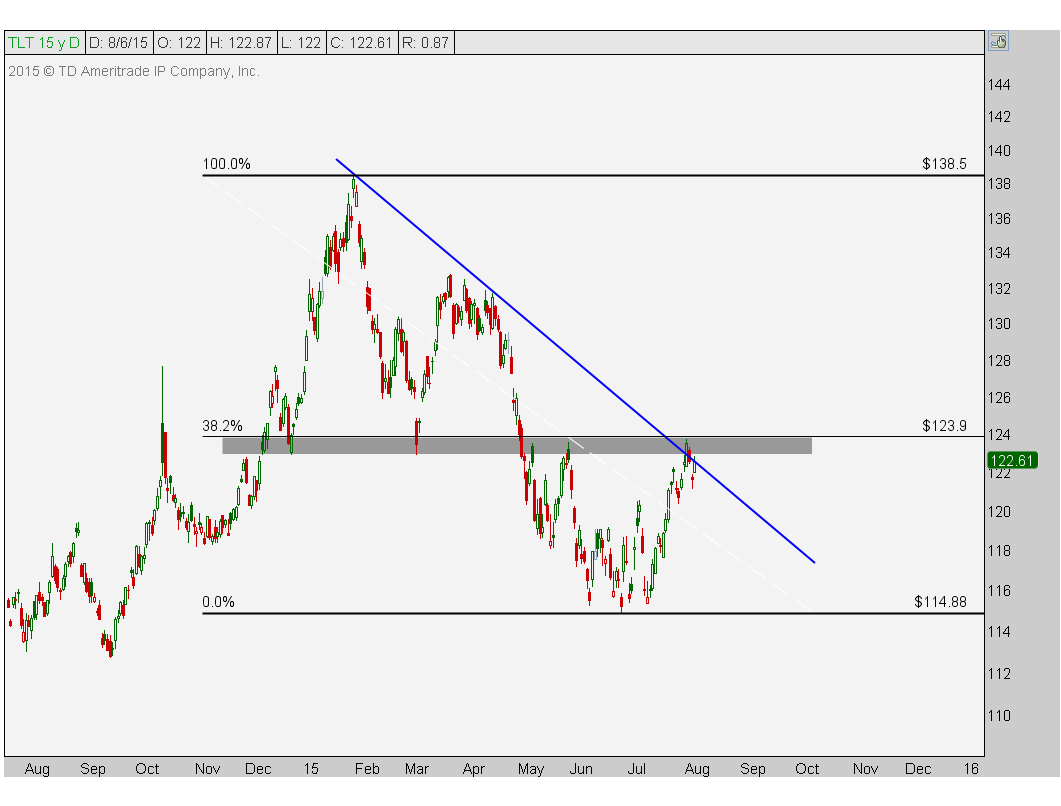
- “… now we wait. I think if prices can start trading in the $124s-$125s, the market is telling us that rates are likely to get slammed. If we struggle up here and roll over, I would argue that would be a positive for interest rates and economists will finally have their day!”
- “I don’t have a horse in the race right now, but gun to my head, I think the former is the higher probability outcome. Remember we are still in the midst of one of the strongest bull markets in bonds in American history. You want to step in front of that train?”
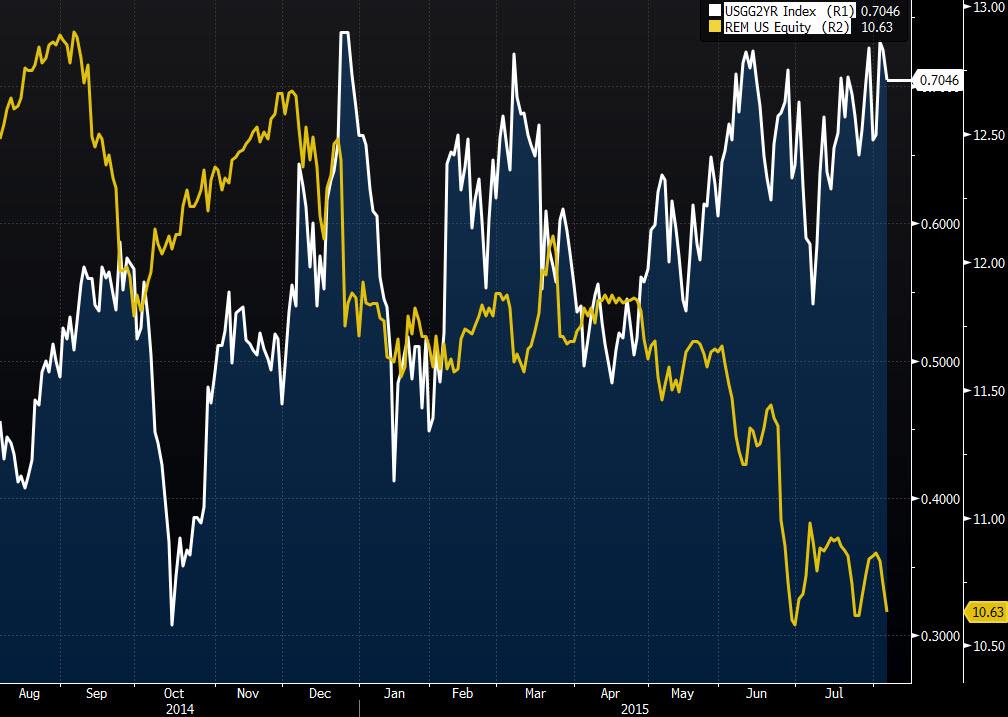
The fall in interest rates should be positive for mortgages, right?
- Bloomberg Markets ?@markets – Interest Rates Are Already Hurting Mortgage REIT ETFs
http://www.bloomberg.com/news/articles/2015-08-07/interest-rates-are-already-hurting-mortgage-reit-etfs
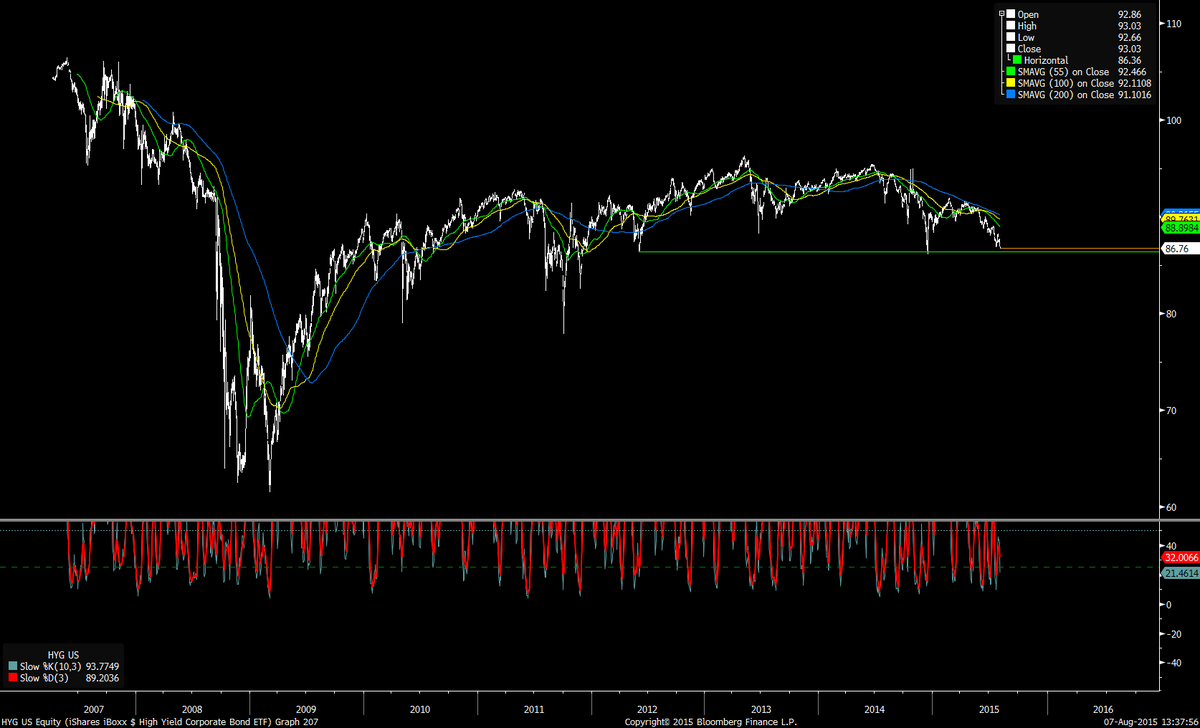
And what about lower quality bonds?
- FxMacro ?@fxmacro – High-Yield HYG just an accident waiting to happen good thing the FED is not starting a tightening cycle anytime soon
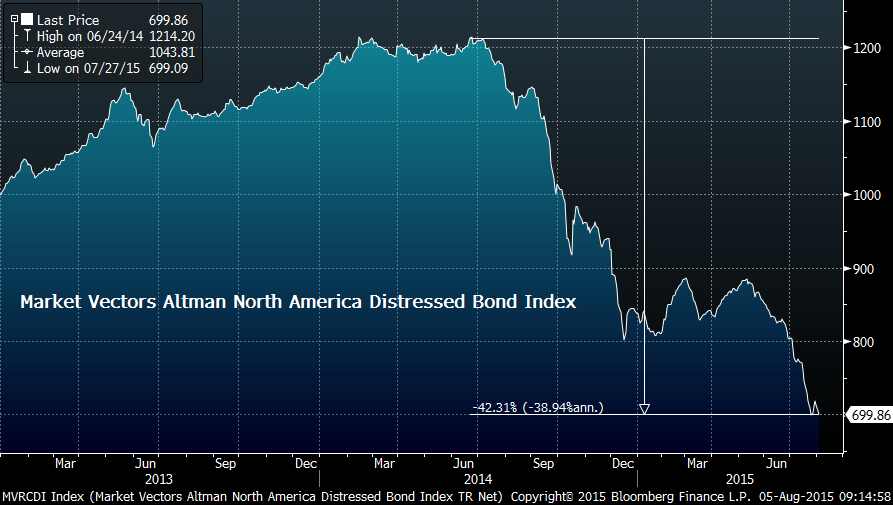
And distressed bonds?
- Wed – Charlie Bilello, CMT ?@MktOutperform – Distressed Bond Index down 42% since last June.
The Fed wants to raise rates on top of all this? Yes, because they are “mentally committed” per Bill Gross.
4. Stocks
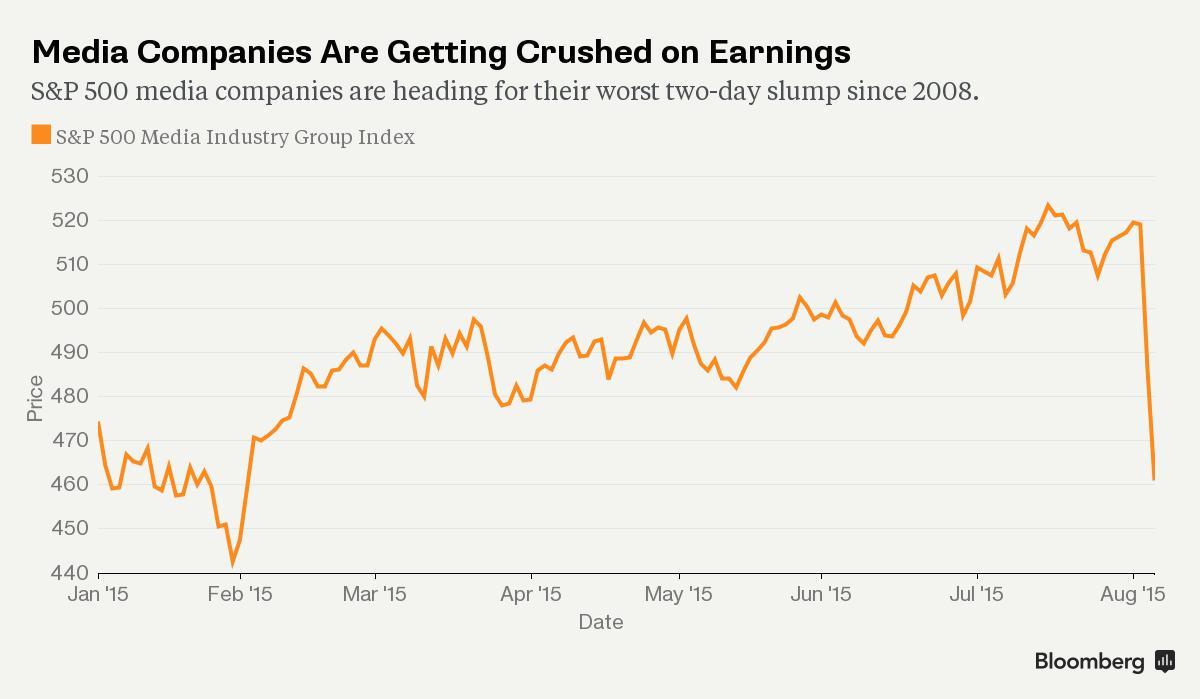
We are all inured to steep falls in high beta internet stocks. But not in blue chip stalwarts like Disney, Time WArner & Viacom that have been long term leaders in this market. To watch Disney fall 10% and Viacom nearly 20% in one day was scary. As always, a picture tells the story better:
- Thu – Joseph Weisenthal ?@TheStalwart – A pillar of the bull market is collapsing before our very eyes. http://www.bloomberg.com/news/articles/2015-08-06/media-wipeout-taking-down-pillar-of-bull-market-in-u-s-stocks … via @callieabost and @OJRenick
The really crucial question is whether the velocity of the down moves is a message in itself or is it just a symptom of outsized positions. One view is:
- Thu – Mike Valletutti, CTA ?@marketmodel – Velocity of these moves doesn’t mean change of trend anymore. They just discount, and recover, with greater speed.
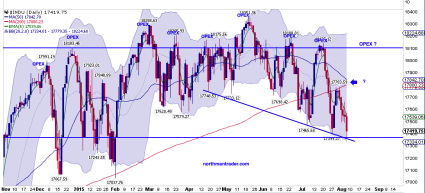
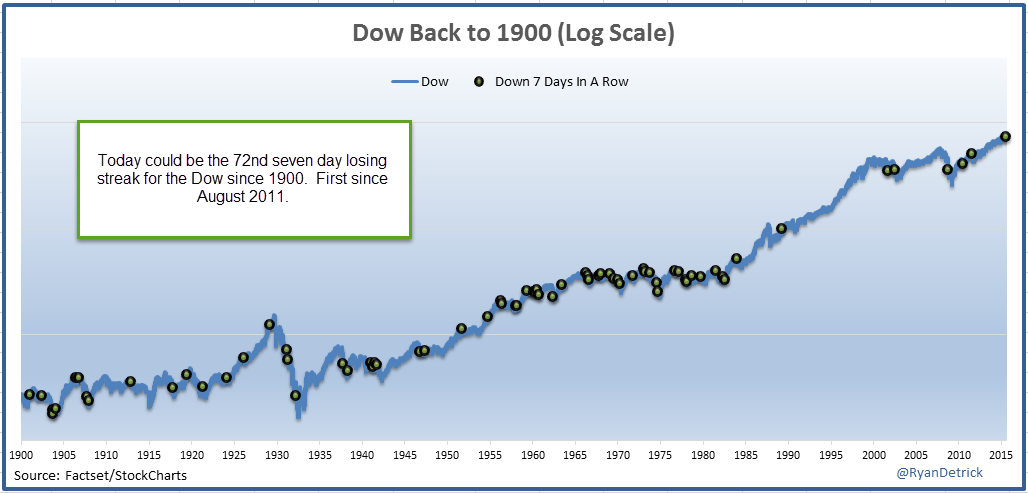
The Dow was down seven days in a row. Is that bearish in itself?
- Ryan Detrick, CMT ?@RyanDetrick – Today could be 72nd seven day losing streak for Dow since 1900. Here’s a chart of all the times it happened. $DIA
After all the turmoil, the S&P was only down 1.2% on the week and only down about 3% from its all-time high. Does the oversold condition suggest a bounce next week?
4.1 Short Term Bounce?
Siebert of CNBC FM said on Friday – “I am at a point right now that the tape should be bought. I am very confident“.
- Mark Arbeter ?@MarkArbeter – Potential upside down “fish hook” bottom on $SPY, $SPX. See these a lot at intraday bottoms. S.T. rally possible
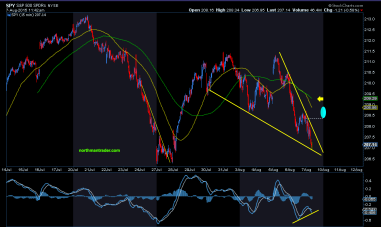
- Northy ?@NorthmanTrader – A potentially short term bullish pattern on $SPY:
http://northmantrader.com/technical-charts/ …
$SPY: A potentially bullish pattern here with a falling wedge and a positive MACD divergence:
- Joe Kunkle ?@OptionsHawk – $SPX – S&P low today bounce was exactly on a “line in the sand”, next week should prove fun
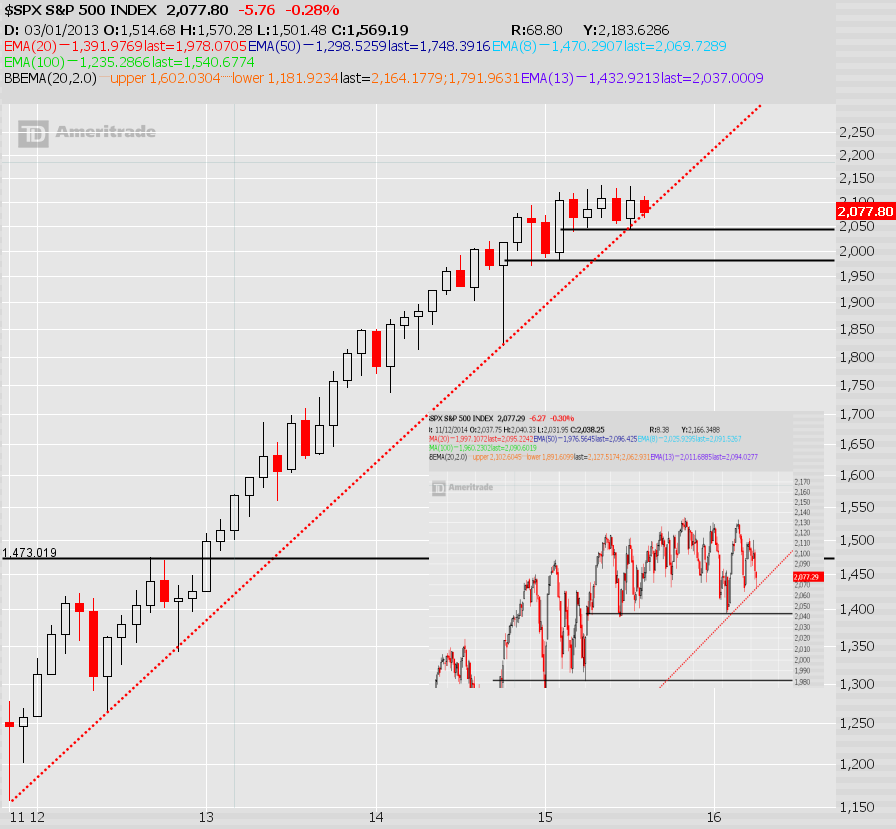
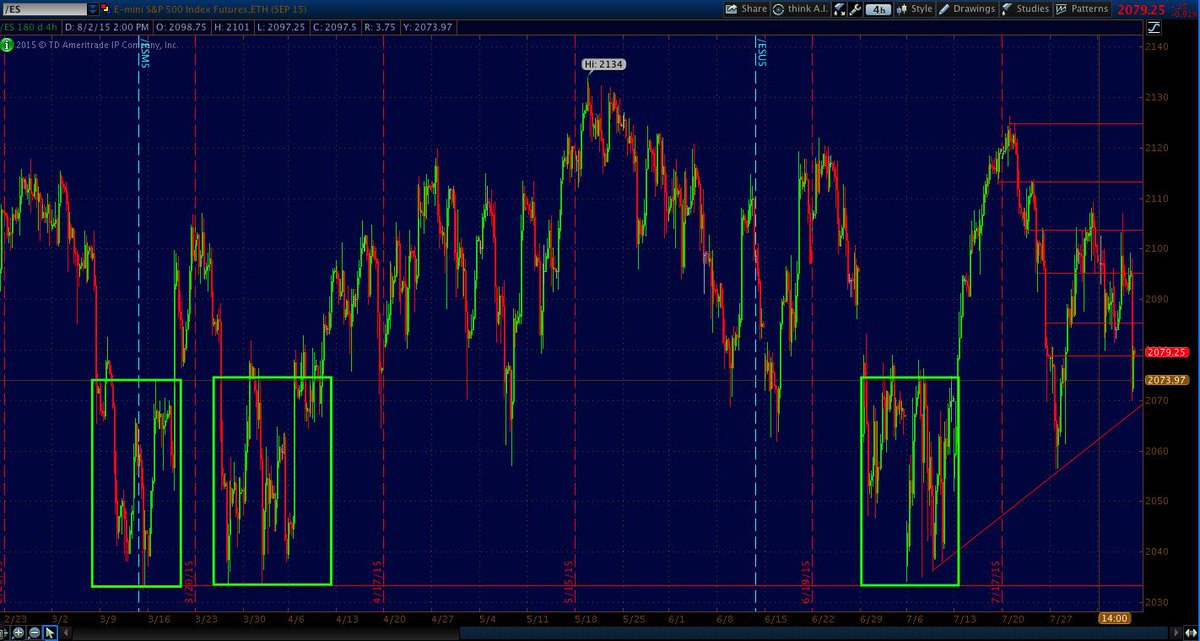
- Urban Carmel ?@ukarlewitz – $ES – on 2070 trendline. Hot mess started 3 times before down here (boxes) $SPY
- Thu – Chad Gassaway, CMT ?@WildcatTrader – Indices have seen lower sentiment levels recently but we are nearing sentiment extremes based on DSI.

Wouldn’t be ironic if the S&P 500 fell apart next week after all of the above?
4.2 Intermediate Term Bullish
The most bullish comments came from Laszlo Birinyi with a 3200 price target within 2 years. He told CNBC FM that people should stay in the market and not get scared out. Richard Ross on CNBC FM was bullish as well with a 2040 stop on the S&P 500. His targets are 2130 & 2180-2220 into year-end. Tom Lee came on CNBC FM on Friday with a bullish call based on short interest on the S&P (up 58% ytd & 20% higher than in October 2014).
4.3 Intermediate Term Bearish
- Lawrence McDonald ?@Convertbond – .@rinsana those who don’t learn from history are doomed to repeat it

Which history? McDonald argues that Bear markets have started in the 7th year of every two-term President since Eisenhower. And recessions.
- Wed – Dana Lyons ?@JLyonsFundMgmt – (Post) Even The Leading Sectors Are Starting To Wear Thin – via @YahooFinance $XLY $RCD http://tmblr.co/Zyun3q1rI-Bek.
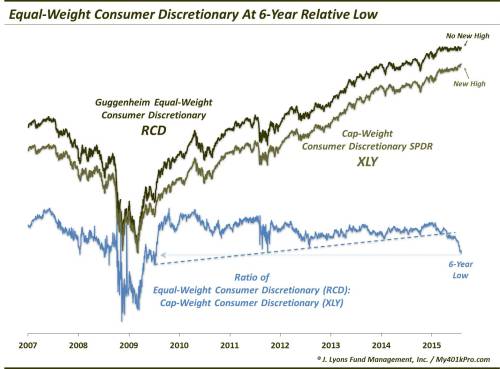
- “First off, the relative weakness of the equal-weight index has accelerated, beginning with the April break of the post-2009 UP trendline in the RCD:XLY ratio. Since then, the ratio has essentially gone straight down, closing at a 6-year low yesterday. Plus, the trouble is not just confined to the relative basis. On an absolute basis, the equal-weight RCD has failed to make a new high here in August along with the cap-weight XLY. This deserves to be monitored in coming days and weeks as a divergence here would be another red flag.”
- “As we see with the consumer discretionary sector, however, it should be noted that once the relatively few leaders give way (DIS is getting slammed today), there is not much of a foundation underneath supporting this market.“
Streettalklive.com points out an interesting podcast at Financial Sense with Richard Dickson, the Senior Market Strategist at Lowry Research
- Dickson says when the broader indexes are approaching a top, the advance is led by fewer and fewer stocks, which has been seen at every major market peak they’ve studied.
- This phenomenon registers in the market’s widely followed advance-decline line, however, Dickson points out that relative under-performance by small-cap stocks often provides an earlier warning signal to potential trouble ahead. He notes that small-cap stocks began to deteriorate almost a year ago, and many have already entered bear market territory. This is not healthy action, he says.
- Based on research conducted at Lowry, this predicts a market top within 4 to 6 months. In the interim, Dickson will be watching a variety of other technical indicators for confirmation, such as buying power and selling pressure
- Here is a chart of the advance-decline line and small-cap performance relative to the S&P 500.
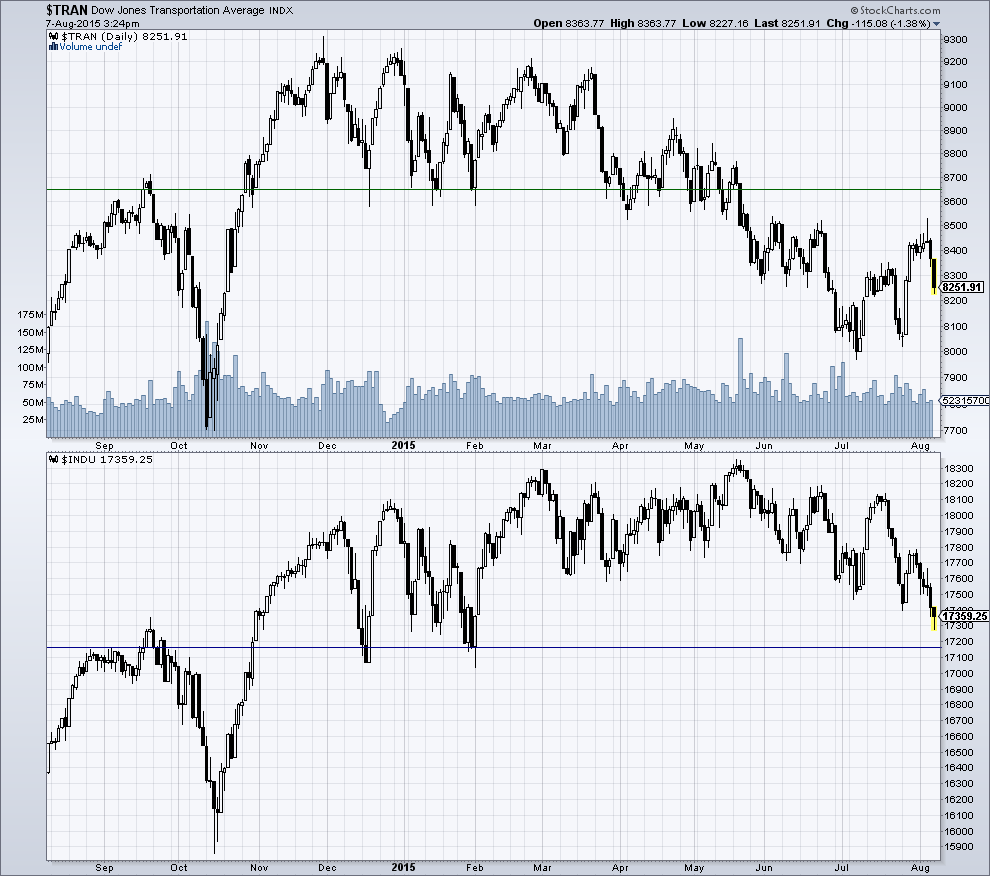
- Karl Snyder, CMT ?@snyder_karl – getting closer to a DOW Theory sell signal $INDU $TRAN $STUDY
4.4 Sectors
- Fri – Joe Kunkle ?@OptionsHawk – $XLU – strongest sector and buyers late day for 5000 Sep. $44 calls
- Urban Carmel ?@ukarlewitz – Semiconductors down about 15%. 1996 and 1998 both had >50% drops, in the middle of a tech boom! 2004 and 2006 they dropped >30% $sox
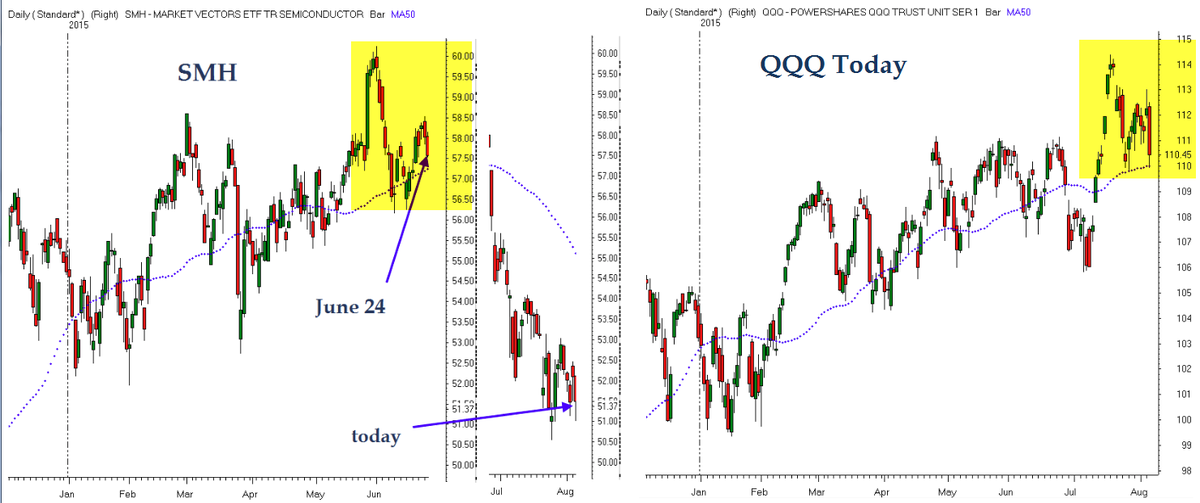
- Thu – Brian Shannon ?@alphatrends – check out the similarities of $SMH in late June vs $QQQ today, eerily similar!
- StockTwits ?@StockTwits – This is HUGE. The world’s best performing sector is once again testing its 100-day moving average: http://stks.co/g2vWD $IBB $CELG $AMGN

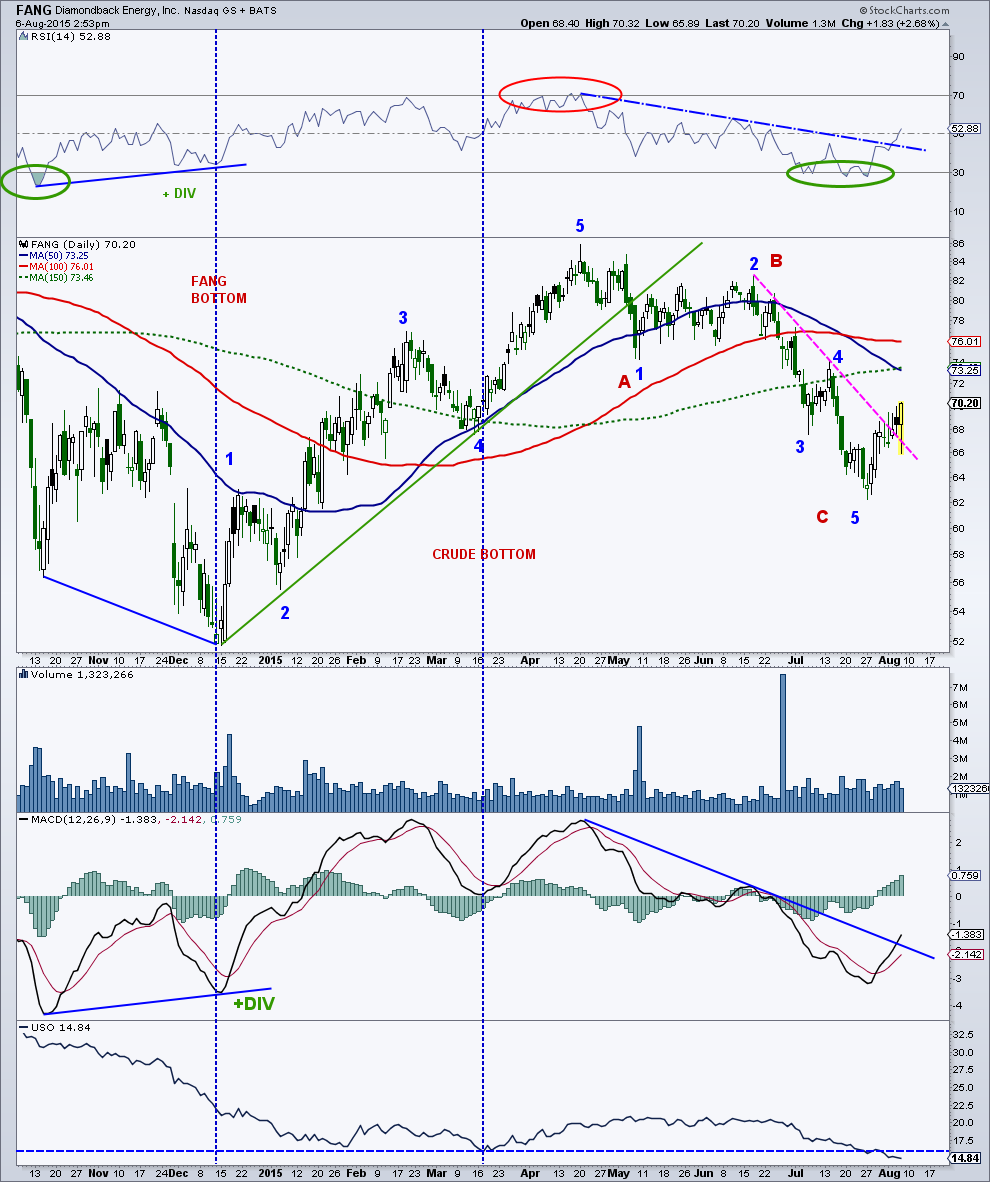
- Mark Arbeter ?@MarkArbeter – This stock $FANG bottomed before $USO, $CL_F late last year. Trying to lead again. Looks like initial leg higher.
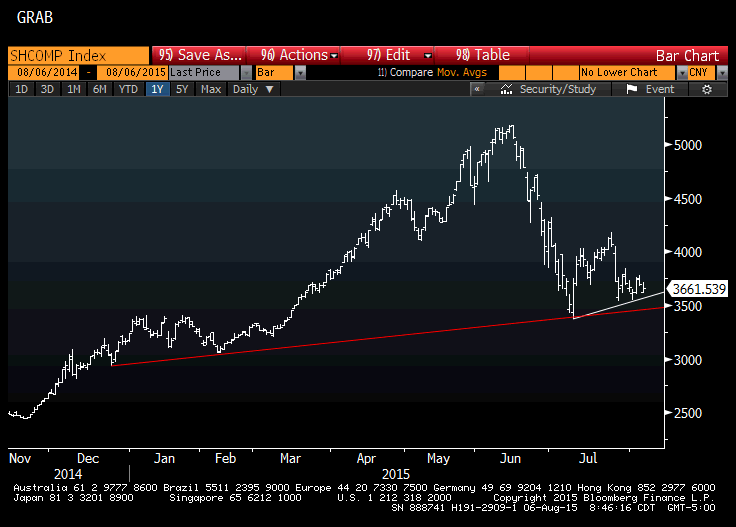
- Thu – Raoul Pal ?@RaoulGMI – Last Chance Saloon 5 – Shanghai Composite
5. Gold
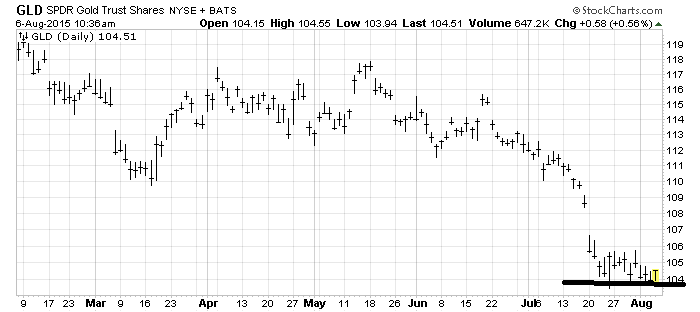
Last week, a number of technical comments were positive about Gold. Gold did not rally this week but didn’t go down either.
- Thu – Helene Meisler ?@hmeisler – GLD continues to hang tough at 104 @mark_dow
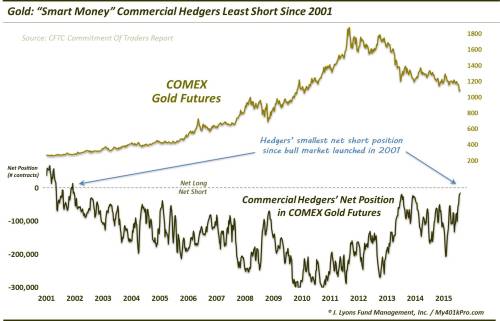
- Fri – Dana Lyons ?@JLyonsFundMgmt – ChOTD-8/7/15 Gold: “Smart Money” Commercial Hedgers Least Short Since 2001 $GLD $GC_F $GDX $IAU
- Futures Magazine ?@FuturesMagazine – #Gold decline nearing exhaustion http://www.futuresmag.com/hWw#.VcS9UTxouEg.twitter …

- ForexLive ?@ForexLive – Gold consolidation coming to an end http://bit.ly/1K88x85 #Gold

- I’m a gold bear but I’m constructive here.
- The main event this week wasn’t non-farm payrolls. It was the Fed’s Lockhart saying it would take a series of disappointing data releases to dissuade him from voting for a rate hike in September. Lockhart is a great barometer for the core of the Fed and his comments carry heavy weight in the markets.
- If gold was vulnerable, his comments would have sunk it. Instead, prices gained slightly this week in an impressive sign of resilience.
- There will still be a few twists and turns before the Sep Fed decision but at the moment, the technicals tell the story. Gold is in a classic ‘wedge’ consolidation period and poised to break out any day.
- When it does, go with a rally to the March low of $1140 or a drop down to the 2010 low of $1020
What if gold stops going down but doesn’t go anywhere?
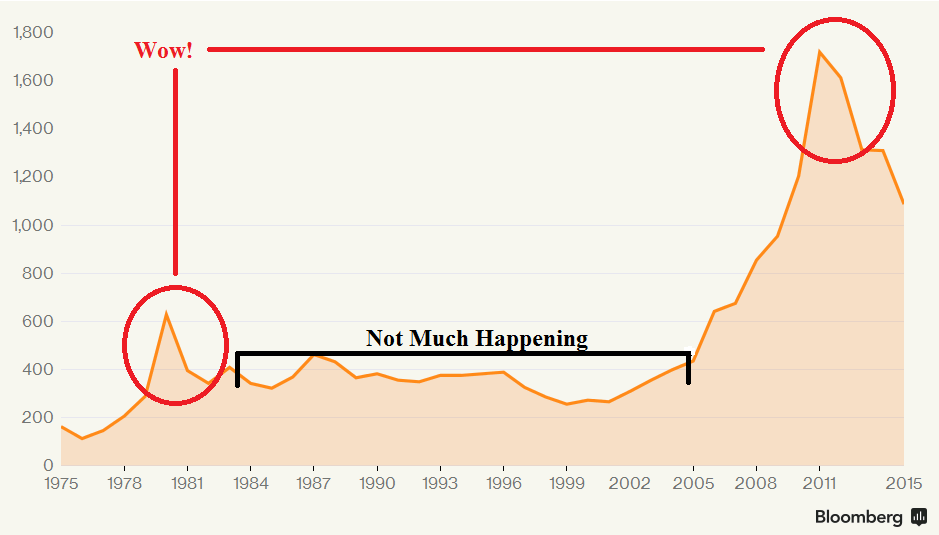
- Wed – Bloomberg Business ?@business – If 2011’s spike is anything like 1980’s, gold could soon get very boring http://bloom.bg/1W1GRLc
6. Oil
ForexLive noted on Friday in their discussion of the CFTC Commitment of Traders report:
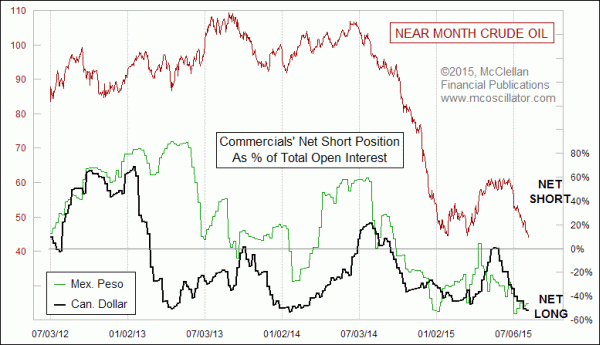
- “One that sticks out is the increasing shift into Canadian dollar shorts. We’re nearing the most extreme levels since early 2014“
Canadian dollar has been correlated with oil. So is Oil near the end of its decline? Tom McClellan argues so in his discussion of Peso & Canadian Dollar vs. Oil
- “The commercial traders for both the Mexican peso and the Canadian dollar are at a multi-year record net long position. In other words, the smart money believes that these two oil-correlated currencies are going to be headed higher. For that to happen, oil prices should presumably also head higher, or else the strong correlation would have to break“
- Mark Newton ?@MarkNewtonCMT – Crude looks to be close to support after most recent drop, and DON”T anticipate we have much more downside near-term

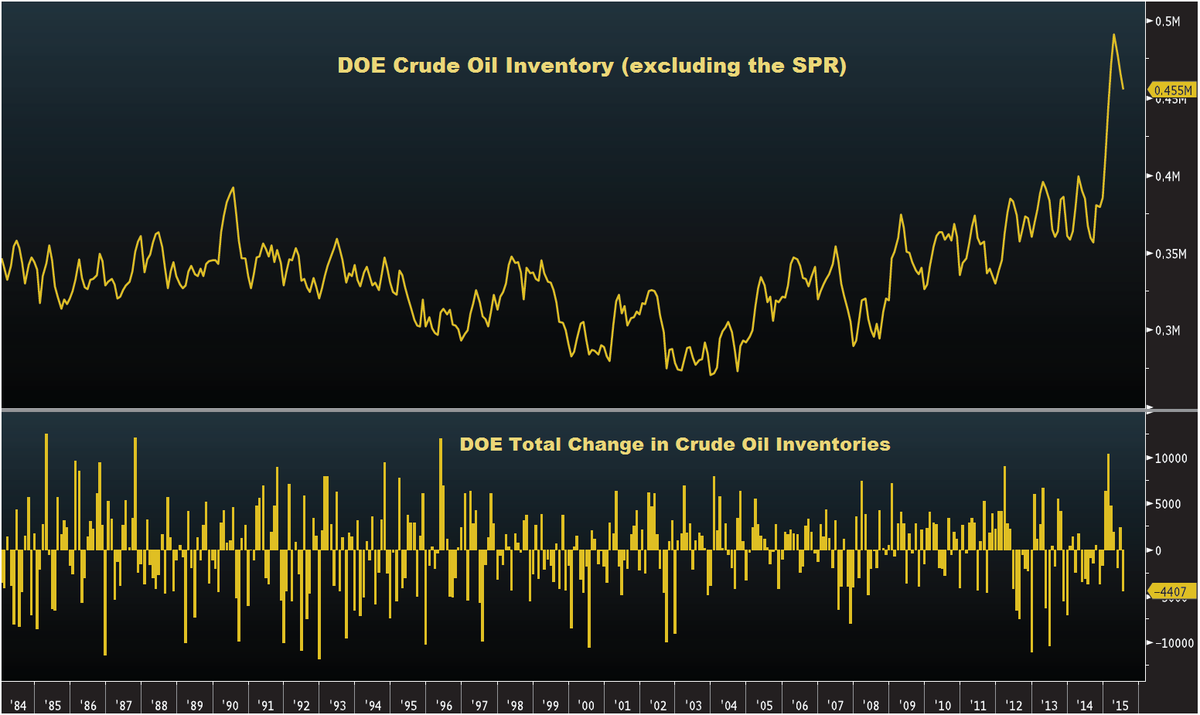
- Antony Filippo ?@Vconomics – Inventories and production in the U.S are declining. Maybe we’ve pushed prices too far too fast this time.
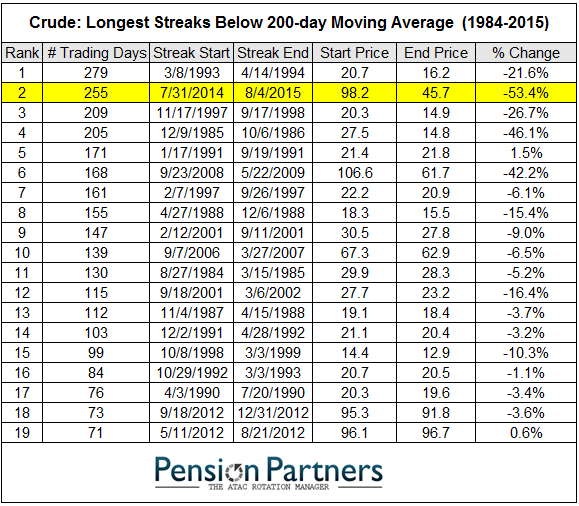
- Tue – Charlie Bilello, CMT ?@MktOutperform – Crude trading below its 200-day moving average for over a year now, 2nd longest streak in history. $CL_F $USO
Carter Worth said on CNBC Options Action on Friday that “something is wrong here“. In that vein:
- Thu – Joseph Weisenthal?@TheStalwart If you’re bullish on oil, you might not want to look at this chart (via Credit Suisse’s Andrew Garthwaite)
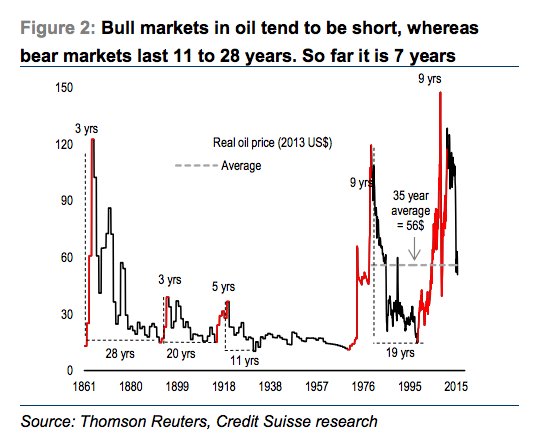
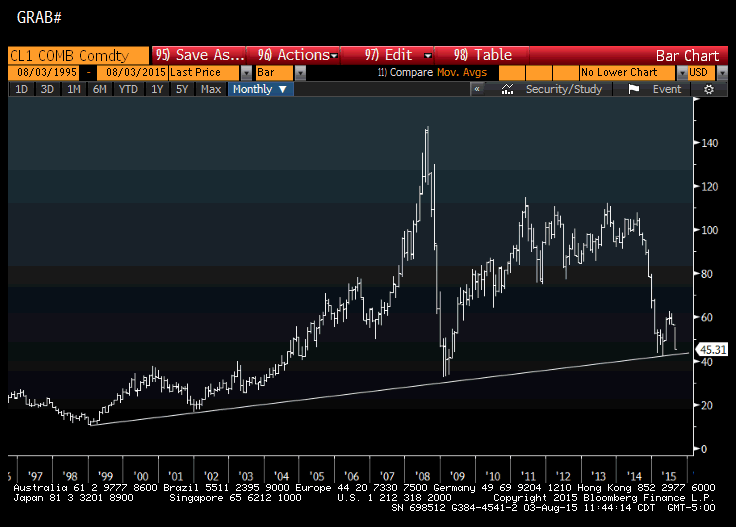
And what would a break to the downside on Oil say about the world?
- Tue – Raoul Pal ?@RaoulGMI – And the $17 year trend line in oil is about to be tested. If that goes then its game over for World GDP.
Send your feedback to editor@macroviewpoints.com Or @MacroViewpoints on Twitter
