Summary – A top-down review of interesting calls and comments made last week in Treasuries, monetary policy, economics, stocks, bonds & commodities. TAC is our acronym for Tweets, Articles, & Clips –our basic inputs for this article.
Editor’s Note: In this series of articles, we include important or interesting Tweets, Articles, Video Clips with our comments. This is an article that expresses our personal opinions about comments made on Television, Tweeter, and in Print. It is NOT intended to provide any investment advice of any type whatsoever. No one should base any investing decisions or conclusions based on anything written in or inferred from this article. Macro Viewpoints & its affiliates expressly disclaim all liability in respect to actions taken based on any or all of the information in this article. Investing is a serious matter and all investment decisions should only be taken after a detailed discussion with your investment advisor and should be subject to your objectives, suitability requirements and risk tolerance.
1. “Mission Accomplished”
Jeffrey Gundlach gave the example of the Iraq “Mission Accomplished” sign of President George W. Bush to describe the essence of Chair Yellen’s rate hike this Wednesday. He had argued earlier during Half Time CNBC FM that the rate hike was a given but unnecessary. He said in that noon session – “it is so similar to 2007, it is scary“. In the 5 pm session post-FOMC, Gundlach said that, instead of clearly delivering a “one & done” message, the Fed had reiterated their data-dependent stance and that would add more uncertainty. Gundlach was clearly bearish on the short end of the yield curve in that 5 pm session – “2 year yield is unequivocally going higher; 5-year will be joining it; If the 5-year yield breaks the humongous resistance of 1.81%, it is going to 2.40%“
Gundlach proved prescient about the “uncertainty” Fed had caused. Look what Robert McTeer, ex Fed-head, said on Thursday on CNBC “when I listened to Janet Yellen, she was trying to her best to be dovish“. And now consider what Pimco said on Thursday – “And we do believe it will be a rate hike cycle – the chances of a “one and done” single-hike scenario are about equal to those of a zombie apocalypse …. We see the risks biased toward the fed delivering more rate hikes than the market is pricing in.” Two completely opposite interpretations by two experts in monetary policy.
This is the cherished transparency of the Yellen Fed? The markets concurred with Mr. McTeer on Wednesday and somewhat with Pimco on Thursday. Stock indices exploded higher (Dow up 224;S&P up 30 handles) on Wednesday but collapsed on Thursday (Dow down 253 & S&P down 31); Treasury yields shot up on Wednesday and fell just as hard on Thursday; Gold & Gold Miners rose hard on Wednesday and fell harder on Thursday. We wonder whether Yellen’s transparency is becoming more undecipherable than Greenspan’s deliberate obfuscation.
Jim Rickards was clear in his interview on FBN – “They are raising into weakness; it is as simple as that; we are heading into a recession; you don’t raise rates into a recession“. Instead of making such a flat statement, Sam Zell told BTV “I think that there’s a high probability that we’re looking at a recession in the next 12 months.” Larry Fink was even more circumspect on BTV. He said the “U.S. economy is decelerating … the U.S. will avoid recession unless China slows more rapidly than expected“. Larry McDonald chose to describe a sequence of what he thinks follows:
- Fed lift off
- Dollar surge
- Commodity plunge
- Commodity/EM Credit risk ($10T) surge
- Currency risk surge.
- Fed back to 0%
2. Treasuries.
The steep decline in Treasury yields on Thursday & Friday was something to behold. The curve implications were also interesting. On Thursday, the long end outperformed the belly with the 30-year yield falling by 6.4 bps & the 5-year yield falling by 2.1 bps. But on Friday, the 30-year yield was down by 2.6 bps while the 5-year & 3-year yields fell by 5.2 bps. Not only did the 5-year yield recoil mightily from Gundlach’s 1.81%, it also sped towards Santelli’s lower bound of 1.66% by closing at 1.67%. If this continues next week, then the Treasury market may be sending a “one & done” message back to the Fed.
3. Stocks
The indices were basically unchanged by the end of a nutty week. Did anything change?
- Chad Gassaway, CMT @WildcatTrader – SPX DSI is similar to last Friday as well. At 5 vs. 6 last Friday after rising to 30 on FOMC day.
So what happens next week?
- Ryan Detrick, CMT @RyanDetrick – Good news? The last time had a down 1% $SPX day on Thursday and Friday in Dec was 2000 and 1974. The next day up 0.81% and 0.91%. $SPY
- Helene Meisler @hmeisler – Stuff I look at says this is all index selling. Different than 1-2 wks ago
A statistical case:
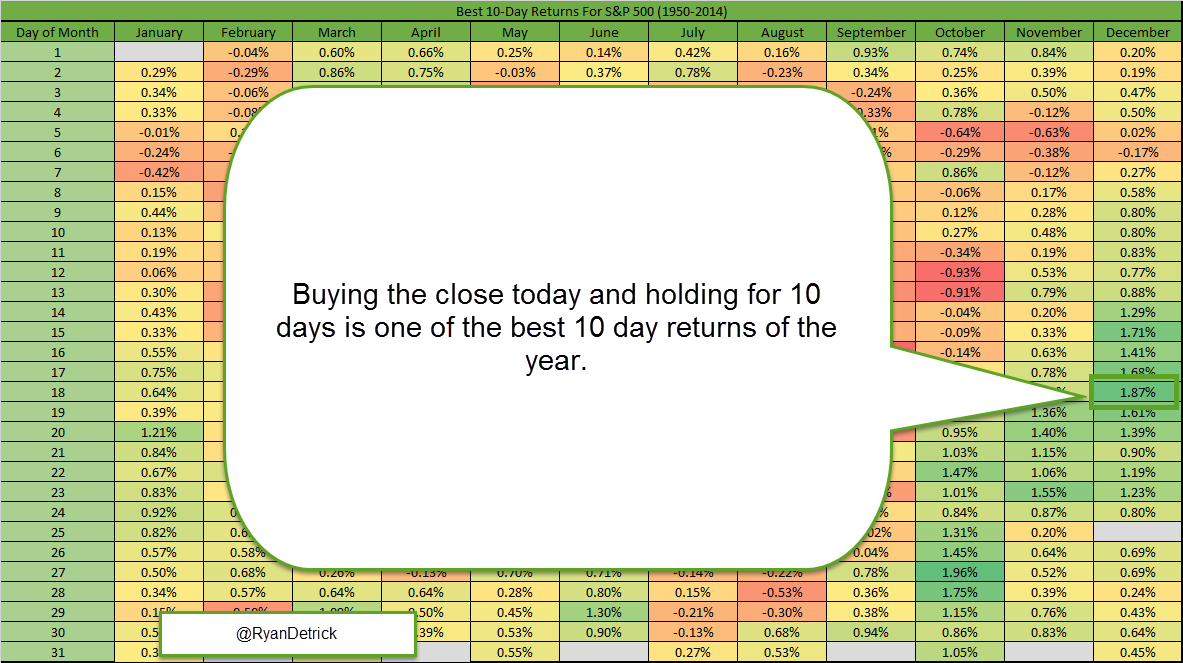
- Ryan Detrick, CMT @RyanDetrick – Buying Dec 18 close (today) and holding for 10 days is one of the best 10 day returns of the year. $SPY
On the other hand:
- Scott Redler @RedDogT3 – Tons of broken stocks. And only a few hanging by a thread with some constructive technicals. Not sure “seasonality” is enough to. So I wait
Some analysts have become bearish on the intermediate term, notably Louise Yamada who said the following on CNBC Futures Now on Tuesday:
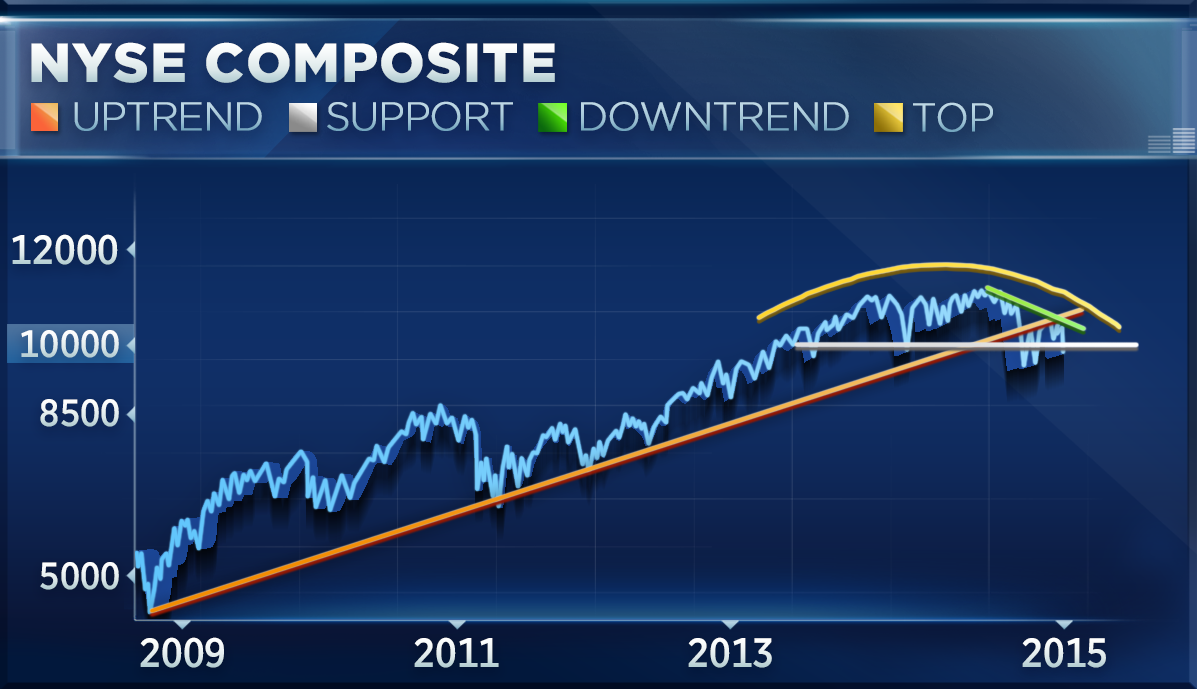
- we are still cautious on this market; WE use NYSE composite because it depicts quite clearly a two-year topping process and there are certain questions investors should ask themselves –
- Does a move have something to reverse? – NYSE is up 169%; S&P up 220%; Nasdaq 280% so YES.
- Has it broken an uptrend? NYSE has broken its 2009 uptrend, other indices are close; transports have broken it as well
- Has support been violated? – we had support at 1050, now around 10,000 – substantially violated – With every yes answer, people should take a little bit money off the table …
- Final question – has a downturn initiated? – from July peak you have a downtrend in place; rally in November failed under that downtrend; now 1050 support represents resistance –
And,
- with all these rallies, you only have 25% of NYSE stocks above their 200-day; we have evidence in our upvol-downvol indicator which is extremely oversold – there has been more down volume than up volume; new highs-new lows is in negative territory – all this suggests they has been selling into these rallies – NYSE put in monthly momentum sell in January; Dow & S&P in April; NYSE already has a monthly death-cross in place; definitely breaking August lows would be the next step; we are probably looking at a cyclical bear market till proven otherwise; because we have a 2-year top in place – it is expanding in all the volatile up & down days – so it is worthy of being extremely cautious
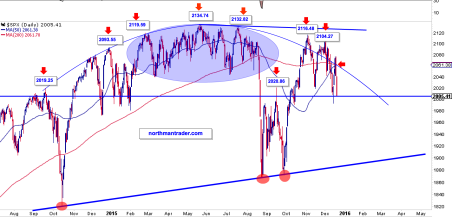
- Northy @NorthmanTrader – Closing Print: Arch me this –http://northmantrader.com/
technical-charts/ … $SPX- Closing Print: Looks like a rounding top, walks like a rounding top……..
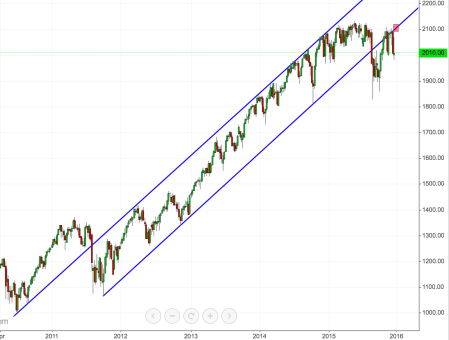
Also a trend line break that may have to be negated if bulls are to be proven right:
Another potential warning:
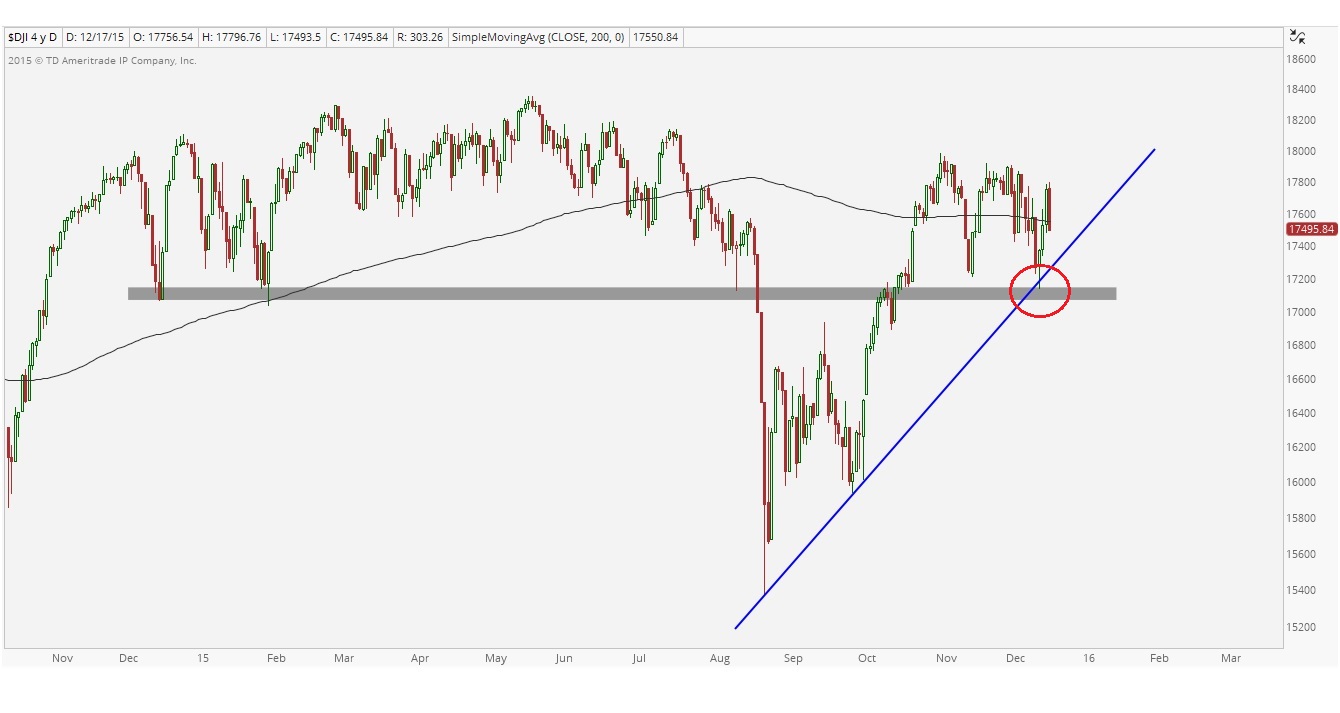
- J.C. Parets @allstarcharts – NEW POST: The Dow Jones Industrial Average Flirts With Disaster http://allstarcharts.com/dow-jones-industrial-average-flirts-disaster/ … $DJIA $INDU $DIA $YM_F
- The problem that I see moving forward is the uptrend line from the August lows. This trendline has now been tested 3 times and if it fails to hold, it would present a huge problem for the popular large-cap index. This 17,150 level is important as it goes back to former support levels in December of last year and again in February.
- The consequences of a break of this support should be felt for some time. First of all, it would invalidate any of the constructive behavior we saw throughout September and October. Secondly, it would put prices back below what will become future overhead supply. And worst of all, it would allow the 200 day moving average to begin to slope lower. Remember we don’t use this smoothing mechanism for support and resistance purposes; we use it to help with trend recognition. When prices are below a downward sloping 200 day moving average, it’s not in an uptrend, I promise.
- This 17,150 level is a big one. … Let’s just say, the market is already a mess but it will turn into a disaster if this level breaks
4. Dollar
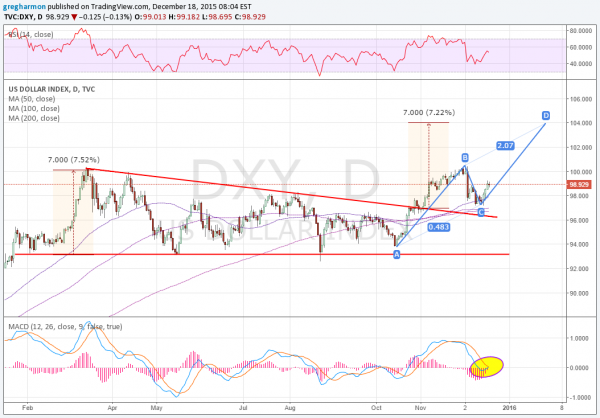
- First is the long descending triangle with support at 93.25. The Dollar Index broke above this triangle to start November and set up a target on that pattern break to 104. The second is from how that early December pullback formed. The reversal back higher this week creates an AB=CD pattern. And the target for that is 103.97. Coincidence? Finally the momentum indicators are flashing bullish. The RSI at the top held the bullish zone on the pullback and is rising again. The MACD at the bottom is about to cross up, a bullish signal.
5. Oil.
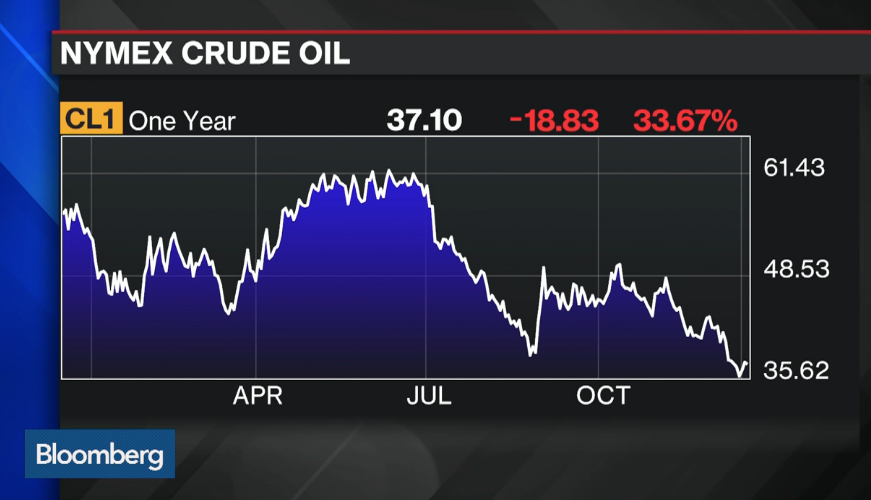
Oil was the only asset class to be down hard on both Wednesday and Thursday. But is that merely creating value for 2016? One view argues yes:
- Bloomberg TV @BloombergTV – Citi’s Ed Morse sees WTI crude at $55 by the end of 2016 http://bloom.bg/1TPGn7W
But what fundamental & technical indicator can you consider to analyze oil?
- Dana Lyons @JLyonsFundMgmt – (Post) Saudi Stocks (& Oil?) Hanging In The Balance – via @YahooFinance $KSA http://tmblr.co/Zyun3q1_6rZfd
According to the article:
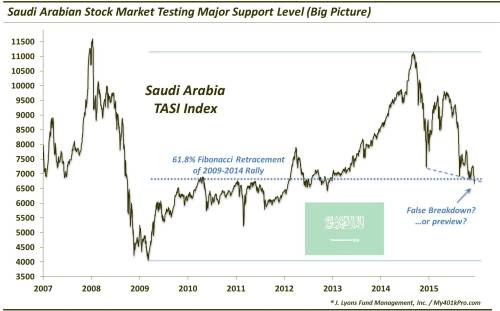
- The Saudi Arabian stock market is testing key support; the resolution here will likely lead to a big move, up or down, for Saudi stocks – and perhaps oil. … The main stock index in Saudi Arabia, the TASI, is currently treading along a very key support level in our view. This level is represented by the 61.8% Fibonacci Retracement of the TASI’s rally from 2009 to 2014. Additionally, in the same area lies a support line connecting the multiple lows of the past 12 months. Here is the big picture view of the TASI…
And the close-up…
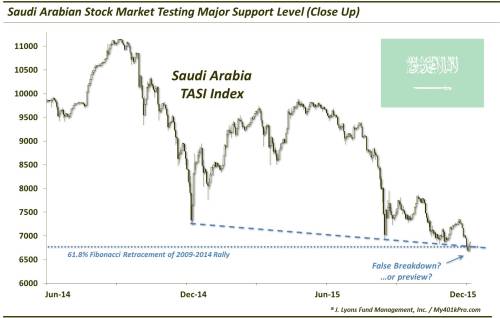
- In our view, this area around 6800 on the TASI is the kind of level that is capable of supporting a long-term low in the index. Thus, if it can hold here, the upside potential, over the long-term, is really limitless. Additionally, the pattern over the past 12 months can arguably be called a falling wedge. Not always, but more times than not, these patterns will resolve to the upside.
- On the other hand, the fact that each bounce near the support line over the past 12 months has produced smaller and smaller bounces is a troubling sign. Yes, the falling wedge analysis may be valid, but prices do not always break up. And the more times this support area gets tested without producing a meaningful bounce, the more likely it becomes that the level will fail.
- Should prices fail to hold the indicated level, there really is no recognizable support nearby that traders or investors can hang their hats on. In other words, should the level fail, it opens the TASI up for significant further downside – and perhaps quickly. In that scenario, it is obviously easy to imagine the price of oil declining sharply in concert.
- Yes, that would be an epic development considering how far the commodity has fallen already. Given that oil has already matched essentially all historical precedents of “oversold” metrics, a further collapse from here would be an utter wash-out/crash type of scenario. We know there are a lot of forecasts out there for $20 oil, though we’re not sure how such forecasts are derived. Nevertheless, should this scenario unfold, perhaps the forecasters get their $20 oil price – or at least close.
- keep an eye on the key support level on the Saudi Arabian TASI. If it hold, Saudi stocks, and perhaps oil, can rally substantially. If it fails, then there is a chance that we witness a further deflationary spiral, and a wild chain of events that could come along with it.
Send your feedback to editor@macroviewpoints.com Or @MacroViewpoints on Twitter
