Summary – A top-down review of interesting calls and comments made last week in Treasuries, monetary policy, economics, stocks, bonds & commodities. TAC is our acronym for Tweets, Articles, & Clips –our basic inputs for this article.
Editor’s Note: In this series of articles, we include important or interesting Tweets, Articles, Video Clips with our comments. This is an article that expresses our personal opinions about comments made on Television, Tweeter, and in Print. It is NOT intended to provide any investment advice of any type whatsoever. No one should base any investing decisions or conclusions based on anything written in or inferred from this article. Macro Viewpoints & its affiliates expressly disclaim all liability in respect to actions taken based on any or all of the information in this article. Investing is a serious matter and all investment decisions should only be taken after a detailed discussion with your investment advisor and should be subject to your objectives, suitability requirements and risk tolerance.
1.”fully invested & fully leveraged“
were the words used by CNBC’s Rick Santelli on Thursday for positions of major investors. This all-in condition was what created the massive dislocation in all financial markets on Thursday, dislocation simply because Draghi conveyed a sense of irresolution within the ECB. The divergence between Fed & ECB is so accepted and so implemented that the slightest ripple of uncertainty created a dislocation not seen in decades. Dennis Gartman said he had never seen a four point move in the Euro in his 40 years of trading.
- Eric Scott Hunsader @nanexllc – This is a once in a decade level move in EuroUSD futures (black line=today):
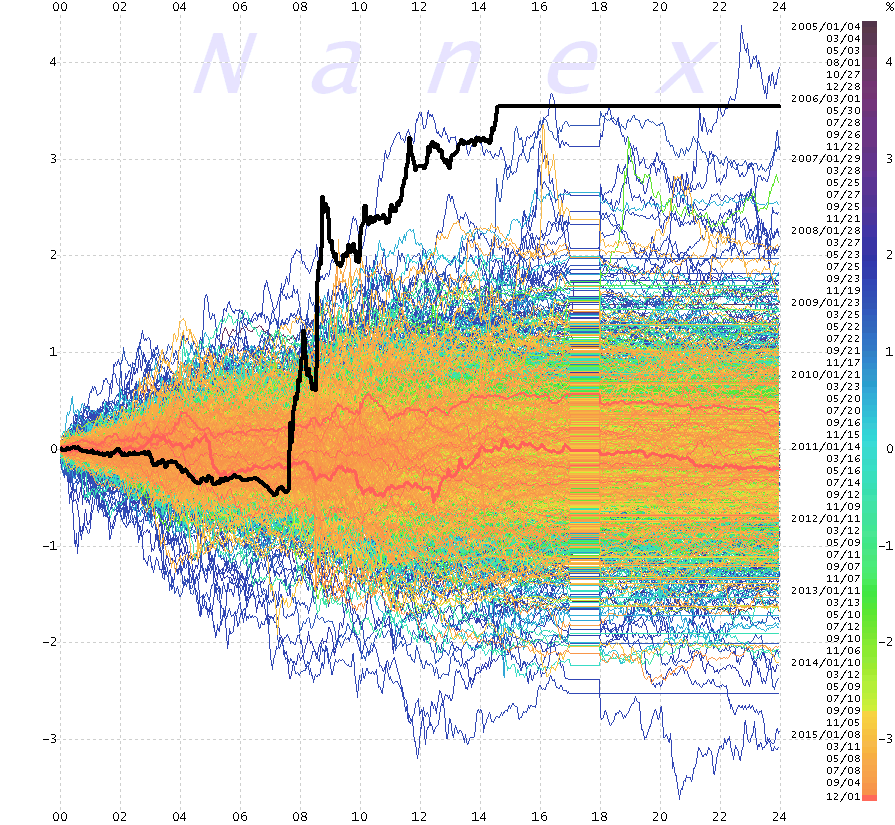
This was not merely a currency move but a rare simultaneous dislocation in almost every financial market:
- Thursday – Charlie Bilello, CMT @MktOutperform – Historic Day in the Markets. Only the 10th time in history where the S&P, Long Bond & Dollar Index all down >1%.
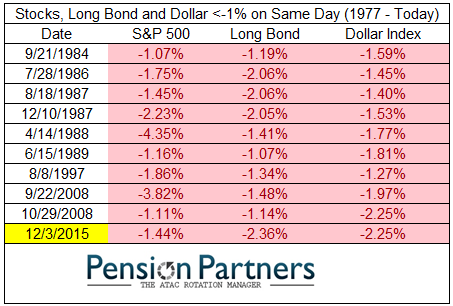
This was not due to a 10 bps cut instead of a 20 bps cut or anything measurable. The dislocation happened because, for the first time, fear arose that Draghi may not be in total control & that internal ECB differences might be forcing his hand. If true, that would be tantamount to movement in tectonic plates in the foundation of this bull market. Hence the tremors. And naturally Gold, Silver and the miners closed up on an otherwise ugly down day.
- Raoul Pal @RaoulGMI – If Central Banks keep mis-signalling future policy actions they will cause a crash. Markets hate policy uncertainty on such a massive scale.
The next day, a strong payroll number stabilized the American end of the monetary divergence. That with a rebound from the oversold conditions of Friday allowed a rally in stocks, bonds and the dollar. Then around 12:30 pm came the confident reassurance from the capo de tutti capi of central bankers. Mario Draghi spoke with a deliberate & total assertion of power at the Economic Club in New York:
- “no limitation on deploying ECB tools, can deploy further tools as necessary, bottom line QE is here to stay, if needed, it could be recalibrated – expansion of balance sheet is monetary policy, should be used to the extent it is necessary, no specific limitation; we have power to act, determination to act, commitment to act”
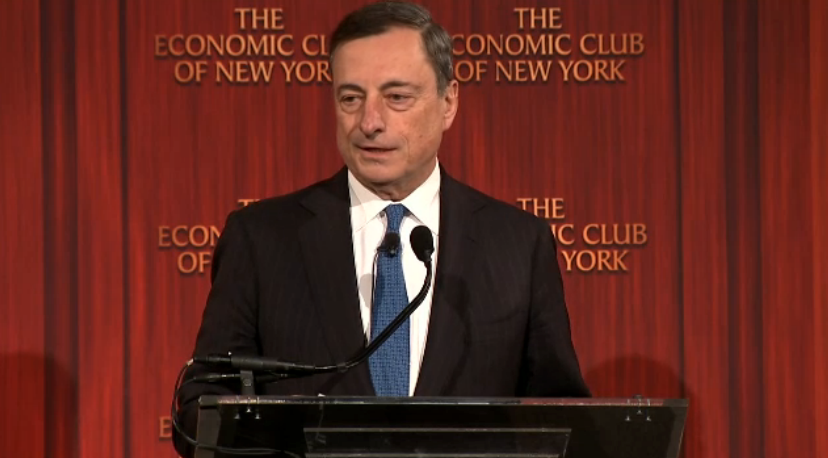
He was backkk and in full control. All worries about a coup vanished and the S&P went on an additional 20-handle rally in the next 3.5 hours. In fact, Dow, S&P, Nasdaq & NDX all rallied more on Friday that they had declined on Thursday. That was not true of Russell 2000 or of transportation index. But let us not quibble or bring up inconvenient & possibly irrelevant issues about breadth. Let us not forget we are in the final run into year-end.
The near certainty of a Fed hike on December 17th generated a rally in Treasuries. But unlike stock indices, the Treasury rally was only 40% of the decline on Thursday. The decline in the Euro on Friday was even weaker, just about 1/4 of the rise on Thursday.
The asset class that rallied on both days and whose rally on Friday was twice as large as its rally on Thursday was precious metals -Gold, Gold Miners & Silver.
The above goes to show that nothing matters more than the scale of the positioning at least in the final run into year-end. This positioning is based on monetary divergence and the continuation of QE in Europe first and in Asia after that. One can waste time discussing weak ISMs, retail sales, downgrade of Q4 GDP to 1.4% by the Atlanta Fed. The Fed is “desperate” to raise rates on December 17 and the 211,000 print in the NFP number on Friday has given the Fed a shining green light.
This monetary divergence is the certainty priced into the markets, meaning into positioning of large investors. And they served notice this past Thursday that central bankers risk peril if they shake this certainty.
2. US Stocks
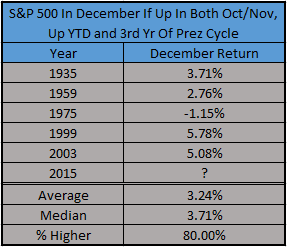
For those who are worried, Ryan Detrick offers the following statistical aspirins:
- Ryan Detrick, CMT @RyanDetrick – $SPX in Dec if up both Oct and Nov in 3rd yr of Prez and up YTD (like ’15 could be)? Dec +3.2% avg return. $SPY
- Ryan Detrick, CMT @RyanDetrick – New Post: Why Is December Usually Bullish For Equities? http://stks.co/d2w9l via @yahoofinance $SPY $DIA
http://ryandetrick.tumblr.com/post/134462390090/why-is-december-usually-bullish-for-equities
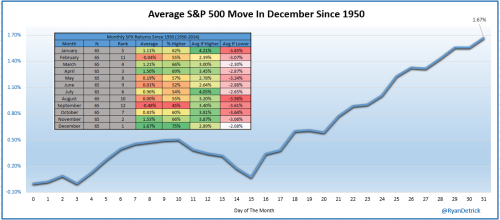
- Now here’s what the average December since 1950 looks like. What I find interesting is it tends to bottom near the middle of the month, before a strong end of year rally. This late year rally is widely known as the Santa Claus rally.
Does that mean jump in right away?
- Tsachy Mishal @CapitalObserver – ISEE equity at 170. Rallies have not fared well in recent months when the ISEE has been this high
How then?
- Urban Carmel @ukarlewitz – Strategy for next 2 weeks: get excited w/ any good-sized drop, be skeptical of any big gains from here $NDX $SPY
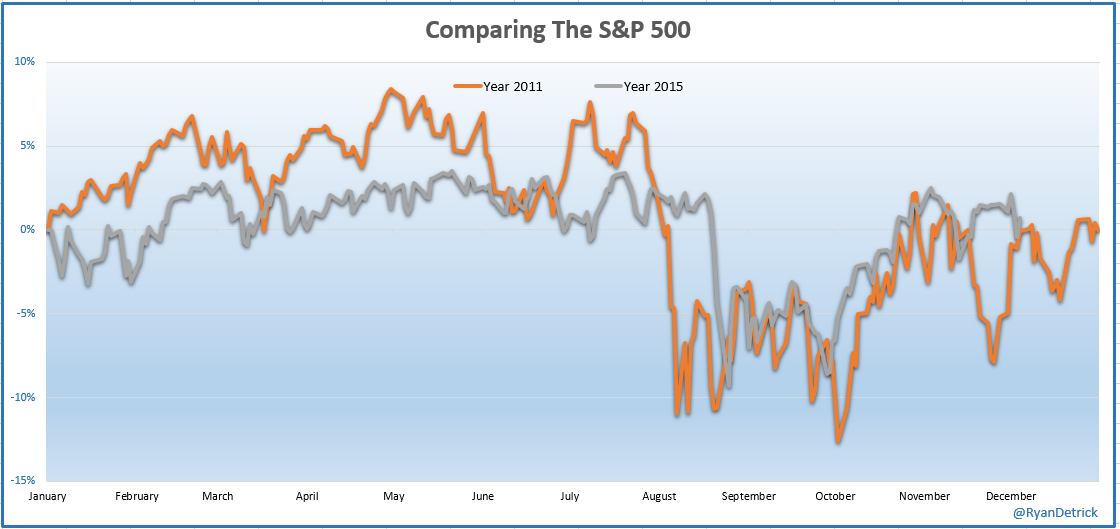
Because one parallel suggests that the highs might be close:
- Ryan Detrick, CMT @RyanDetrick – Here’s the 2011 vs 2015 updated charted. $SPX $SPY
But even Mr. Detrick could not resist providing a highly negative statistical parallel:
- Ryan Detrick, CMT @RyanDetrick – Huh. $SPX could move >1% (up/down) first 4 days of Dec. Did this in ’31, ’32, ’37, and ’08. Lost 47%, 15%, 38%, and 38% those yrs. $SPY
Not our business to either guarantee or handicap. But we guess Las Vegas boys would give very low odds for a 15% decline in the S&P in the remaining 26 days of 2015, forget about 38%.
3. Bonds
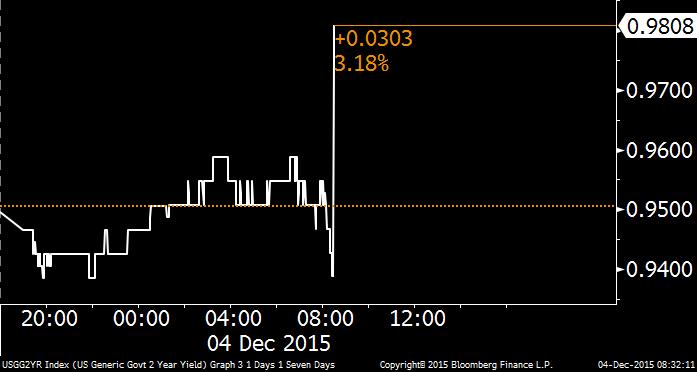
The 211,000 NFP number had an instant impact on Treasury yields:
- Joseph Weisenthal @TheStalwart – There’s your 2 year
- Michael McDonough @M_McDonough – 10Y Intraday:
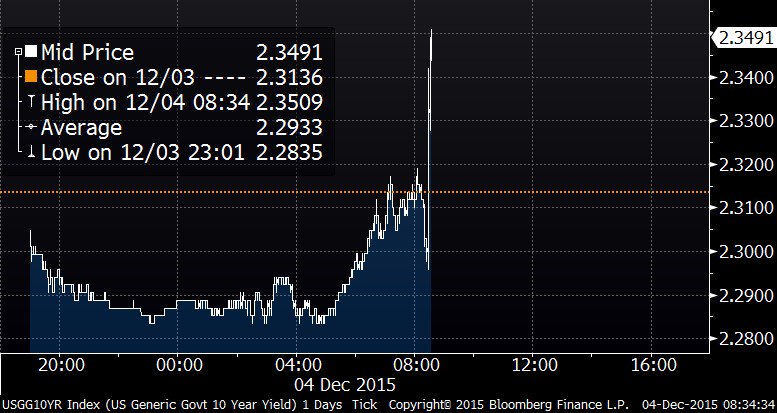
The trade of the morning was to fade the above rout. The 2-year yield closed at 94.7 bps and the 10-year yield at 2.27%, both below the closing levels of Thursday. The real question is the one posed a few weeks ago:
- Helene Meisler @hmeisler – But can the 5 yr get over 1.80%
The best chance is on post the FOMC meeting on December 17. If it doesn’t then, that would ring a bell. Would that be like the one below?

Is there a Bond rally ahead, asked an article via Advisor Perspectives:
- Are bonds about to rally? Our money flow model, based on hedge fund positioning, suggests lower yields ahead. (See attached chart.) This seems awkward going into a well advertised Fed tightening. But why argue with the message of the market? “Sell the rumor, buy the news” might easily apply.

But that is for Treasuries not for all bonds, especially for:
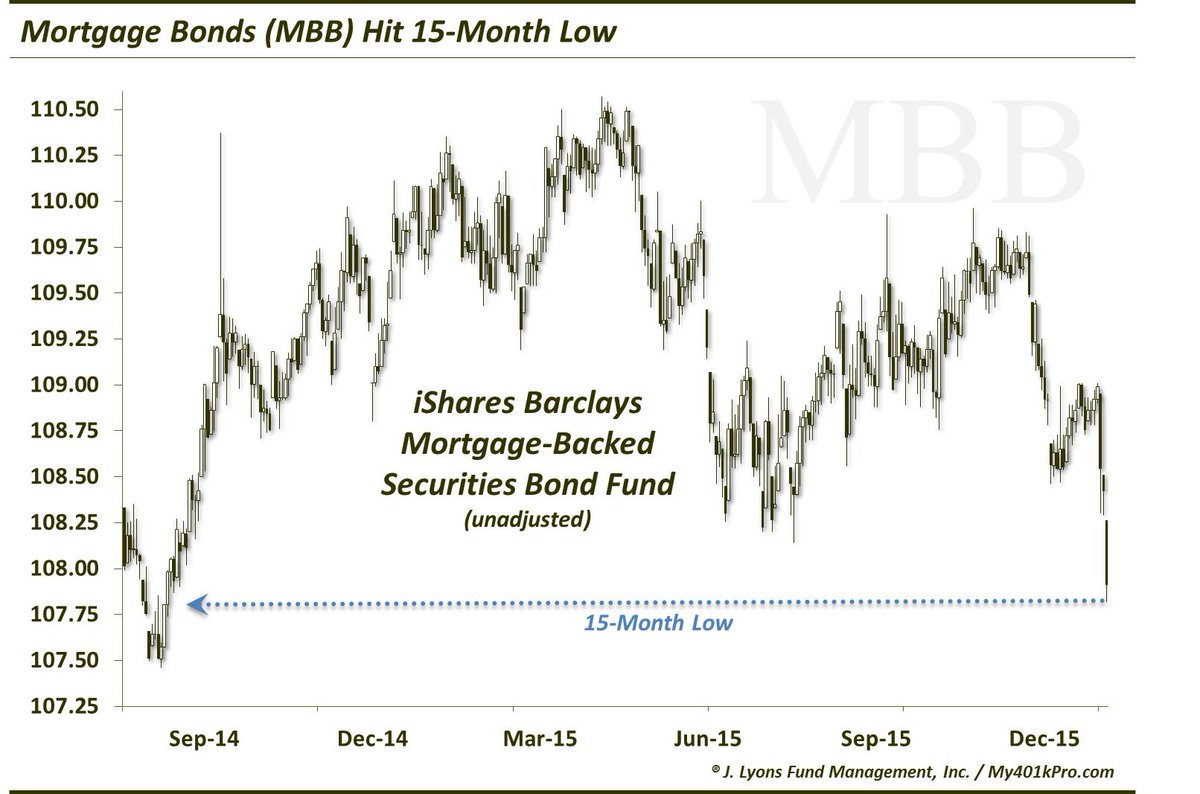
- Dana Lyons @JLyonsFundMgmt – Mortgage Bonds ($MBB) Hit 15-Month Low
What about Credit?
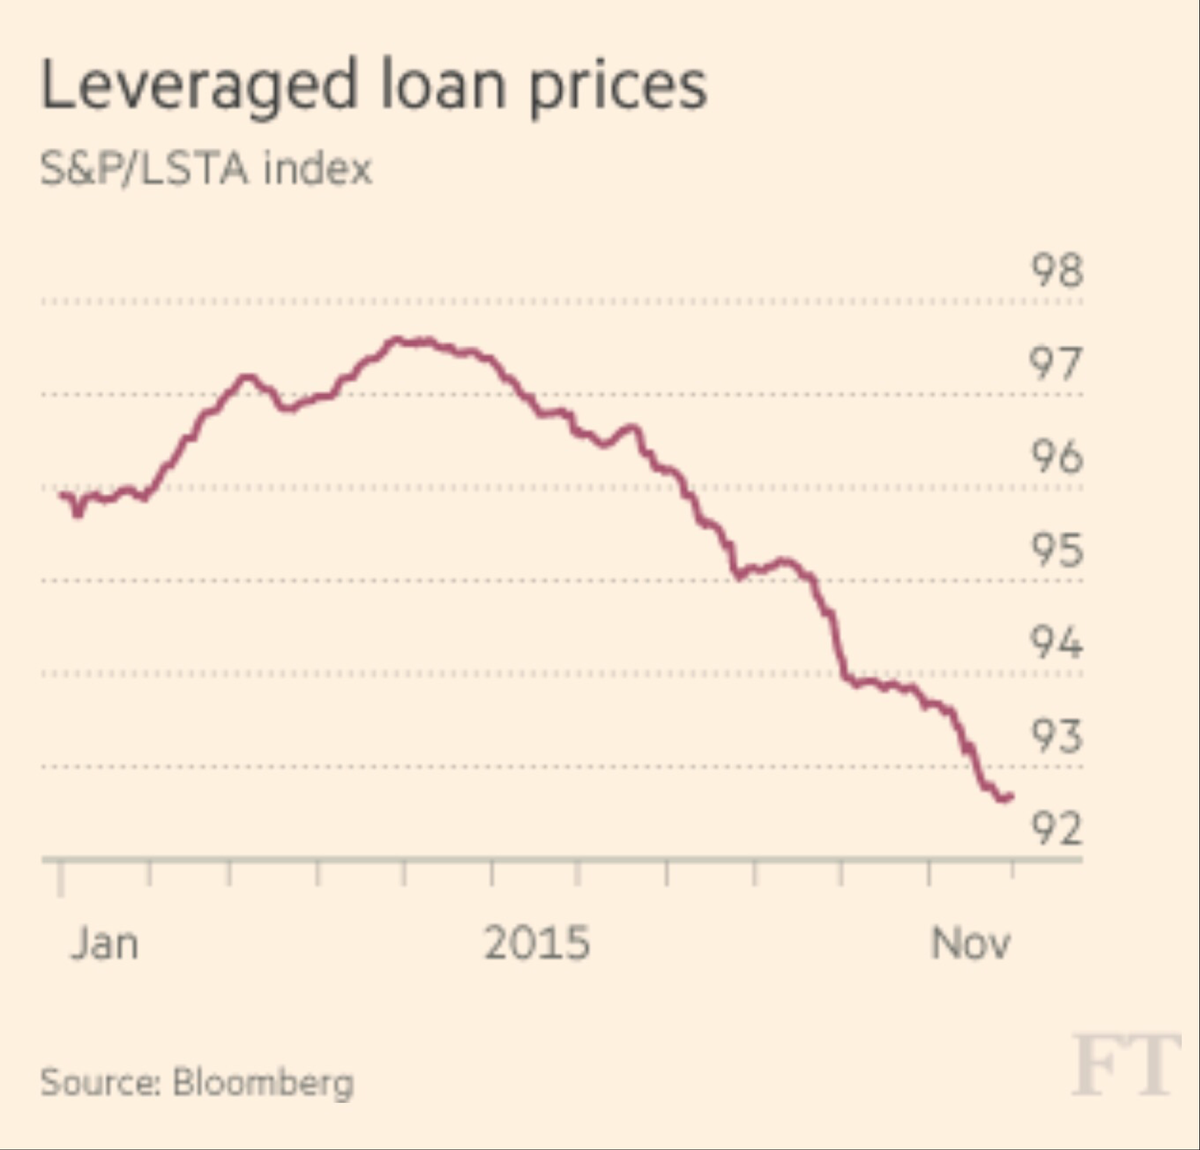
- Jesse Felder @jessefelder – FT: Signs of impending downward spiral in credit markets appear even before Fed policy move http://www.ft.com/intl/cms/s/0/d492cf34-973e-11e5-95c7-d47aa298f769.html
4. Dollar
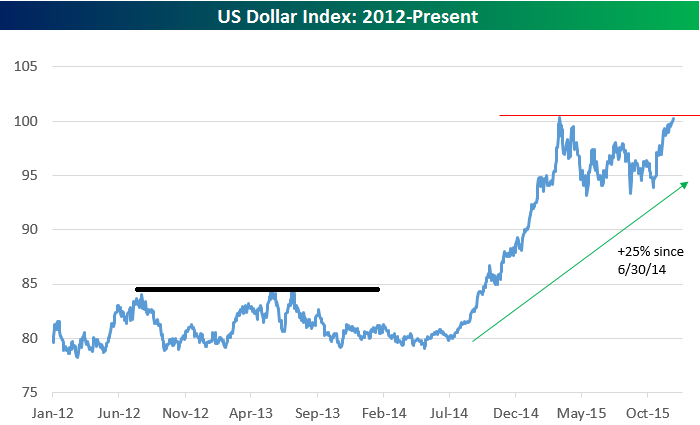
Raoul Pal called the sell off in the Dollar as “just a correction in over-positioning“. An opposing view was suggested in:
- Helene Meisler @hmeisler – Had similar line in 2013 (see my black line on your chart) https://twitter.com/
bespokeinvest/status/ 671412253619585024 …
5. Gold
Gold was the only asset class to rally on both Thursday and Friday. And Gold miners outperformed dramatically. In fact, Newmont Mining rallied by nearly 5% on Thursday and 9% on Friday. Is that a sign of a washout in sentiment towards Gold? Tom McClellan says yes and exhibits the following chart:
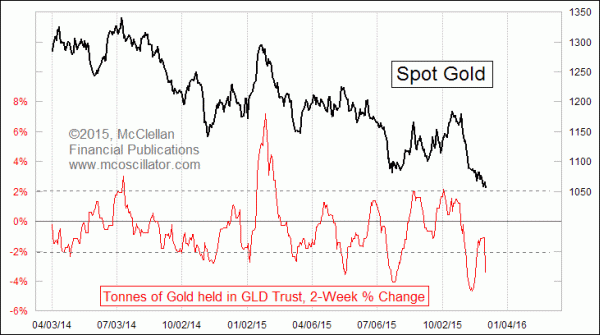
- Generally speaking, when this indicator goes outside +/-2%, it marks a turning point for gold prices. … So as the hot-money traders have been fleeing GLD (and gold futures too), the big-money and usually smart-money commercial traders are taking the other side of that trade. That says gold should see a rebound very soon.
One trader agreed and reported a large trade in GDX June 2016 15/20 call spread that was put on Thursday:
- Options Action @OptionsAction – Gold +2% & gold miners +4% today. Trader bets $2M that $GDX will rally another 40% by June http://cnb.cx/1QZ7kIa
6. Oil
Oil was run over by the disappointment about OPEC meeting ending without any production cut. Why do we say “run over”?
- Friday – Eric Scott Hunsader @nanexllc – crude dropped $1.75 in last 7 minutes $CL_F
In a little more detail:
- BI Markets @themoneygame – Crude oil is getting slammed after OPEC reportedly decides not to cut output http://read.bi/1QYAXJH
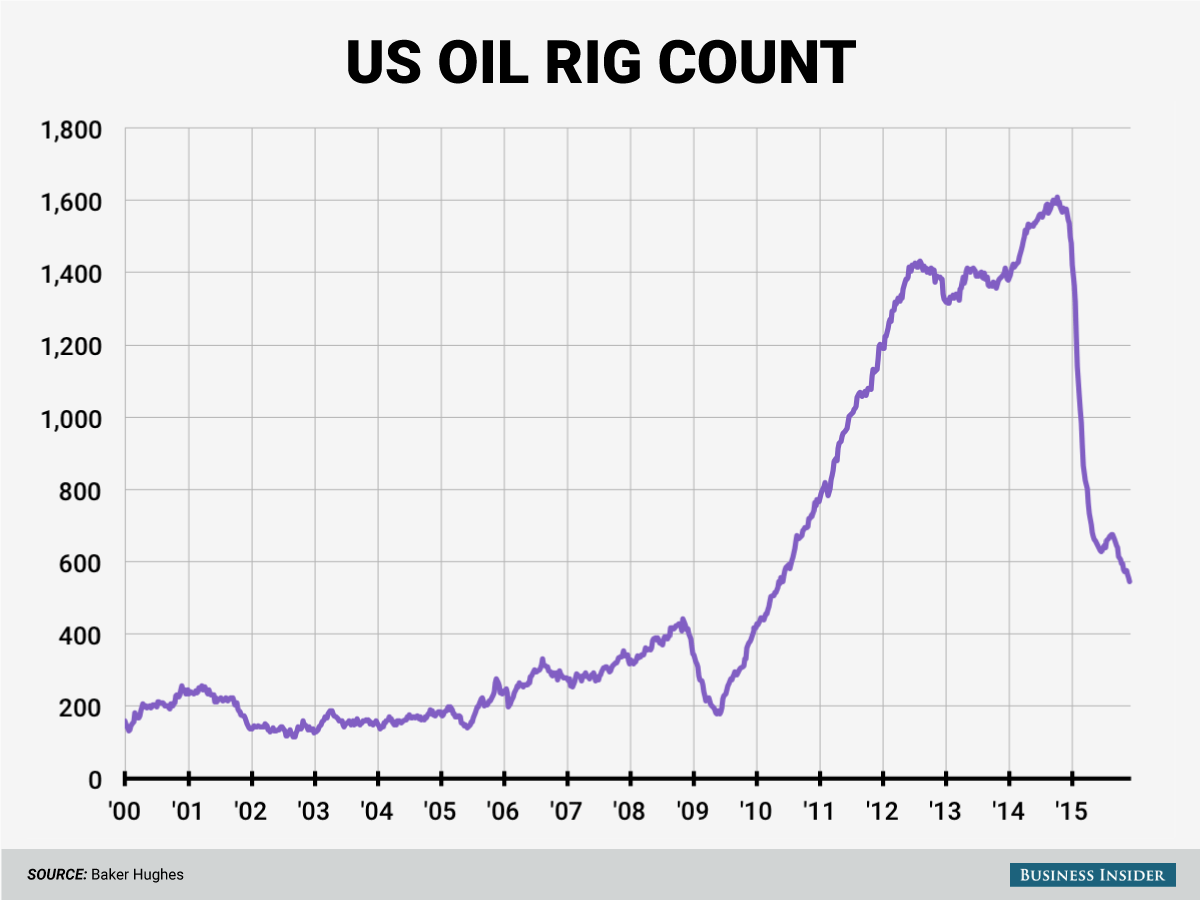
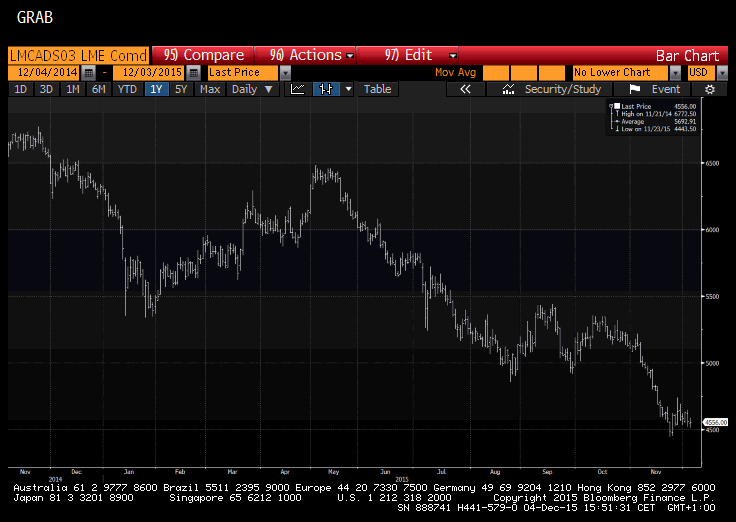
If the most important commodity acts so bad, what about a previously important commodity?
- Thursday – Raoul Pal @RaoulGMI – Yesterday was a big yawn for copper too… going lower still, relentlessly..
Ergo,
- Irrelevant Investor @michaelbatnick – Freeport below ’08 lows, has been a wild few months.
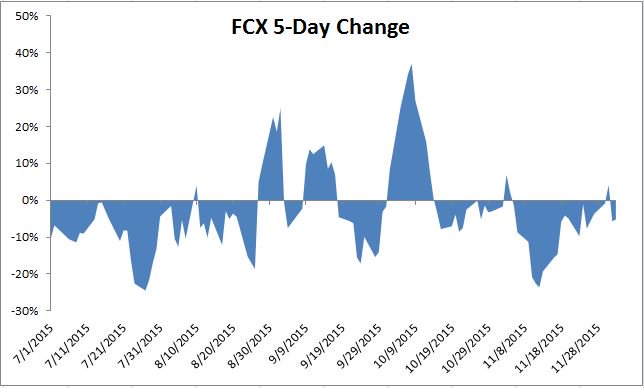
Interestingly, this seems to have driven a CNBC Options Action trader to suggest a risk reversal (open collar to topological enthusiasts) in FCX – Buy Feb 10 call & Sell Feb 6 put.
7. 2016 forecasts & themes
We saw a report that took down S&P earnings to $120.5 for 2016. Going back to David Tepper’s usage of 15 PE, we get $1807.5 for the S&P. To get to 2100, you need 17.5 PE on $120.5 of earnings. Expensive? Can we get a PE expansion in 2016? Only if Fed raises rates once this month and that proves it for 2016. Perhaps, not even then because the economy would have to remain insipid for the Fed to not raise in 2016?
Brian Belski of BMO Capital Markets suggests two scenarios for 2016, both bad:
- Scenario 1 – Intra-year cycle high of 2,350-2,400; Fed misstep leading to a correction; Recover to 2,100 by year-end
- Scenario Two – Markets tread water; Fed misstep leading to a correction; Recover to 2,100 by year-end
What about Credit Suisse?
- Bloomberg Business Verified account@business – Credit Suisse is now the most cautious it’s been on equities since 2008 http://bloom.bg/1TkuDKl
The Bloomberg article quotes:
- “We reduce our weighting in equities to a small overweight, our most bearish strategic stance on the asset class in seven years,” Credit Suisse analysts led by Andrew Garthwaite said in their 2016 global equity strategy outlook published today. In mid-November, the bank reiterated its previous call for the S&P 500 to reach 2,200 by the middle of next year. But the analysts seem to have since changed their minds and now expect the index to trade at 2,150 both mid-year and at the end of 2016. “Historically, the drawdown in equities has averaged 7 percent after the first Fed rate hike but the first rate hike has not marked the end of a bull market, … The risk on this occasion is that the first rate hike has not occurred this late into the profit margin cycle.”
On Friday, Goldman published their themes for 2016:
- GLOBAL GROWTH: MORE STABLE THAN IT LOOKS – GDP growth will grind higher to 3.5% from 3.2% as recovery from crisis continues – Labor markets will continue march toward full employment in economies such as the US, UK
- US INFLATION: LESS DOWNSIDE RISK THAN IS PRICED – Headline inflation will rise across developed markets, bringing core inflation closer to target
- MONETARY POLICY: DIVERGENCE IN DEVELOPED MARKETS – The Fed tightening cycle will go further than markets expect – Central bank divergence will drive the US dollar higher
- OIL PRICES: NEAR-TERM DOWNSIDE RISK, YEAR-END UPSIDE – Our base case is that oil does not breach storage limits and WTI ends year higher at $52/bbl
- RELATIVE VALUE IN COMMODITIES: OPEX OVER CAPEX – Commodity prices will remain “lower for longer”
- GLOBAL SAVING GLUT: IN REVERSE – “lower for longer” commodity prices will reallocate income from savers to consumers – This will drain one of the main contributors to the “global savings glut” – This shrinking glut will become more visible as global consumption and investment pick up
- US EQUITY UPSIDE: LIMITED BY THE `YELLEN CALL’ – US stocks have limited upside in 2016 as earnings rise and P/E multiples contract
- EM RISK: SLOWDOWN, NOT MELTDOWN – Emerging markets are better positioned than in previous crises to weather slower growth; countries with currencies pegged to the dollar are most at risk of difficult adjustments
- MARKET LIQUIDITY: THE ‘NEW NORMAL’ IS LESS – loss of liquidity in fixed-income markets is likely to resist
- CORPORATE EARNINGS: ONLY A TEMPORARY LOSS OF MOJO
Send your feedback to editor@financeworks.com Or @MacroViewpoints on Twitter