Summary – A top-down review of interesting calls and comments made last week in Treasuries, monetary policy, economics, stocks, bonds & commodities. TAC is our acronym for Tweets, Articles, & Clips –our basic inputs for this article.
Editor’s Note: In this series of articles, we include important or interesting Tweets, Articles, Video Clips with our comments. This is an article that expresses our personal opinions about comments made on Television, Tweeter, and in Print. It is NOT intended to provide any investment advice of any type whatsoever. No one should base any investing decisions or conclusions based on anything written in or inferred from this article. Macro Viewpoints & its affiliates expressly disclaim all liability in respect to actions taken based on any or all of the information in this article. Investing is a serious matter and all investment decisions should only be taken after a detailed discussion with your investment advisor and should be subject to your objectives, suitability requirements and risk tolerance.
1.”Negative Rates is the story this week“
said Rick Santelli on Friday adding “it will be the story for several weeks“. Look what happened on Friday after Dudley said categorically “negative rates should not be a part of the conversation“. The S&P rallied by another 20 handles into the close. The markets made it crystal clear this week that they do not like negative rates. QE is okay but not negative rates. The panic over the past two weeks was clearly triggered by Kuroda, the BoJ chief, who stunned the world by suddenly launching negative rates on Friday, January 29, after assuring his country & the Davos crowd just a week before that he would not do so.
Nothing is more damaging to banks than negative interest rates. And where do markets focus when they worry about systemically dangerous banks? Where Robert Engle & his team focused back in November 2011 – Deutsche Bank (DB). The Stern team had anointed Deutsche Bank as the world’s most systemically risky bank Global Systemic Risk Conference, hosted by the Federal Reserve Bank of New York.
And when DB totters, markets quiver. What do people do when gripped by intense fear? Run up into the hills. You just have to look at the charts of TLT or GLD to see an almost vertical rise in the chart. Not just merely vertical but asymptotically & parabolically vertical. The 10-year Treasury yield touched 1.52% and the 5-year yield touched 95 bps on Thursday morning per Rick Santelli.
Stocks fell hard on Thursday, down 400 points on the Dow, and touched 1810 just below the support level of 1812. Then magically & almost instantaneously stocks lifted vertical almost 200-250 points & oil spiked hard on a news report that UAE & others were talking about a oil supply cut. No one has been able to corroborate that news but it doesn’t matter. That was the moment when the run to the hills of Treasuries and Gold stopped and those shorting stocks began running away from their bonfire.
The big question is whether the multi-asset turn is just for this week or does it last awhile? Who better to opine on an exhaustion point in a major trend than Tom DeMark? And DeMark did opine on Thursday afternoon on BTV:
- IWM & Midcaps could qualify as a bottom as early as today; not in popular averages like S&P or Dow; that might take 2-3 days; we are going to undercut the low we made in January & the low we made today – could see market decline as much as 1746 on March Futures & 1792 on SPX; one caveat – we could go as low as 1746 in SPX intra-day and still come back above 1792 & make a low; Crude can bottom as early as tomorrow or Monday; at least 40% rally; We could see Bonds top out as early as 2 days; Gold can go its own way; Gold is going to continue rallying
Marc Faber also voiced the possibility of a spring rally on Thursday on FBN saying “market is very oversold; rebound is overdue; get spring rally but no new highs“.
Not did interest rates bounce from their lows on Thursday morning but the shape of the yield curve bounced as well:
- Charlie Bilello, CMT @MktOutperform – After hitting a cycle low of 94 bps, Yield Curve actually steepened today. Want to see more of this on a mkt bounce.
This is not a small issue. The flattening in the yield curve is deemed to be a measure of slowdown in the trajectory of the economy. And this turn in the yield curve came just a day before the Atlanta Fed raised their forecast for first-quarter real consumption growth from 3.0 percent to 3.2 percent and raised their Q1 2016 real GDP growth from 2.5% to 2.7%.

Nothing will dispel the current gloom, the pervasive fear about efficacy of the central banks than a positive turn in US economic data. If the markets can overcome their fear about the US going into recession, then everything might turn and not just for a day or two.
Such a turn in the data and the markets doesn’t have to invalidate the 2008 parallels or even dispel the recession thesis. The stock market & economic data did have a marked upswing in the spring of 2008 as well:
- Lawrence G. McMillan @optstrategist Is it looking like 2008 again? $SPX
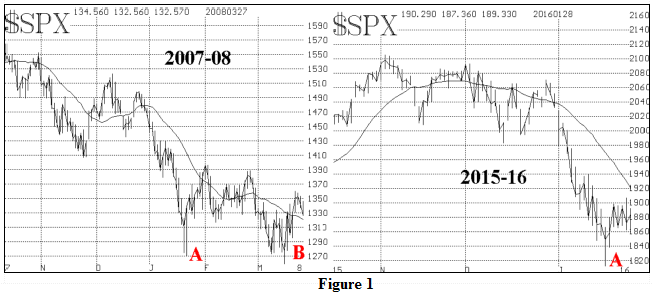
The central issue at this juncture is faith in central banks. Chair Yellen’s testimony this week did very little to restore that faith. President Dudley did manage quell the immediate concerns. We think, hope actually, that China & PBOC will act to further the newfound stability when they come back on Monday. Markets are the same despite their shaken faith. If they get a little bit of soothing, they can walk if not run with hope into the ECB meeting on March 10 and the FOMC on March 16.
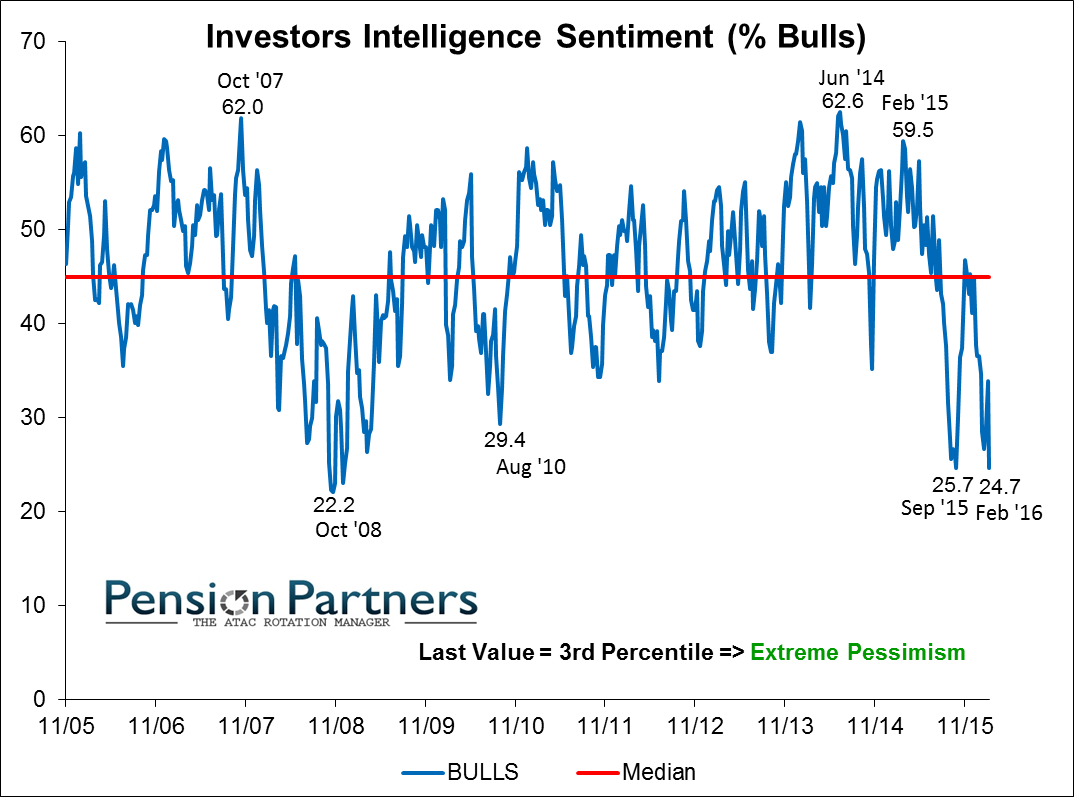
And sentiment is their ally at this juncture:
- Charlie Bilello, CMT @MktOutperform – % Bulls, Investors Intelligence Advisors Sentiment… Oct ’08: 22.2% Today: 24.7% (Cycle Low)
2. Bonds
First the secular or longer term forecast:
- Raoul Pal @RaoulGMI Feb 8 – US 10 year bond yield – last support until 1%… then next stop 50bps.
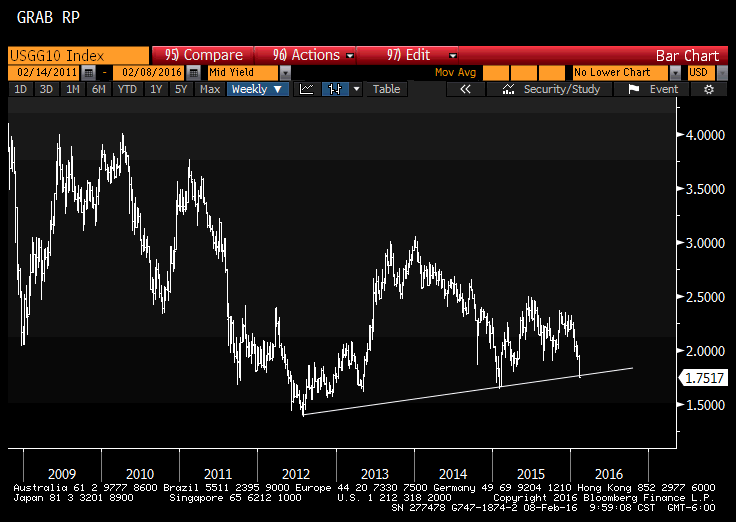
Rick Santelli had described the 1.15%-1.20% level in the 5-year yield as critical. On Thursday, the 5-year yield went through this support as if it didn’t exist. But by Friday, it snapped right back into this band. Does this band now act as resistance or will this level prove just as non-existent on the upside? If last two Februaries are any indication, the bounce in Treasury yields in February tends to last into early spring.
The more interesting comment about bonds came this week from Pimco:
- Bloomberg Business @business – Pimco says there’s no need to be greedy and bets on battered bank debt http://bloom.bg/1QZvMqJ
The article quotes Mark Kiesel of Pimco making a bold call:
- We haven’t been this excited about credit in about six or seven years. … I believe that investors all over the world will increasingly allocate more money to the credit markets throughout this year, … Now is the time to move into credit.”
According to the article, Kiesel sees “credit fundamentals being underpinned by a “healthy” U.S. economy that’s capable of generating 2 percent growth, with core inflation reaching 2 percent by the end of 2016“. Kiesel points out that “preferred stock in one of the strongest U.S. banks was offering about 8 percent“.
Recall that other Pimco managers, Bill Gross & Mohammed El-Erian to name two, urged investors to buy bonds of brokerage firms in the spring of 2008. That was a good trade until of course Lehman.
If credit is attractive to buy and since credit leads equities, are stocks attractive to buy as well?
3. Equities
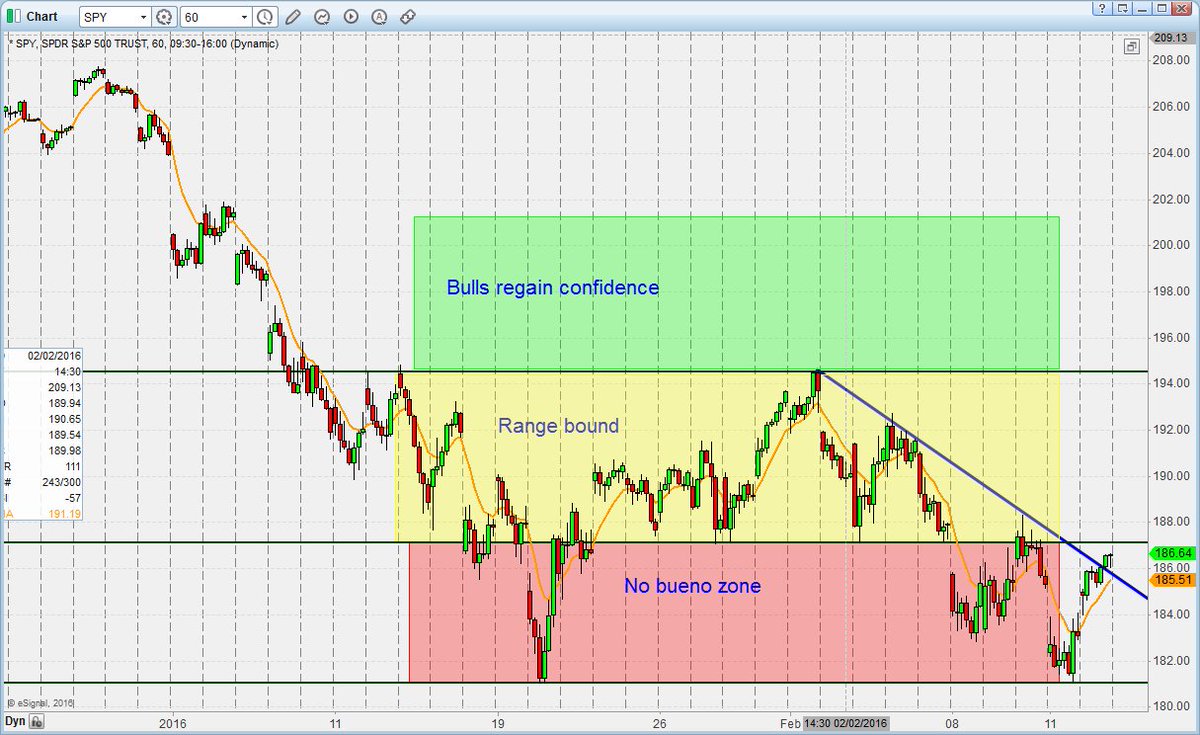
An interesting way to look at the picture for next week?
- HCPG
@HCPG – From double bottom to trend-line break– should be interesting week coming up$SPY
Lawrence McMillan of Option Strategist wrote in his Friday summary:
- We have buy signals from the put-call ratios, the first longer-term indicator to generate a “buy.” This can be traded, but as long as the $SPX chart is so negative, the intermediate-term picture will continue to be bearish.
Nothing converts a quick bounce into a rally like bad positioning:
- Tsachy Mishal @CapitalObserver – According to MS hedge funds are now positioned like they were at the 2010, 2011, 2012 lows. Only time their net got lower was Lehman
And,
- LPL Research @LPLResearch – Bullish sentiment near historic lows. What happens next? http://lplresearch.com/2016/
02/12/bullish-sentiment-near- historic-lows-what-happens- next/ …

The article points out:
- So what happens when the number of bulls is beneath 20%? One month later, the S&P 500 has been up by an average of 4.9% (median of 0.9%), and three months later by an average of 10.7% (median of 5.3%).
- Using an eight-week moving average, the AAII bulls are now lower than in March 2009 and March 2003. Those two times, of course, were near the end of major bear markets. Think about that—there are fewer bulls currently than there were at the depths of the last two major bear market lows.
What would the leadership be if we get a move like this? Jim Paulsen of Wells Capital said this week on CNBC Power Lunch that the leadership will move to producers from consumers. He suggests buying industrials, materials, energy, financials and selling consumer discretionary, staples, health care & utilities.
And speaking of financials, they seemed poised to do one or the other from the chart below from Dana Lyons of J.Lyons Fund Management:
Recall that Tom DeMark added the caveat that the market could undercut this week’s low before bottoming. If that happens on lower volumes, then that would be a final resolution low for this decline:
- Tom McClellan @McClellanOsc – This helps illustrate the difference between the momentum low, and the final resolution low.
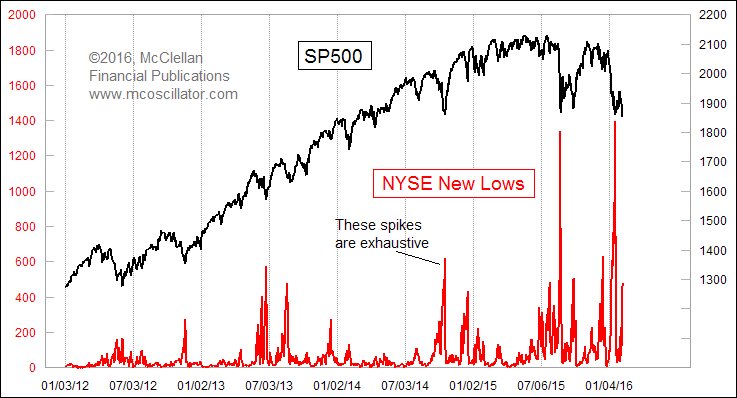
Of course all of the above could be writings on sand and the stock market could resume its nasty fall next week. In that case, as Steven Suttmeier of BAML said this week, S&P could go to 1600. He pointed out this week that NDX was breaking down relative to S&P and that SOX could be making a head & shoulders top. He argued that OEX or S&P 100 was becoming the leadership and small caps were breaking down.
4. Dollar
- Charlie Bilello, CMT @MktOutperform – The Dollar Index just turned negative on a year-over-year basis. $DXY
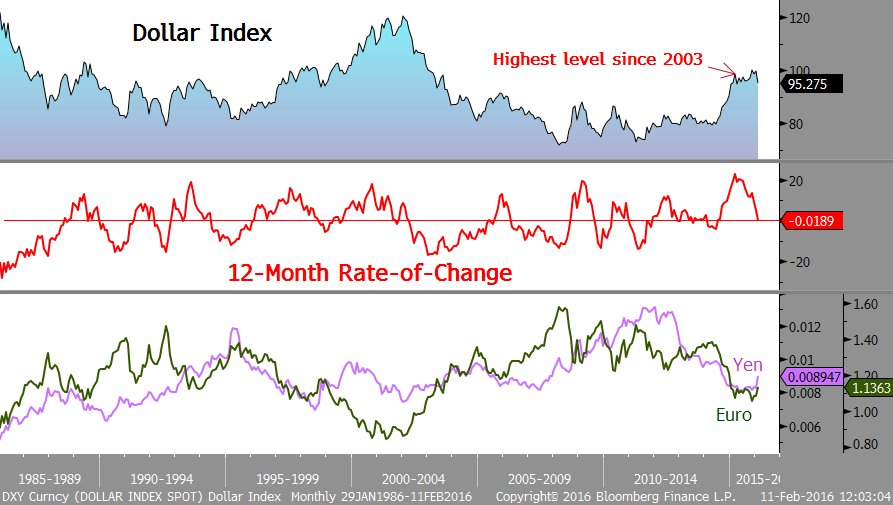
But Raoul Pal looks at it differently.
- Raoul Pal @RaoulGMI – $DXY – Failed at the obvious level. Now at obvious support. High chance it holds. Lower chance low 90’s. Easy stop.

5. Gold
Dennis Gartman turned bullish on Gold in Dollar terms but warned viewers to wait for a correction rather than buying early this week. Tom DeMark seemed resigned to Gold going higher as we quoted him in Section 1 above. Others are impressed by the breakout above the 200-day average:
- ValueWalk @valuewalk – 3 Reasons Why This Gold Rally Is The Real Deal http://www.valuewalk.com/2016/
02/3-reasons-why-this-gold- rally-is-the-real-deal/ … $GLD $GDX

- In a recent report, HSBC suggests that we could be in the early stages of a new gold bull market, one that will “probably” usher the yellow metal back up to at least $1,500. This “forthcoming market,” says the bank, “has the potential eventually to exceed the speculative frenzy seen in 2011.”
On the other hand,
- Chris Prybal @ChrisPrybal – Is the #Gold rally over? $GLD ‘Call’ Implied Volatilities are now greater than ‘Put’ IV’s for first time EVER!
-

5. Oil
The health of the world seems to depend on oil, at least on oil finding a bottom that holds for awhile. Nobody but Saudi Arabia can say when but positioning seems to be supportive and the rig count fell hard this week:
- Eric Burroughs @ericbeebo – WTI gross short 2nd highest ever, though gross longs up a tad
-
Send your feedback to editor@macroviewpoints.com Or @MacroViewpoints on Twitter
