Summary – A top-down review of interesting calls and comments made last week in Treasuries, monetary policy, economics, stocks, bonds & commodities. TAC is our acronym for Tweets, Articles, & Clips –our basic inputs for this article.
Editor’s Note: In this series of articles, we include important or interesting Tweets, Articles, Video Clips with our comments. This is an article that expresses our personal opinions about comments made on Television, Tweeter, and in Print. It is NOT intended to provide any investment advice of any type whatsoever. No one should base any investing decisions or conclusions based on anything written in or inferred from this article. Macro Viewpoints & its affiliates expressly disclaim all liability in respect to actions taken based on any or all of the information in this article. Investing is a serious matter and all investment decisions should only be taken after a detailed discussion with your investment advisor and should be subject to your objectives, suitability requirements and risk tolerance.
1.Carried out?
This was some week. Not in the US indices but in previously beaten down stocks, sectors & markets. If a three-hour questioning during a police detention can produce a 22% rally in a week like Brazil delivered this week, could our police please find someone to detail or question? We would volunteer either President Bush, President Clinton or both if that would make S&P rally by 22% next week. At the stock level, what about Freeport McMoran? That stock was up 41% this week on Friday morning but closed only up 31%. The action was so relentless that it felt as if some fund was being stampeded out of existence.
- Brattle St. Capital @BrattleStCap – This is one of the more brutal “short squeeze” days I’ve seen in years. Like, people getting carried out in body bags brutal
And last but not the least , the sector. The one that demonstrated that journalism remains the best contrary indicator ever:
- Helene Meisler
@hmeisler – Please note the date. 2/8

USO & BNO both closed up 10% this week with OIH, the Oil Services ETF, up 13%. The Broad indices didn’t do so badly either.
- Ryan Detrick, CMT @RyanDetrick – This is currently the 4th best start to March after three days for the SPX ever (3.54%). Only ’32, ’83, and ’02 were better. #MarchMadness
If you were long the Russell 2000, you would call the chart below as beautiful:
- HCPG
@HCPG – When is the last time you saw a 4 day trend on 15 min chart like this on a market index?$IWM

So what now? We will get to that in via detours.
2.Fed
You have to feel for Chair Yellen. Three weeks ago, the next Fed hike was going to be in 2018. Last week it was priced in for December 2016. Now in September 2016? And look at the speed of the change in the graph below. How can a deliberate body like the FOMC keep up with this?
- Charlie Bilello, CMT
@MktOutperform – Current market rate hike expectations… US: Sep 2016 UK: Aug 2019 Eurozone: Feb 2020 Japan: Mar 2020

On the other hand, are they deft enough to take advantage of this opportunity and raise by another 25 bps in March? What would you call it if they did so?
- Lawrence McDonald
@Convertbond – Smoking in the dynamite shed… I’m now more worried; the ego driven academics (zero clue on risk) on the Fed, might hike in March
This fear may have led to the sharp reversal in Gold & resource stocks on Friday afternoon. If a March hike fear is enough to cause a reversal, what would the forecast of 3.61% Federal Funds rate do?
- Holger Zschaepitz
@Schuldensuehner – Taylor Rule – based on inflation and unemployment rate – suggests that Fed should raise rate. (via BBG)

The 3.61% estimate, if realized. would not only invert the 10-FF yr curve but the 30-FF curve as well. And it would guarantee that the 100% recession prediction of Jim Rogers comes true.
3. Economy
- Bloomberg TV @BloombergTV – Jim Rogers: There’s a 100% probability of a U.S. recession within a year http://bloom.bg/1QxtdtU
On the other hand, David Rosenberg sees inflation right around the corner:
- ValueWalk @valuewalk – Inflation Coming Soon: David Rosenberg Running With The Bulls @MJonesValueWalkhttp://www.valuewalk.com/2016/
03/inflation-coming-soon- david-rosenberg/ … $$

- “My friends – the recruiting business is booming right now,” Rosenberg wrote on Thursday morning. “Companies are scrambling for talent, whether or not the stock market has become more hyper this year. Wages for lower-skilled jobs are in a visible uptrend, reinforced by hikes in the minimum wage, but make no mistake – there is a domino effect taking hold up the pay scale.”
4. Bonds
This fits in with the sharp rise in yields along the belly of the curve & the bear steepening of this week with 5-year yield up 14 bps. And it fits in the huge inflows in High Yield bond funds this week.
- vader @vader7x – $5.8bn inflows to HY bond funds (largest on record in absolute terms)

The flows worked this week with HYG & JNK up 2.2% and TLT down 1.5% – a 3.7% outperformance this week. This fit perfectly with Monday’s call by J.C. Parets to buy HYG & Short TLT.
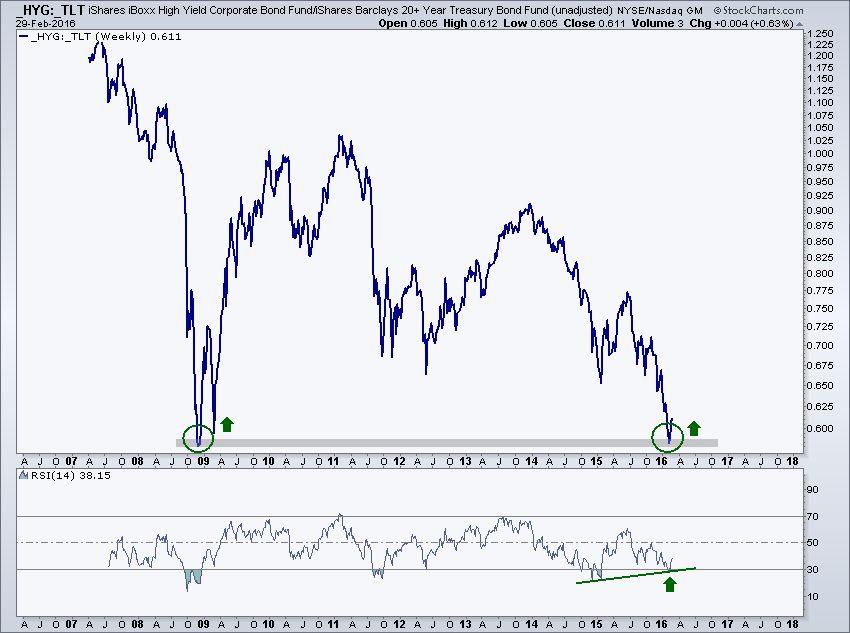
Parets wrote “not only do we not want to be short high yield anymore, but we want to be aggressive buyers as long as we’re above the February lows“.
A more negative message comes from a different & interesting angle – the link between margin debt and C&I loans:
- Jesse Felder
@jessefelder – NEW POST: Margin Debt’s Message For Investors Couldn’t Be More Clear https://www.thefelderreport.com/2016/03/04/margin-debts-message-for-investors-couldnt-be-more-clear/ …
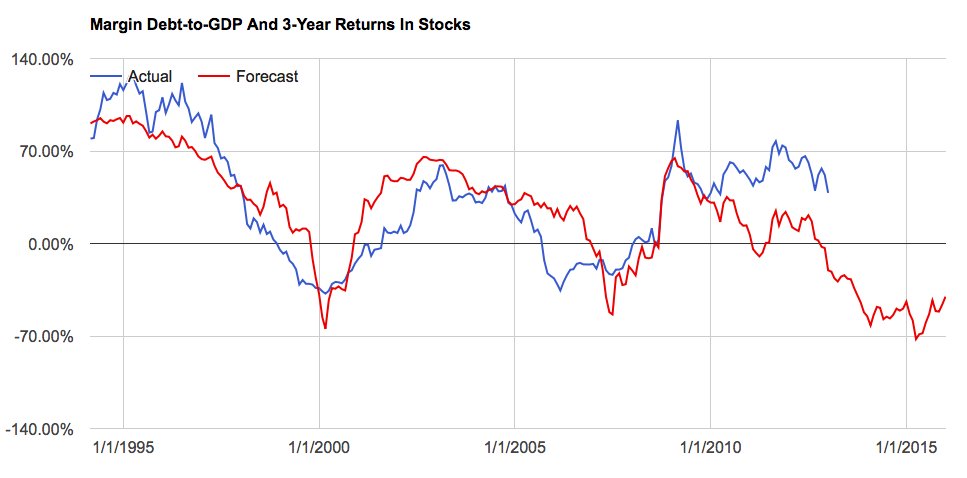
- “There are only two prior occasions where margin debt-to-GDP rose above 2.5% and then fell to a 2-year low. Those were March of 2001 and October of 2008“
But what does this have to do with C&I loans?

Felder writes:
- “As noted in the chart above, margin debt peaks have led peaks in commercial lending by about a year. The absolute level of margin debt peaked April of last year. If this relationship holds, commercial lending should begin to peak any day now. And we may already be seeing signs of the peak right now.”
- “As the economy has become even more finance-centric in recent years, it only makes sense that credit, which drives both asset prices and economic activity, would be correlated in this way. And the message for investors couldn’t be more clear: Pay very close attention to the larger credit cycle“
5. Stocks
A week like this one is not necessarily a sell signal at least not based on history:
- Ryan Detrick, CMT
@RyanDetrick – Out of the past 14 times the SPX gained >2.5% for the week (back to June ’12), it was higher the next week 11 times.
What is a near term target?
- Joe Kunkle
@OptionsHawk –$SPY – Hit 200 MA on highs today (Adjusted for Dividends) – move above 201 looks for flat for year 203.87, gap fill

A similar target from:
- Lawrence G. McMillan @optstrategist – The Option Strategist Weekly Updater 3/4/2016 – http://eepurl.com/bSZd0b
- In summary, we expect this rally to continue for the short term. There could be a sharp, but short-lived correction to alleviate what is now a very overbought breadth condition, but we would expect this rally to test the bear market downtrend line. What happens after that remains to be seen, of course, but we continue to view the longer-term outlook as bearish as long as that downtrend line is intact
But there is no question that the S&P looks way overbought. And how could it not be after a 200-handle rally in 15 trading days or so? But a chart always is better than words:
- Mella
@Mella_TA –$NYMO Nymphomaniacs !

The High-Low indicator seems to be giving the same message:
- David Larew
@ThinkTankCharts – NYHL indicator – not a timing chart, as it can go higher… but looking like a Top today

This weight of evidence seems to have brought two warring traders of CNBC – Grasso & Siebert – into agreement on Friday with the usually bullish Siebert as direct as we have heard him – “fade this rally beginning Tuesday-Wednesday; walk away from equities right now“.
But what about looking at the market from different angles?
- Dana Lyons
@JLyonsFundMgmt – (Post) Revenge Of The Median – via@YahooFinance$VALUG$QQQhttps://tmblr.co/Zyun3q22qmp9O
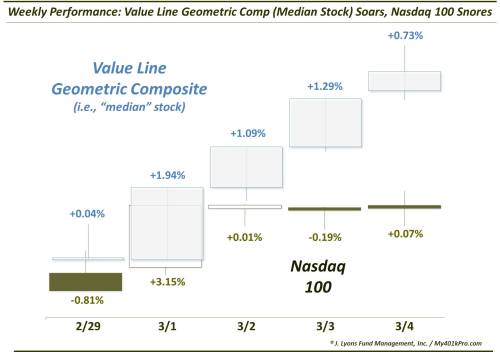
- “Since our NDX data only goes back to the early 1990′s, we looked at the Dow Jones Industrial Average for historical precedents when the VLG outshone its big-cap peers by such a large margin. Specifically, we looked at all days since 1969 when the VLG gained at least 1% on the day and the DJIA fell. As it turns out, there have been 25. The returns in the VLG have not exactly been stellar.”

On the other hand, a couple of gurus came on FinTV with S&P targets of 2300 by year-end. But we are not sure any of them called the downturn in January & February. One who did warn of the downside and now says a rally to new highs is possible is Carolyn Boroden, a colleague of Jim Cramer at RealMoney.com. Her reasoning is explained in detail by Jim Cramer in his article S&P could be headed for new highs.
6. Commodities, Gold & Oil
- Chris Kimble
@KimbleCharting – Commodities could bounce huge off the neckline, says Joe Friday!http://bit.ly/1QpWB7z

Kimble writes:
- “Regardless of whether you own commodities at this time, the world wants/needs this commodities index, to bounce off support at (1) above!“
- “Why is this level so darn important??? If the neckline gets taken out, the measure move suggests the index could work its way to the 200 level. I humbly feel this is a time that we want/need commodities to hold at the neckline. If they don’t, it could be a tad bit frustrating from a global macro situation, if commodities complete the measured move!”
Larry McDonald thinks the big rally in copper is a bear market rally:
- Lawrence McDonald
@Convertbond – Copper: Bear Market Rallies 2011: 29% 2015: 18% 2012: 17% 2016: 14%* 2014: 11% 2013: 10% Most significant since 2011, all led to new lows
This brings us to the best asset class of 2016
6.1 Gold
The action on Friday was something. As soon as the NFP number hit, GLD sold off very fast. Then it recovered, went to highs of the day and fell hard. The action in NEM was more intense. It rallied 7% from Thursday’s close just before 10:00 and then began falling. By the close it was down 6.6% from the morning high and down 2.7% from Thursday’s close.
Gold has been on a near vertical rise for the past 3-4 weeks with matching inflows:
- Tim Seymour
@timseymour –#GOLD with largest 4w flow total in 7 YEARS! accroding to BAML
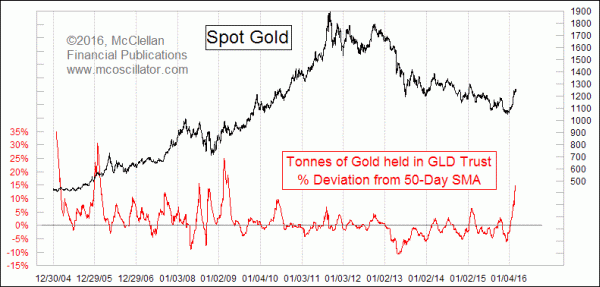
That could be a sign of a top wrote Tom McClellan in his article Gold Preps For New Trending Move.
- “Money has been pouring into GLD at the most rapid rate since early 2009, as investors are chasing the recent gold price pop. Those extra purchases can skew the share price, and so in order to keep the share price close to the net asset value, the sponsoring firm (State Street Global Advisors) issues more shares, and uses the proceeds to buy more gold bullion. This last chart looks at GLD assets, measured in terms of how far the total assets number is away from its own 50-day moving average. When there is a rapid rush like this into GLD, it is a sign of excessive speculation worthy of a top for gold prices“
What about Gold Miners?
- Tom McClellan
@McClellanOsc – Bullish % on gold miners highest since Sep. 2012 price top.http://stockcharts.com/h-sc/ui?s=%24BPGDM&p=W&yr=8&mn=0&dy=0&id=p01894898816&a=446187710 …

State Street might keep issuing more shares to keep the price of GLD close to its NAV. But BlackRock announced on Friday that they would stop issuing more shares of IAU, their ETF. This apparently is due an exhaustion of IAU shares currently registered. This is not a big deal in itself because registration of new shares is a documentary procedure. But this does goes to show how extended the demand of Gold has been. And that, as Tom McClellan says, could be a sign of a looming top.
- David Larew
@ThinkTankCharts – Gold – a Trump Huge negative RSI Divergence – Bearish. The volume to day was HUGE, last time they reversed them

All the above sounds highly reasonable and might well prove so. On the other hand, Draghi could surprise next Thursday and Gold could find a new stage of explosion.
6.2 Oil
Tom DeMark had talked about a 40% rally in his call in mid-February. Oil has already rallied by 38% from $26 to $36. So is Oil about to turn down like Gold? Wouldn’t it be interesting if it does just as the fundamentals have improved?
- Holger Zschaepitz
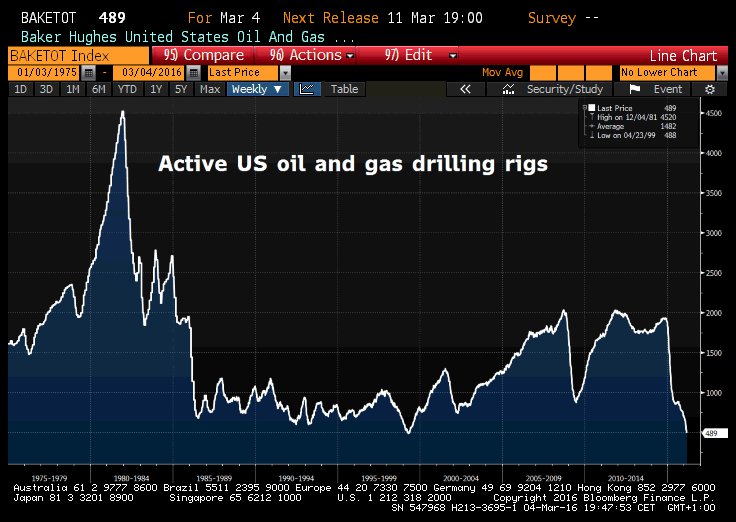
@Schuldensuehner – US Oil & Gas industry activity nears record low. Active drilling rigs drop to 489, just 1 rig above 1999 low of 488.
What we do know is that the positioning in every asset class is plain nuts and it represents, as Larry McDonald called it, a dynamite shed. And you have the world’s central banks going along blithely in their pursuit of whatever it is that they are pursuing. If they accidentally set off one little piece of dynamite? Frankly, we wish they would and create a glorious explosion that would cleanse us all.
Actually, dynamite explosions can be fun if you are the one throwing the stick or shooting at it.
[embedyt] http://www.youtube.com/watch?v=5wYjcoBYRUQ[/embedyt]
Send your feedback to editor@macroviewpoints.com Or @MacroViewpoints on Twitter