Summary – A top-down review of interesting calls and comments made last week in Treasuries, monetary policy, economics, stocks, bonds & commodities. TAC is our acronym for Tweets, Articles, & Clips – our basic inputs for this article.
Editor’s Note: In this series of articles, we include important or interesting Tweets, Articles, Video Clips with our comments. This is an article that expresses our personal opinions about comments made on Television, Tweeter, and in Print. It is NOT intended to provide any investment advice of any type whatsoever. No one should base any investing decisions or conclusions based on anything written in or inferred from this article. Macro Viewpoints & its affiliates expressly disclaim all liability in respect to actions taken based on any or all of the information in this article. Investing is a serious matter and all investment decisions should only be taken after a detailed discussion with your investment advisor and should be subject to your objectives, suitability requirements and risk tolerance.
1.Buying Everything
Except volatility. Anyone who reacts to data and sells something is made to feel foolish in a couple of days. Just look at last Friday. With that strong a payroll number, Treasuries & Gold were hit hard. A week later, the 30-year & 10-year yields are down 8 & 7 bps resp. and the yield curves, 30-5, 10-2, 5-2, all have flattened by 4 or 5 basis points. And the spread between Treasuries & Bunds narrowed by 5 bps in 30-yrs and by 3 bps in 10-yrs. Gold & Silver essentially are flat on the week and Gold miners are up 2-3%.
And US stocks, the star of NFP Friday, are virtually unchanged this week except the Russell 2000 that is up almost 4%. And Oil had a glorious 6%+ rally this week. So what asset class was down? Volatility ETF/ETNs with VXX down 2.8% and UVXY down 5.5%. So the markets are saying “what me worry”? That may explain the cognitive dissonance discussed by David Rosenberg in his article confusing market & smart money, dissonance that he is “not even sure Graham or Dodd could [make sense of] if they were still alive“:
- “Long bonds, short the Fed funds futures. Long equities but long bonds. Long gold but long equities. Long the dollar and long the precious metals”
One reason could be lack of fear in buying anything. The other could be flattening of the yield curve because Fed is going to make a mistake leading to Gold rally and stocks rallying because of T.I.N.A. after bond yields plummet & QEs are launched. That, of course, is another way of saying central banks have investors’ backs. So no worries. You see it just about every morning with futures up courtesy of Europe.
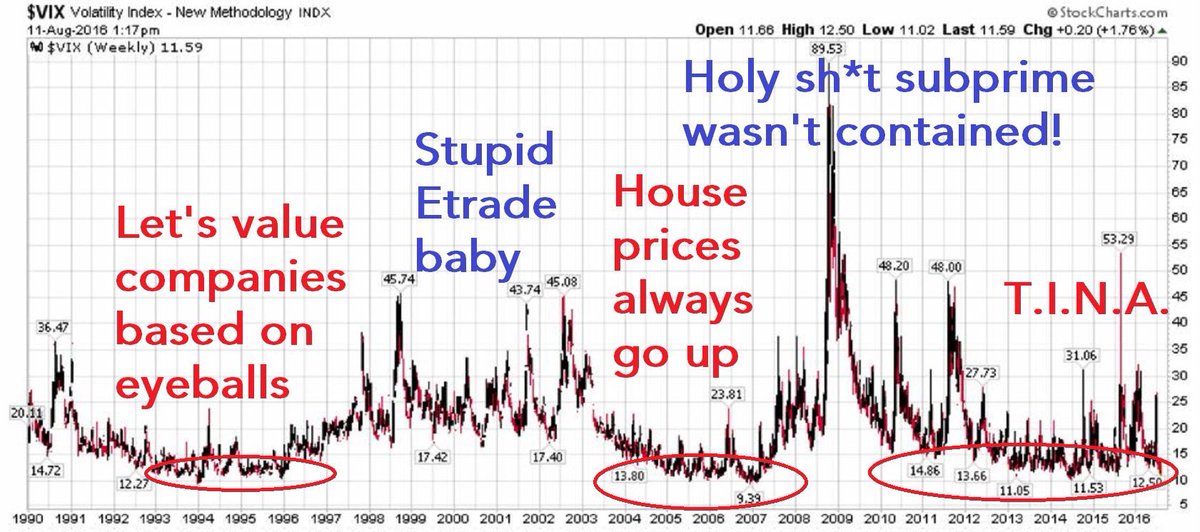
What happens eventually when there is no worry? We all know the bad story, best encapsulated below on Thursday, the day all three major indices hit all time highs, first time since 1999:
- Steve Burns @SJosephBurns – Aug 11 – A Brief History of the $VIX via @RudyHavenstein
But isn’t “quite period” another way to describe low volatility? If yes, then Tom McClellan has a different outcome suggestion in his Friday’s article:
- “… we have just seen one of the quietest 2-year periods in the SP500 in all of its history … Generally speaking, the answer is that the market starts moving upward again … The point is that most of the time, if something or someone does not interfere, these quiet periods are followed by strong new uptrends … “
The past two years have also marked an earnings recession in the S&P and now some, like Richard Bernstein, are calling for a new up cycle in earnings. That would be consistent with McClellan’s suggestion of a new strong uptrend. And as long as credit is ok, why worry? How ok is credit? Mike Swell of GSAM told BTV it is “bubblicious”. Another way of saying that is:
- David Rosenberg – “Debt-to-GDP ratios across the world at almost every level are higher now than they were when the financial crisis nine years ago“
So what will create a big enough disturbance to shake Rosenberg’s cognitive dissonance? A believable rate hike by the Fed. Next week is one opportunity for Chair Yellen to signal her intentions in the Fed minutes. Another one is two weeks away at Jackson Hole.
2.Inflation Expectations
Here is where the two old colleagues disagree:
- Rosenberg – There is simply still too much excess capacity for inflation to be sustained
- Bernstein – Inflation expectations may have bottomed. The 5-year 5-year forward breakeven, supposedly the Fed’s favorite measure of inflation expectations, may have bottomed last February
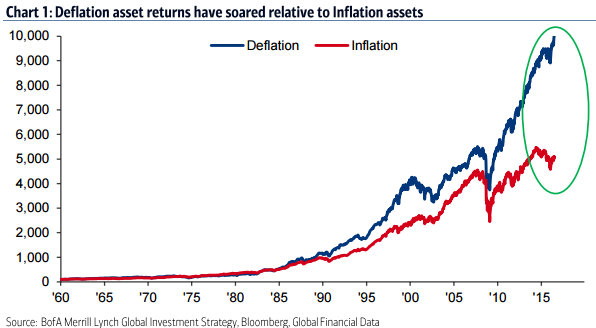
Clearly deflation is still feared as the greater risk than inflation as the chart below in the FT shows:
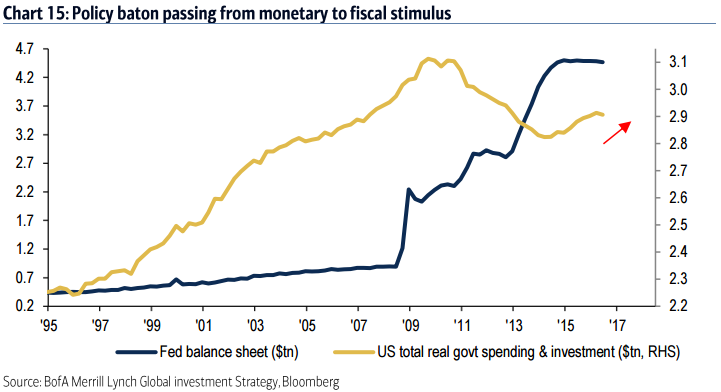
The expectations for inflation seem to be arising not from real evidence (after all producer prices fell in July) but from expectations of a transition from monetary stimulus to fiscal stimulus.
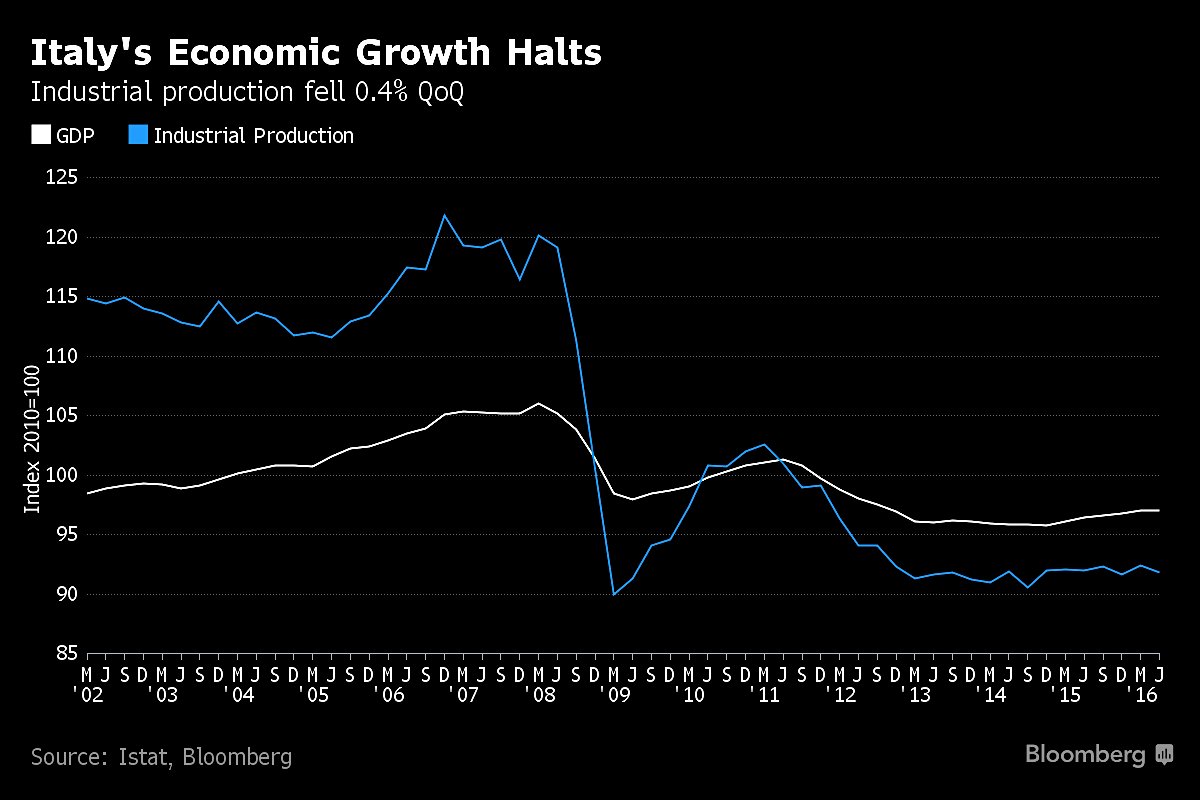
This week’s flattening of the yield curve seems to suggest this new future is ways away. How can inflation jump when Southern Europe is going downhill, downhill enough to cause another political crisis?
- Holger Zschaepitz
@Schuldensuehner –#Italian economic growth unexpectedly halts in a threat to Renzi future. http://bloom.bg/2aQJsG2
Yet, the action in Treasuries is tepid at best despite Friday’s rally. J.C. Parets made a case for shorting bonds a few days ago:
Frankly, as we have said before, the Fed beats any chart any day at least these days. And we will get minutes of the last FOMC meeting next week.
3. Equities
Richard Bernstein, Tom McClellan and LPL Research (last week) are writing about a new uptrend in US stocks. Against them are billionaire luminaries including Druckenmiller, Soros, Sam Zell, Carl Ichan, Bill Gross, Steve Wynn, Jeffrey Gundlach. Guess whose side CNBC took this week? They scoffed at worry warts in their segment Billionaire Bubbles. That should give Bernstein et al serious pause. CNBC has a pretty solid reputation of blowing major inflection points – remember Qualcomm, Qualcomm in April 2000 & Global Liquidity, Global growth in late 2007?
What does the usually succinct Lawrence McMillan say?
- “In summary, the anecdotal evidence of a top keeps growing as media commentators and analysts trot out statistics about seemingly dire things such as the Fed, the Presidential Election, Donald Trump, the Global economy, and the large number of big names who are short — Soros, Icahn, Gross, etc. But few of those things are measurable — they are just arbitrary opinions. In reality, the $SPX chart is bullish, and so are most of our indicators. Hence we remain bullish“.
On the other hand, some are getting concerned about valuations:
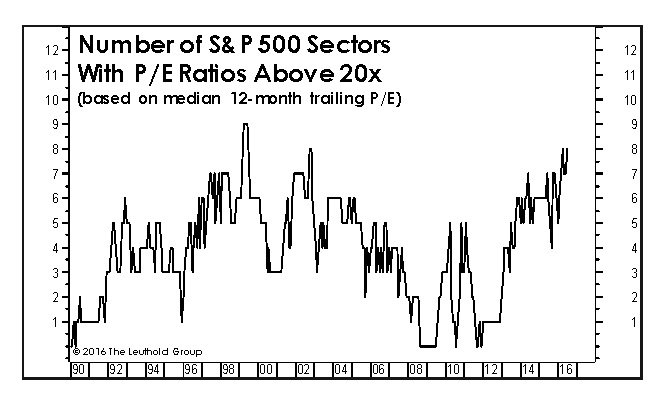
- The Leuthold Group @LeutholdGroup – Tough market for #Value managers. Widest sector #overvaluation since 2002; 8 of 10 are >20x trailing #EPS $SPX #PE
Does that mean?
- Alan Farley @msttrader – Utilities Signaling New Risk-Off Rotation $NI $EIX
On the other hand,
- J.C. Parets
@allstarcharts – [Chart Of The Week] Industrial Stocks Are Breaking Out! http://allstarcharts.com/?p=44108$XLI
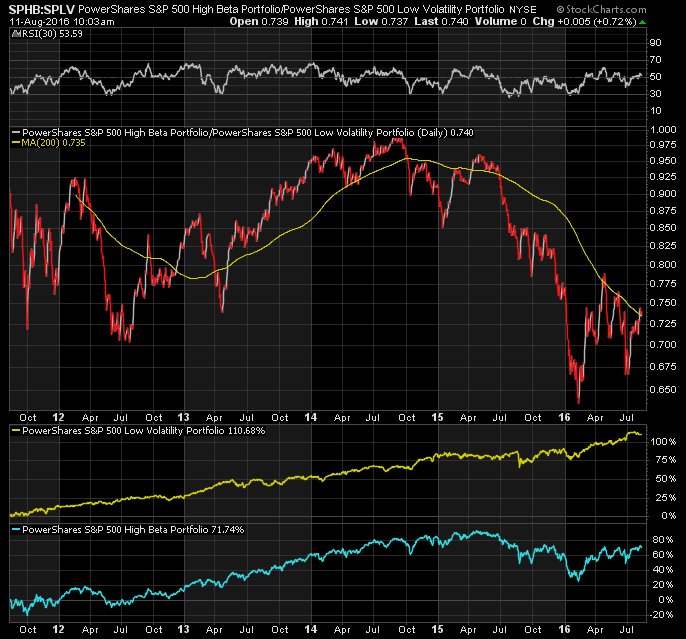
What would mark a real leadership change?
- Pension Partners @pensionpartners – High Beta has underperformed Low Vol by over 3000 basis points since 2011. Reversion coming? http://www.pensionpartners.com
/blog
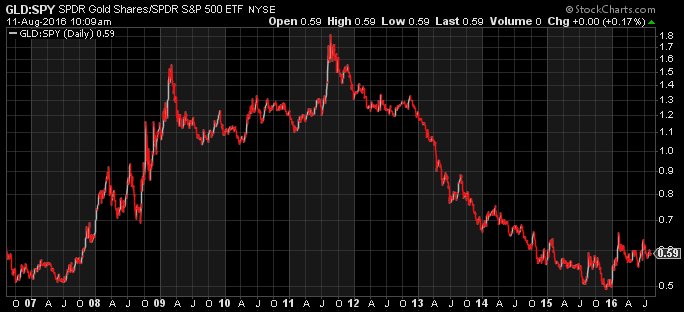
How about a different way to look at S&P?
- Pension Partners @pensionpartners – Gold/S&P 500 Ratio also very early. Reversion coming here?http://www.pensionpartners.com
/blog
That brings us to:
4. Gold, Silver & Miners
Gold shot up $16 on Friday morning after the flat retail sales number. Then it gave it all back in the afternoon to close negative. Nasty reversal indeed. Similar reversal in Silver and in miners. Does that mean anything? We don’t know and we really don’t care much because next week’s Fed minutes should be more material to direction of Gold than any technical indicator.
Having said that, we can’t resist pointing out:
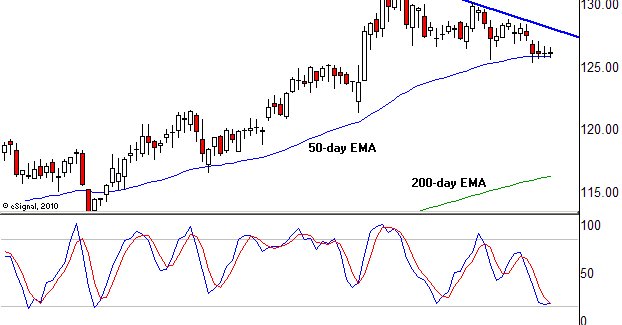
- Dana Lyons
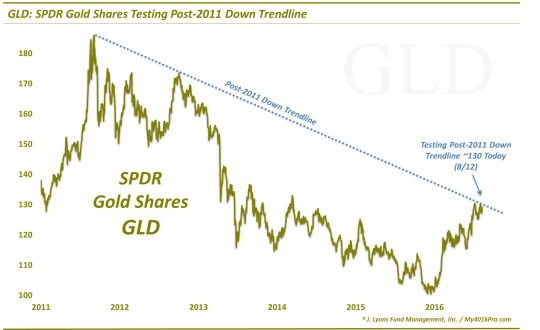
@JLyonsFundMgmt – ICYMI>ChOTD-8/12/16 Can Gold Vault Over This Key Level?$GLD Post:http://jlfmi.tumblr.com/post/148848491005/can-gold-vault-over-this-key-level …
He writes:
- Down trendline (on a linear scale) starting at the 2011 highs and connecting the October 2012 highs. Extending that trendline to the present places it at approximately 130. Today’s high before the pullback was 129.26.
- The bad news is that this trendline should serve as stiff resistance for the time being, absent a Simone Biles-like vault over the line. The good news is that the GLD has already twice tested the trendline, in early July and early August. These tests should have served to weaken the trendline somewhat. And the resilience on the part of the metal in avoiding a deeper pullback so far suggests that an eventual vault over the trendline should be forthcoming at some point.
J.C.Parets is not ambivalent:
- J.C. Parets
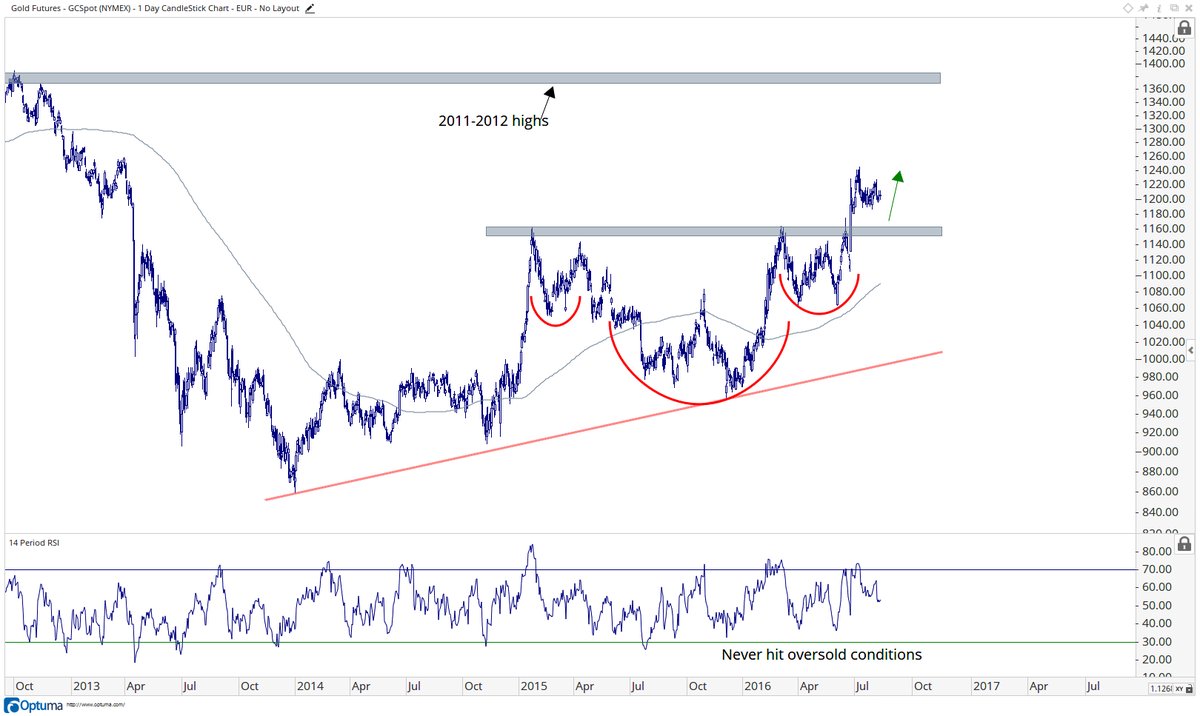
@allstarcharts – Gold is NOT a US Dollar story. It’s a Gold story. Here is Gold making new highs priced in Euro$GC_F$GLD$EURUSD
On the other hand, Chris Kimble has a warning to Gold & Silver bulls – You don’t want weakness here:
- Gold & Silver bulls DO NOT want to see weakness or reversal patterns taking place at these price points at (1).
- The Power of the Pattern is of the opinion, this is THE most important test of resistance for Silver, since the highs in 2011.
Of course, we will still focus on what the minutes say. Nothing is more important than the Fed for Gold in our humble & uninformed opinion.
5. Oil
At least we can hope to decipher the Fed to get some edge on Gold. But to get an edge on oil, you need to know what Saudis say and how much of that they really mean. Oil exploded up by 6%+ this week. Why? Saudis hinted they might get more disciplined in the next OPEC meeting. That stuff is Arabic to us or should we say Iranian?
Send your feedback to editor@macroviewpoints.com Or @MacroViewpoints.com
