Summary – A top-down review of interesting calls and comments made last week in Treasuries, monetary policy, economics, stocks, bonds & commodities. TAC is our acronym for Tweets, Articles, & Clips – our basic inputs for this article.
Editor’s Note: In this series of articles, we include important or interesting Tweets, Articles, Video Clips with our comments. This is an article that expresses our personal opinions about comments made on Television, Tweeter, and in Print. It is NOT intended to provide any investment advice of any type whatsoever. No one should base any investing decisions or conclusions based on anything written in or inferred from this article. Macro Viewpoints & its affiliates expressly disclaim all liability in respect to actions taken based on any or all of the information in this article. Investing is a serious matter and all investment decisions should only be taken after a detailed discussion with your investment advisor and should be subject to your objectives, suitability requirements and risk tolerance.
1.Football’s got nothing over markets
Despite being an ardent football fan, we must concede what we have seen over these past two weeks is so much more explosive than any offensive burst in football. Historical records fell in just about everything:
- Charlie Bilello, CMT
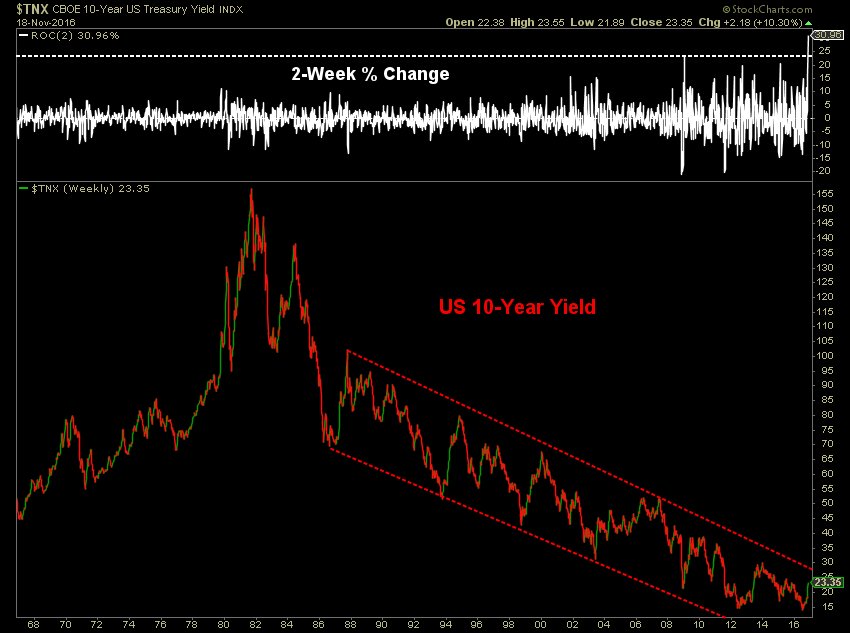
@MktOutperform – US 10-Year Yield up 31% in the past 2 weeks (1.78% to 2.33%), the largest 2-week % increase in history.$TNX
- Charlie Bilello, CMT
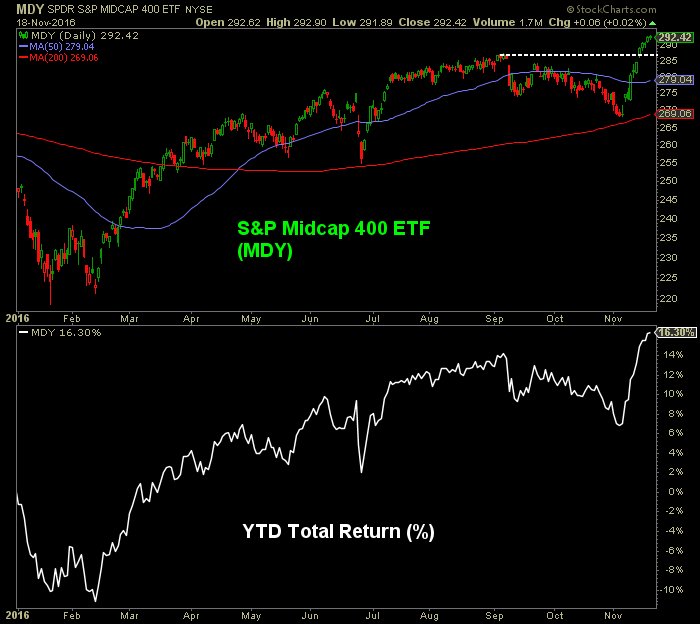
@MktOutperform – S&P Mid Cap ETF is up 11 days in a row, the longest streak in its history (inception: 1995).$MDY
- Charlie Bilello, CMT
@MktOutperform – King Dollar up 10 days in a row, one of the top 5 longest streaks in history.$DXY
And
- Charlie Bilello, CMT
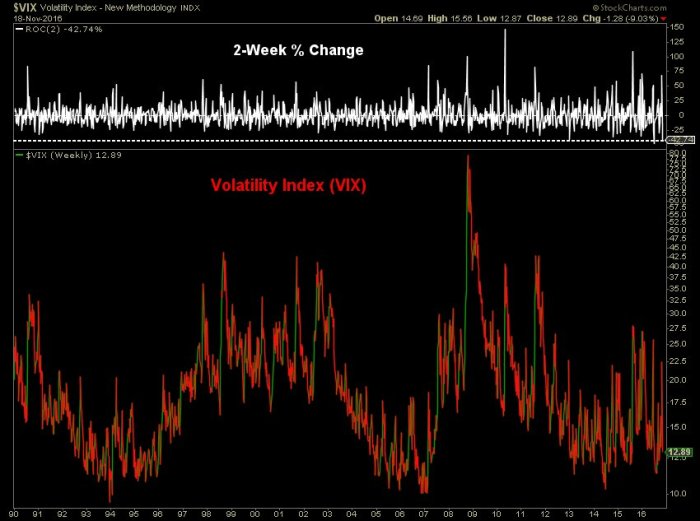
@MktOutperform – Volatility Index: -43% over the past 2 weeks, 2nd largest 2-week decline in history (#1: 2 weeks after Brexit).$VIX
- Ryan Detrick, CMT
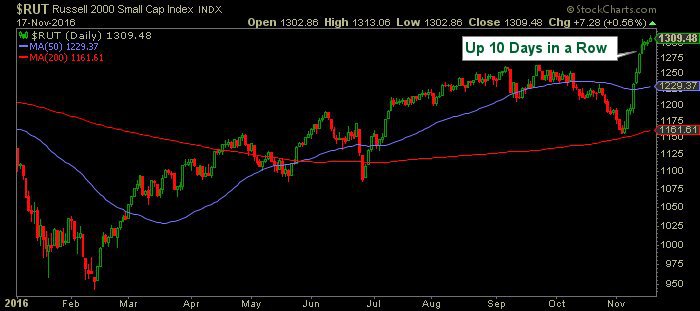
@RyanDetrick – Small caps are up 11 straight days for the first time in 13 years.
Dow, Russell 2000 and equal-cap S&P 500 all reached new all time highs this week. But the S&P 500 is still short of making a new all-time high. Given the positive seasonality, we think it is a matter of time until S&P 500 also reaches a new all time high. And then there is this:
- Ryan Detrick, CMT
@RyanDetrick Since ’91, the Russell 2000 with 16 previous 10-day win streaks. Looks bullish. Median Returns after up 10 days: 1 mo – 3.0% 3 mo – 5.1%
Well, that’s history. Now what?
Carter Worth, resident technician at CNBC Options Action said on Friday stocks are the secondary factor and that its “all about yields & currency“. Tom McClellan had tweeted a similar message on Tuesday:
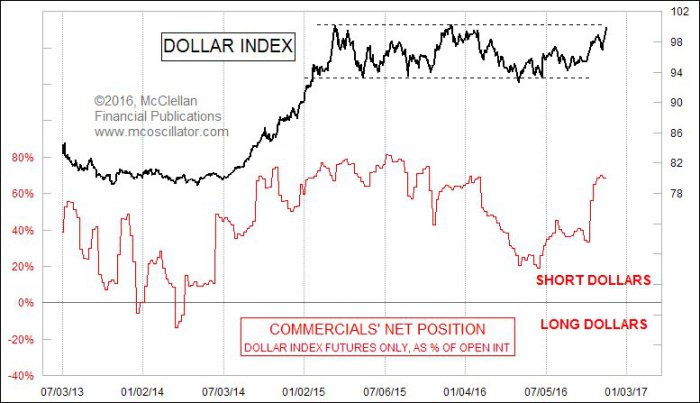
- Tom McClellan @McClellanOsc The dollar rally and bond selloffs are 2 sides of same coin. And commercial futures traders betting strongly the other way on both.
Who are we to disagree with these two august analysts? So we focus first on Dollar & Treasury yields.
2. Dollar
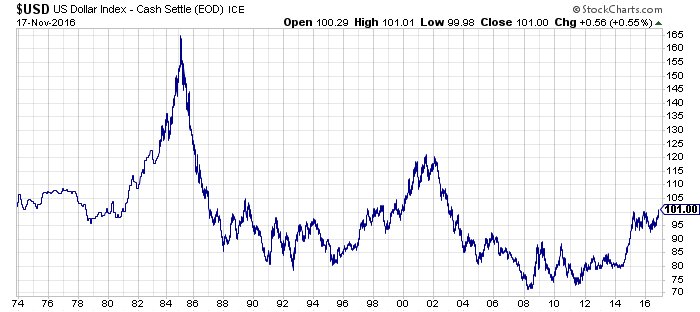
To put the Dollar rally in long term perspective:
- Eddy ElfenbeinVerified account@EddyElfenbein – The US Dollar Index is at a 13-year high. Here’s what the 40-year chart looks like.
If you take a close look, you will see that the Dollar is just about where it was at the end of 2000 and just before President George W. Bush took over. In the next two years, it rallied to 120. What might the Dollar do after President Trump takes over?
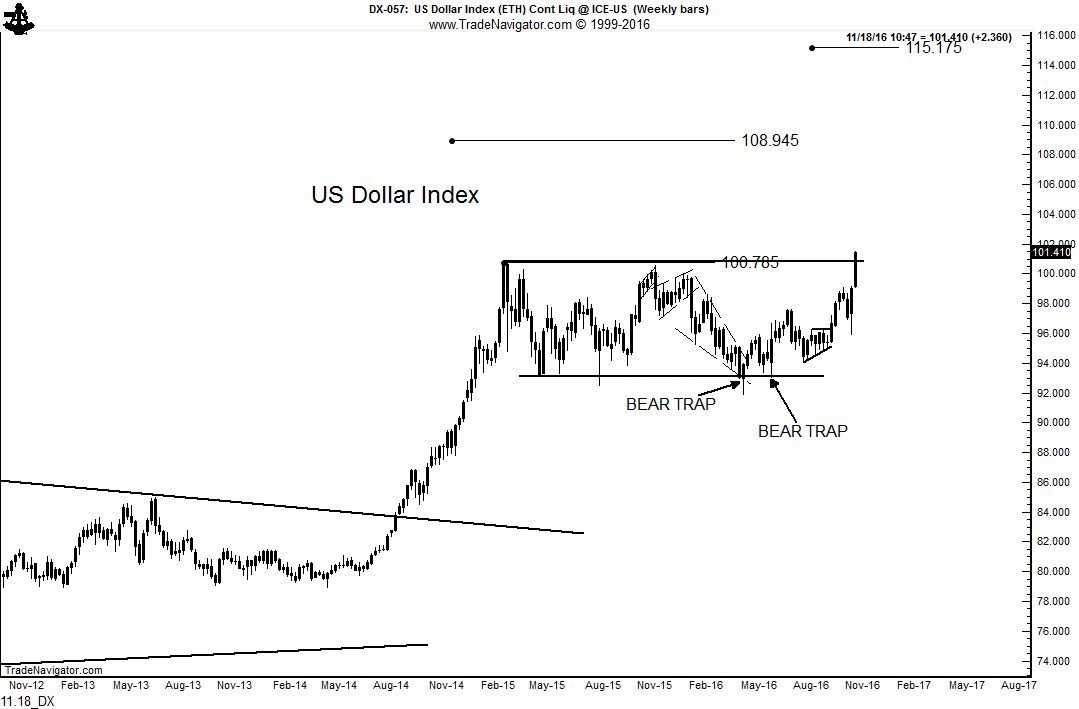
- Peter Brandt@PeterLBrandt – #FACTORMEMBERS U.S. Dollar Index $UUP$DX_F is breaking out of 20-month rectangle. Long.
Recall that the two year rally in the Dollar from 200-2002 coincided with a recession, a severe slowdown in trade & a bear market in stocks. What about now?
- Raoul Pal @RaoulGMI – I am getting more and more convinced that the offshore dollar shortage is going to be the big story of 2017 but first we need a correction.
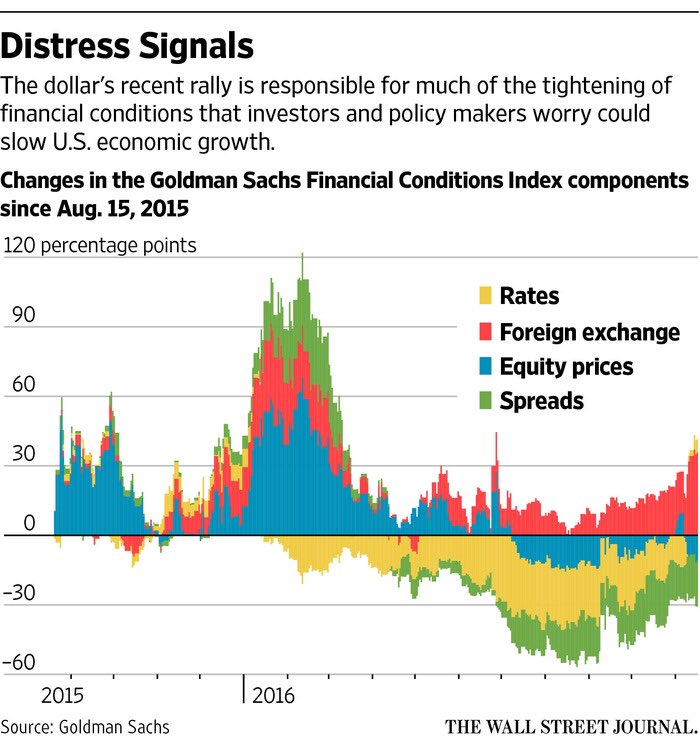
A day later, Raoul Pal told Yahoo Finance that History shows there’s a 100% chance of a recession for Trump. Even media got involved in arguing fabout the bad effects of the Dollar rally.
- Jesse Felder @jessefelder – Strong dollar could be rally’s weak link http://www.wsj.com/articles/strong-dollar-could-be-rallys-weak-link-1479474002 … ht @BenEisen
Raoul Pal argues for a correction in the US Dollar. Tom McClellan points out that commercial traders are betting on a near term fall in the Dollar. So did Carter Worth on CNBC Options Action on Friday.
These august gentlemen should first ask Fed heads to kindly shut up if they want a correction in the Dollar & a corresponding relief from the daily shoot up in Treasury yields. Because the action on Thursday & Friday was the direct result of Chair Yellen’s comments on Thursday and NY Fed Dudley’s comments on Friday. Nothing does as much unnecessary damage as talk from these Fed heads.
3. Treasury Yields
- Charlie Bilello, CMT
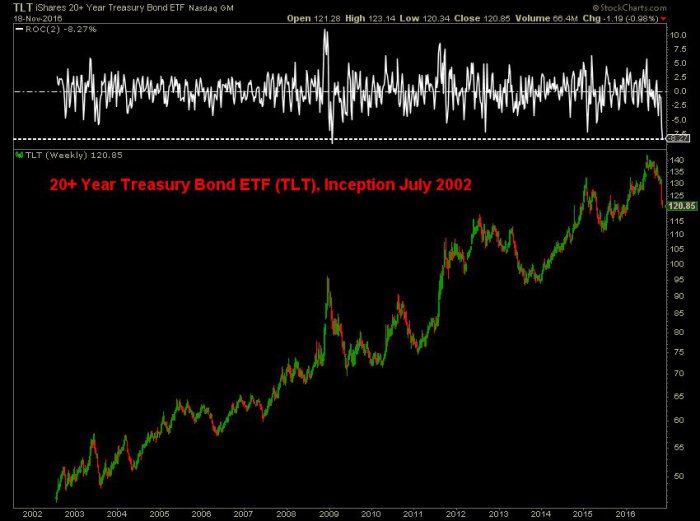
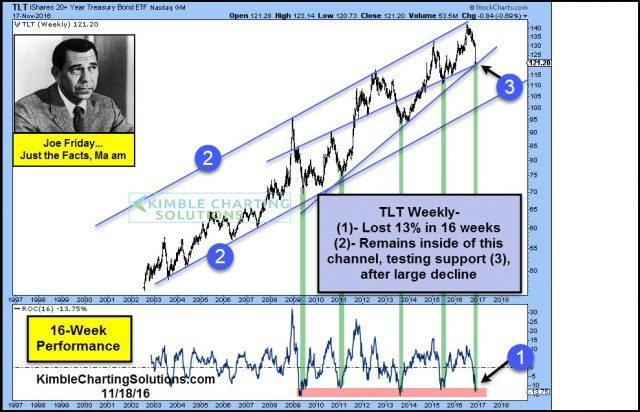
@MktOutperform – Long Bond ETF down over 8% in the past 2 weeks, the largest 2-week decline in history outside of Jan ’09.$TLT
This looks horrible but the decline was made worse by a 2% fall from Thursday to Friday. Look at Wednesday’s close & you will see that TLT was higher than last week’s close & the 30-5 year Treasury curve had lower yields than last Friday’s close. Then came Yellen on Thursday & Dudley on Friday. And yields shot up & TLT fell through a trap door as it were – TLT fell 1.8% in these two days; the 30-year yield rose by 10 bps, 10-year yld by 12 bps & the 5-year yield by 11 bps.
This rise made the Treasury curve go under-water for 2016 and nearly reached the critical levels of Gundlach – 2.339% vs Gundlach’s 2.35% on 10-year; 1.782% vs Gundlach’s 1.80% on 5-year and 1.03% vs. 1.1% on Gundlach’s 2-year. Remember what Gundlach said last week – when the 10-year broke thru 2.35%, it shot up straight to 2.75%.
- “Joe Friday Just The Facts; If support breaks at (3), TLT could fall another 15%, before it hits rising support channel (2)“.
But we may have three more weeks to go by one historical precedent:
- Robert Kelley @robertknyc @robertknyc – Nov 14 – The DSI on bonds hit 4 Friday [Nov 11]. Of the three other times since 2003 it got that low, a bottom formed on average of 29 days later
- “I’m the guy pushing a trillion-dollar infrastructure plan. With negative interest rates throughout the world, it’s the greatest opportunity to rebuild everything. Ship yards, iron works, get them all jacked up. We’re just going to throw it up against the wall and see if it sticks. It will be as exciting as the 1930s, greater than the Reagan revolution — conservatives, plus populists, in an economic nationalist movement”
4. China & Copper
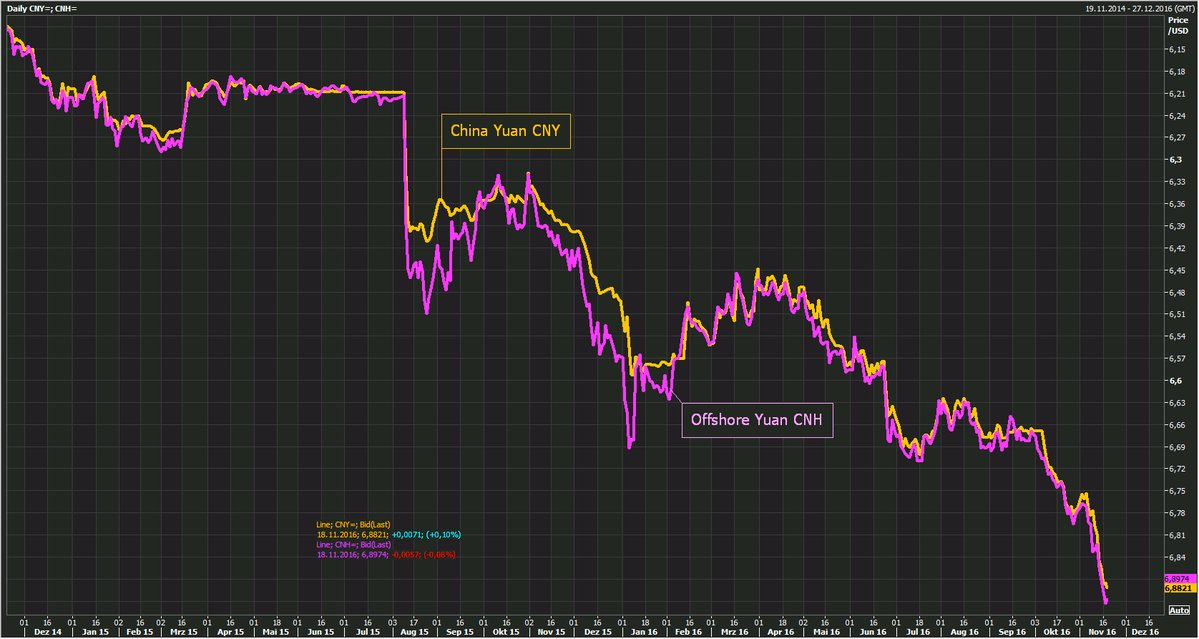
The Chinese Yuan has been declining as steadily as the Dollar has been rising. Then on Friday:
- Holger Zschaepitz @Schuldensuehner – Oops: #China ready to control Yuan’s slide. Offshore Yuan (CNH) stabilizes. http://www.reuters.com/article
/us-china-economy-yuan-exclusi ve-idUSKBN13D13L …
- Ryan Detrick, CMT
@RyanDetrick – Nov 11 – Huge reversal in#copper today. Closed down 1.6%, more than 8% off the intra-day highs. That ends the record 14 day win streak.#GolfClap
This Thursday, Tom McClellan wrote in his article Copper Spike:
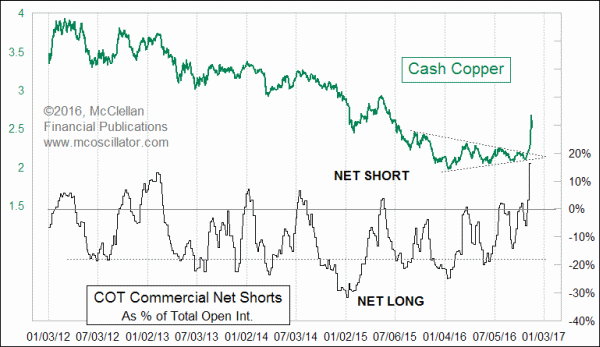
- “We can also see in this week’s chart that the big money “commercial” traders of copper futures have responded to this price spike by upping their shorts in a big way”.
- “Over the years, the commercial traders have been net long much more than they have been net short, and so just seeing them get up to around a neutral stance has been a pretty good sign of a top for copper prices. So this latest reading being way up above neutral is a big statement. Indeed, this is the commercials’ biggest net short position as a group since all the way back at the big 2011 price top.”
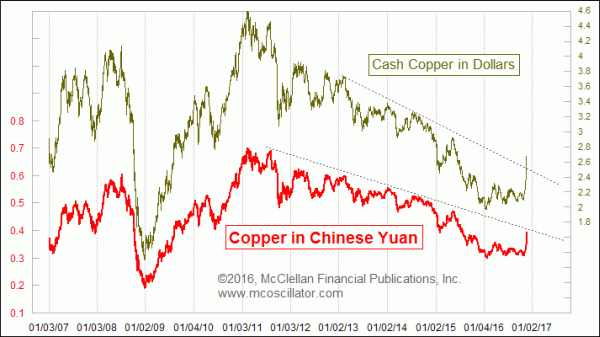
- “The dollar price plot has broken its long downtrend line. But the equivalent line in the plot of copper priced in yuan has not been broken. I view that as a big non-confirmation, and expect to see most or all of this spike get given back.”
This might be the best signal, when & if triggered, of a respite in the relentless reflation trade that is driving currencies, yields & stocks.
5. Stocks
Clearly all systems are go for the US stock market including fundamental expectations, technicals and superb seasonals. And once again Tom DeMark has been early or wrong in calling for a peak for this past Wednesday at 2215. But his supporters have not given up:
- Griffin McGee @griffinmcgee – Nov 17 – Today the SPX and RUT will record daily DeMark Sell Setups.
The MVP of the indices are the small caps. But is that good? Not necessarily argued:
- Charlie Bilello, CMT
@MktOutperform Just How Bullish is Small Cap Strength? NEW POST.$RUThttps://pensionpartners.com/just-how-bullish-is-small-cap-strength/ …
Bilello’s answer:
- In the forward 1-month through 12-month periods, both the Russell 2000 and the S&P 500 underperform in nearly all time periods.
What about complacency?
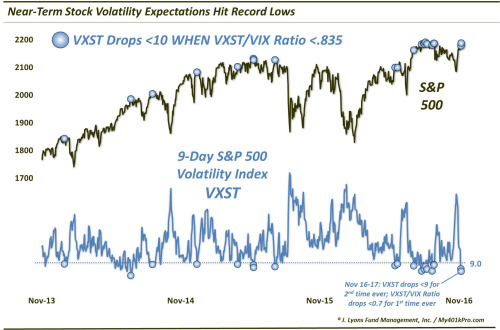
- Dana Lyons @JLyonsFundMgmt – ICYMI>ChOTD-11/17/16 Traders Getting A Little Too Comfortable In Stocks? $VXST $SPY Post: http://jlfmi.tumblr.com/post/1
53342063875/traders-getting-a- little-too-comfortable-in …
But are these really actionable near term? Especiaally during Thanksgiving week and then during Month end?
6. Gold
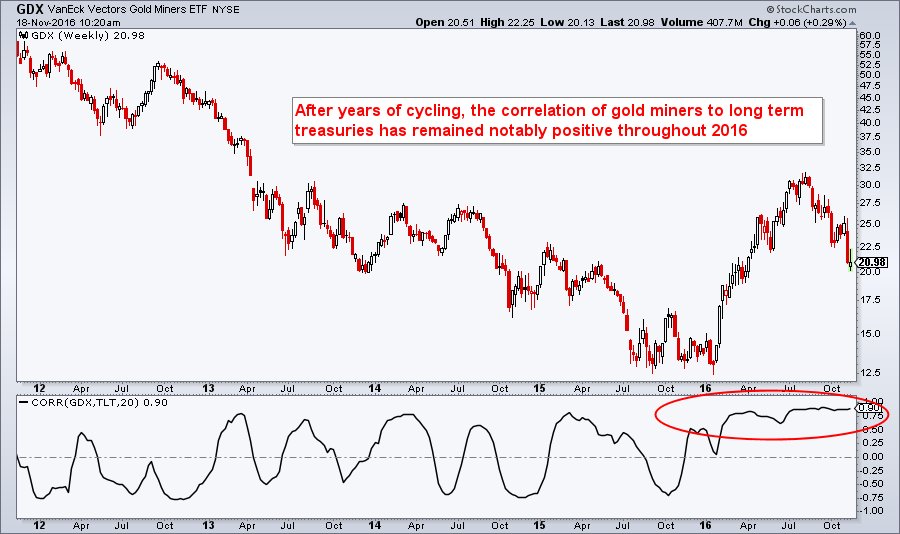
Amazingly, Gold Miners were up this week with ABX & NEM up 3% while Gold fell 1.4% & Silver fell 4.3%.
- See It Market @seeitmarket – $GDX looking a lot like $TLT. Interestingly, GDX + $TLT have been notably correlated through 2016
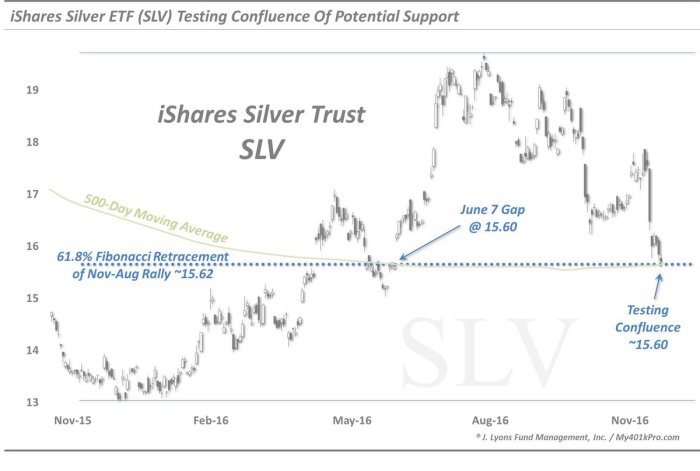
And Silver seems precariously positioned:
- Dana Lyons @JLyonsFundMgmt – ChOTD-11/18/16 iShares Silver ETF $SLV Testing Confluence Of Potential Support ~15.60 $AGQ$SI_F
7. Oil
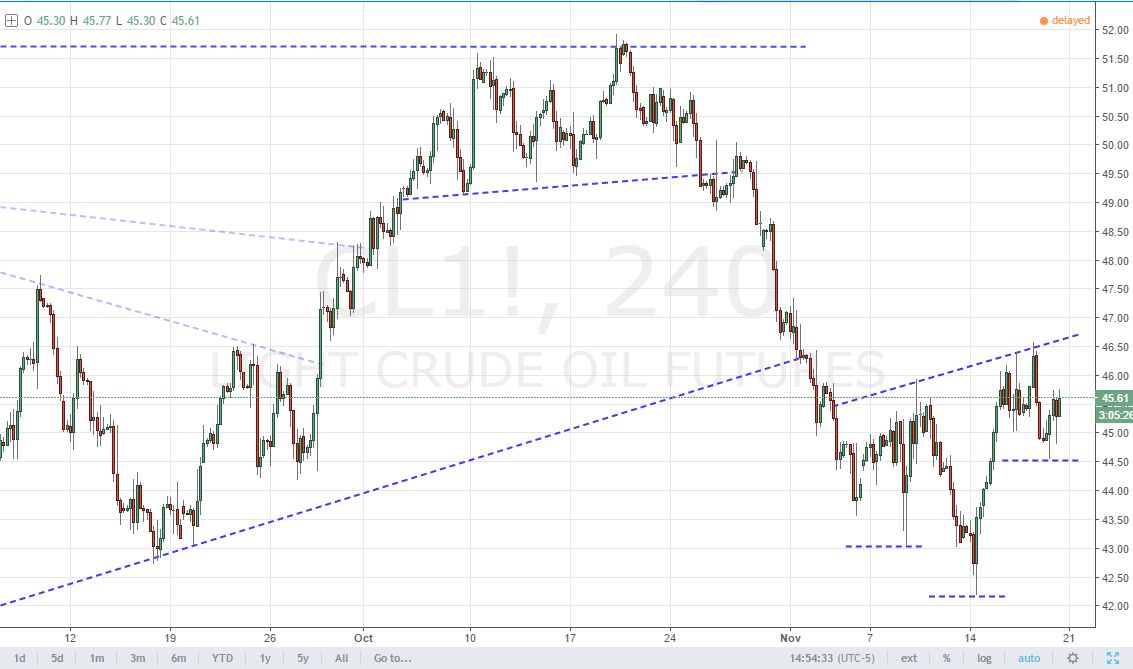
Another OPEC meeting is upon us. Will they finally learn of the French Musketeers – All for One & One for All? One chart pattern argues yes:
- John Kicklighter @JohnKicklighter – OPEC should hire technical (chart) analysts togauge proper time to jawbone. Like now, we have inverse H&S on oil
And Gundlach said in his webcast – Crude oil could find its way to $60/barrel and it will be hard for it to drop below $40.
