Summary – A top-down review of interesting calls and comments made last week in Treasuries, monetary policy, economics, stocks, bonds & commodities. TAC is our acronym for Tweets, Articles, & Clips – our basic inputs for this article.
Editor’s Note: In this series of articles, we include important or interesting Tweets, Articles, Video Clips with our comments. This is an article that expresses our personal opinions about comments made on Television, Tweeter, and in Print. It is NOT intended to provide any investment advice of any type whatsoever. No one should base any investing decisions or conclusions based on anything written in or inferred from this article. Macro Viewpoints & its affiliates expressly disclaim all liability in respect to actions taken based on any or all of the information in this article. Investing is a serious matter and all investment decisions should only be taken after a detailed discussion with your investment advisor and should be subject to your objectives, suitability requirements and risk tolerance.
1.”December was insane in this country“
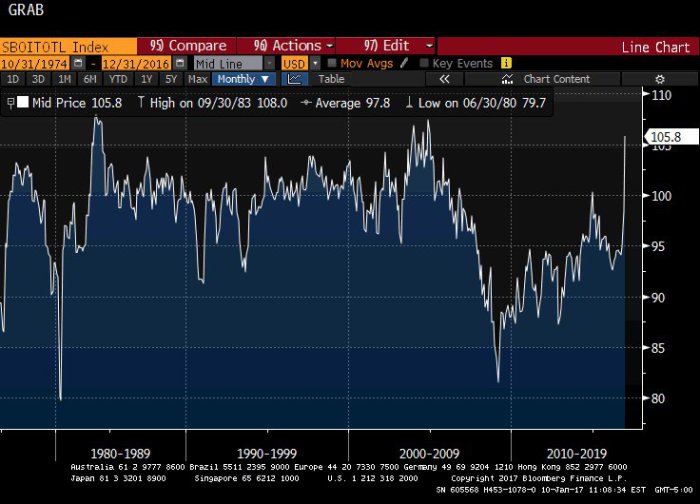
That was Cramer’s description of the confidence he saw from conference calls of small cap stocks. Jeffrey Gundlach used “explosive” to describe the monthly jump in small business confidence. What about a picture?
- John Authers
@johnauthers Trump certainly know how to make SMEs feel good about themselves. NFIB optimism index jumps, and comes close to all-time record from 1983:
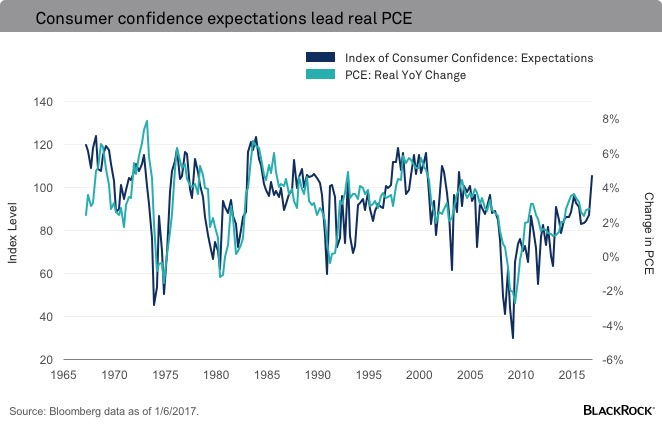
BlackRock’s Rick Rieder gave two reasons in his article to explain why the economy should grow in 2017. The first – “the Conference Board’s index of consumer confidence expectations index is a very strong leading indicator of real year-over-year Personal Consumption Expenditures (PCE), as the chart below shows“
Secondly, he states that “The U.S. industrial recession is ending” and “this manufacturing recovery, alongside consistently solid service sector growth, will be a key driver of stronger U.S., and global, growth in the year ahead“.
Jeffrey Gundlach said in his monthly conference call on Tuesday, January 10, that Trump will lead to a breakout of the 2% ceiling of growth that the US economy has had. All this should point to a reflation cycle ahead. That is how large speculators are positioned.
- Raoul Pal
@RaoulGMI – Copper speculative positioning is also at all time highs… 4 standard deviations to be exact.
According to Jeff Gundlach, we saw a double bottom in commodities at the end of 2015. Jodie Gunzberg, global head of commodities of S&P Dow Jones Indices sees a restart of a commodities supercycle:
- First, industrial metals have recently outperformed precious metals by the widest margin in 26 years, according to S&P Dow Jones Indices.
- Second, industrial and energy stocks combined have had their best performance since 1999, S&P Dow Jones Indices reports. “These are the two most economically sensitive sectors. The last time that we saw this high of performance here, we saw an eight-year bull run that returned 360 percent,” she said.
We may be wrong but all this sounds like using post-election market performance to reach fundamental conclusions, sort of like using stock market based indicators to forecast growth & inflation. That works most of the time but fails at interesting inflection points. Is this such an inflection point for energy?
- Dana Lyons
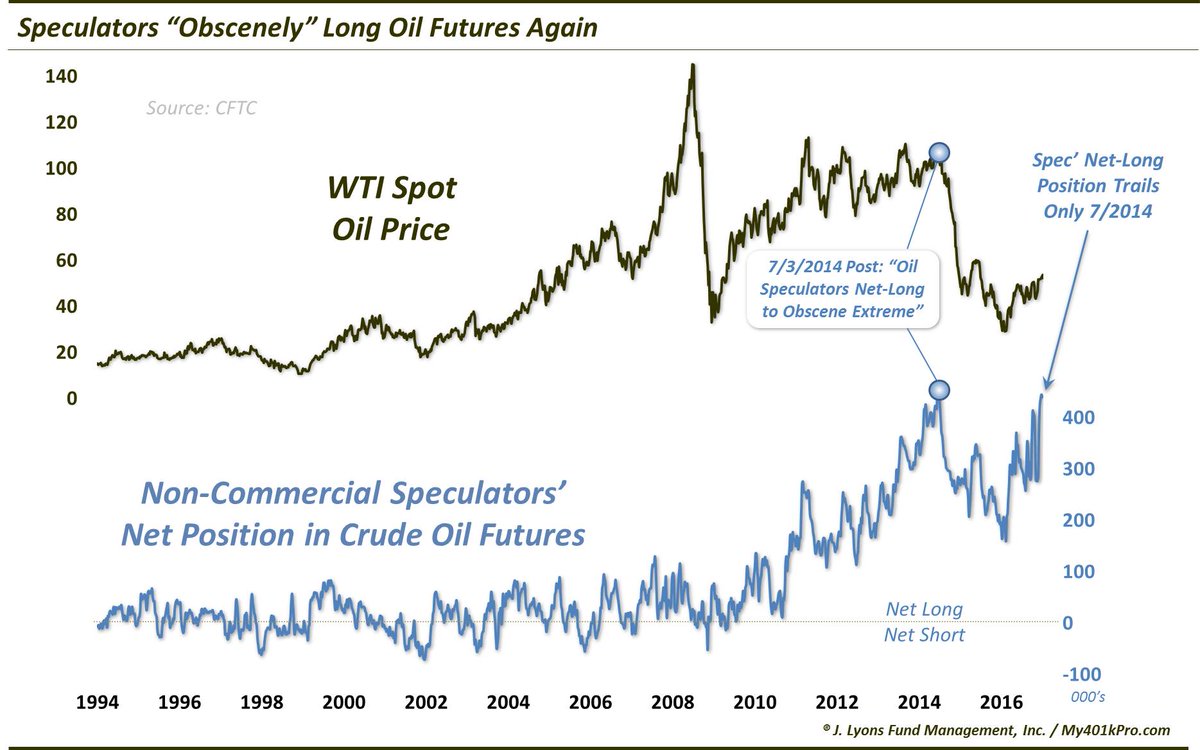
@JLyonsFundMgmt ICYMI>ChOTD-1/11/17 Are Oil Speculators About To Get Lit Up Again?$USO$CL_F Post: http://jlfmi.tumblr.com/post/155748937875/are-oil-speculators-about-to-get-lit-up-again …
Lyons writes:
- “We can’t predict for sure when the next shoe will drop in the oil market. These Speculators may continue to be correct in their bullish posture for awhile. However, given their obscene position, you can bet that eventually they’re going to get lit up again“
What might happen to rates if Oil speculators get lit up again?
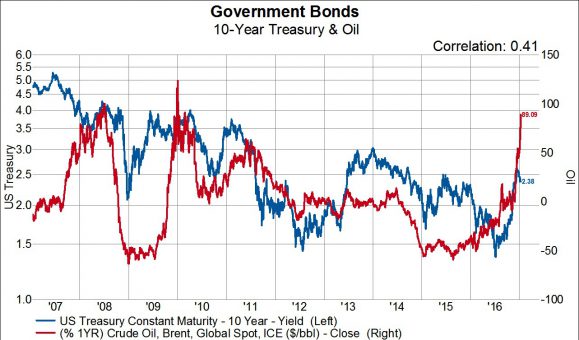
- Gavekal Capital @GaveKalCapital – Jan 12 – #Gavekal Capital: Oil Prices Are Up 90% YoY…What That Might Mean For Bonds http://blog.gavekalcapital.com
/?p=12566
The answer according to Gavekal:
- It is somewhat hard to believe but oil prices are up nearly 90% over the past year. The past two times oil prices have increased this much year-over-year, US 10-year bonds rallied quite significantly. In 2008, oil was up over 100% in July and bond yields were hovering just over 4%. Ultimately, yields fell to 2.10% as the year-over-year change in oil dropped to -63% by the end of that year. In 2010, oil prices had climbed over 120% year-over-year and bond yields were around 3.60%. By August 2010, the year-over-year change in oil had fallen to about 0% and yields had dropped to 2.4%.
David Rosenberg remains a skeptic about reflation & the economic cycle:
- “We are not on the precipice of recession just yet, but the odds are rising as the economy clearly is in a late-cycle phase“
While many dispute the clarity of Rosenberg’s vision, the Treasury market seems to be siding with his view at least since the Fed rate hike on December 14, 2016. Nothing forecasts the direction of the economy like the Treasury market, at least in the short term. Of course, that too may be artificial based on speculator positions.
2. Treasuries & Bonds
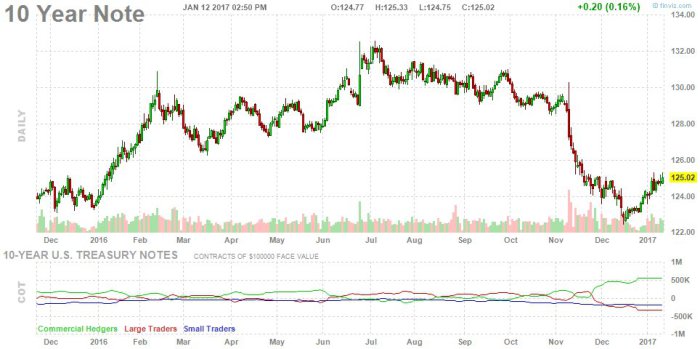
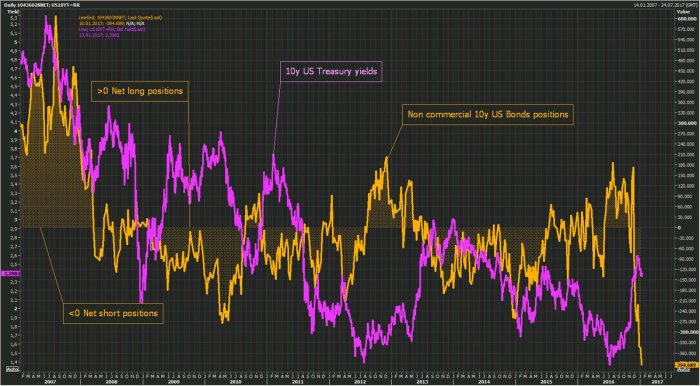
The two charts below may be the real story of the yield curve:
- Mark Arbeter, CMT
@MarkArbeter Commercials “smart money” extremely bullish 10 year$TNX,$TLT. May suggest no bear for bonds as many see. Does not support improv. economy.
On the other hand,
- Holger Zschaepitz
@Schuldensuehner – Speculators again increased their shorts in 10Y US govt futures to fresh record, betting that bond bubble has popped.
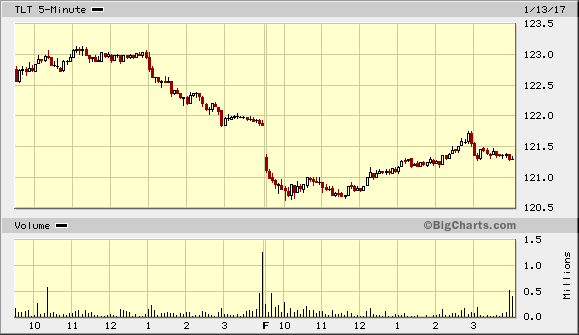
The massive short position may have been a reason for the bounce back on late Friday morning. A mediocre 30-year auction led to a swift decline in Treasury prices on Thursday afternoon & a larger decline on Friday morning. But that decline began stabilizing & Treasury prices began rallying in the afternoon.
Was that because of the massive short position is precluding a big selloff or because of the 3-day weekend? We will find out next week.
Despite the decline on Thursday & Friday, TLT again outperformed S&P & other US stock indices this week with the 30-5 year curve down about 2-3 bps in yield. Gundlach expects yields to come down some more with the 10-year yield breaking below 2.25% but not below 2%. But Gundlach does expect the 10-year yield to rise to 3% some time in 2017 and considers break of the 3% as the “bye bye bull market” signal.
Regarding credit, Gundlach says flatly that “junk bond market will not outperform S&P in 2017” but thinks EM stocks & bonds will outperform the S&P in 2017.
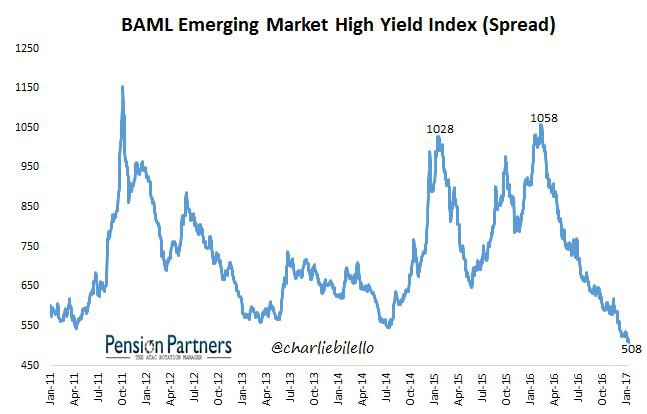
- Charlie Bilello
@charliebilello – Emerging Market High Yield spreads continue to tighten, at a 9-year low today: 508 bps.$EMHY
Gundlach also said that the US Treasuries -Bunds spread is getting extreme and he thinks German Bunds are getting vulnerable.
3. Stocks
Once again, US stock indices went nowhere this week.
- Igor Des
@Copernicus2013 – Market is exactly unchanged since December 13th, with barely a 1% range since then.. no wonder there is no bid to vol..$VIX
And,
- Tim Ord
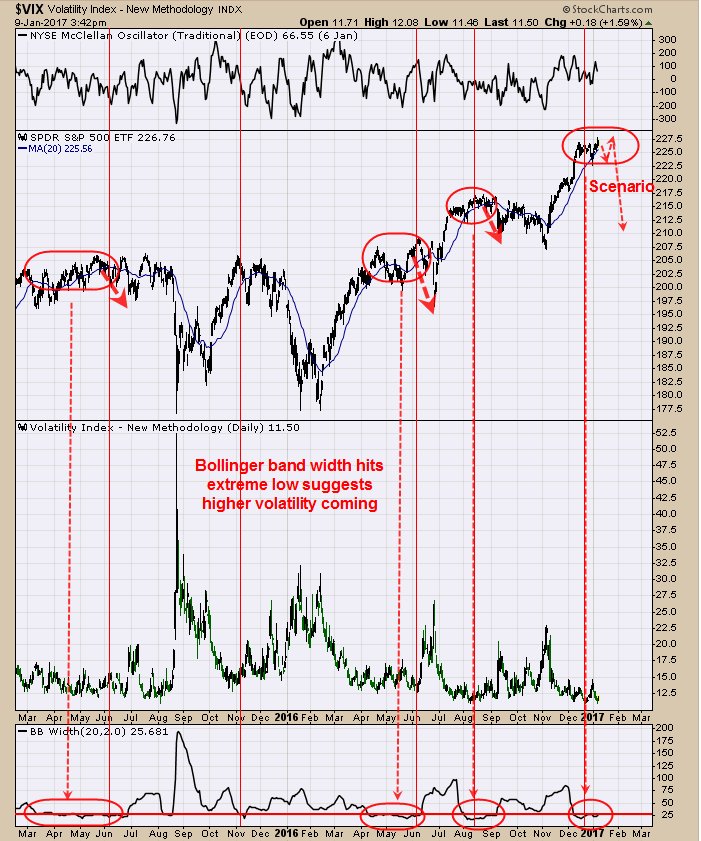
@OrdOracle Bollinger Band width and stayed low for an extended time. Have lead to pull backs in the past.$SPY$spx$QQQ
On Tuesday, Jim Cramer pointed to the work of his RealMoney colleague Carolyn Boroden to warn about a possible pullback. He pointed out that Boroden has
- “spotted eight different Fibonacci time cycles in the Dow, with seven of them coming due next week, and one coming due this week. Not surprisingly, they coincide with Donald Trump‘s inauguration. This kind of a setup usually leads to a market reversal, approximately 65 to 70 percent of the time, Boroden said. Nevertheless, the time cycles can cause a move to accelerate. Meaning, the Dow could pick up speed rather than reverse. But Boroden says the probability suggests the rally will take a breather.”
Two days later, Ms. Boroden updated her work:
- Carolyn Boroden
@Fibonacciqueen –$SPX work updated http://www.fibonacciqueen.com/public/Updating-My-SPX-Analysis.cfm …
[embedyt] http://www.youtube.com/watch?v=k8bXWiZtOI0[/embedyt]
She says she is looking for a potentially important high to unfold in the next few weeks but she is not going to say it is in place yet. In fact, the next upside level in her work is 2284-2285.
Jeffrey Gundlach said that he sees a double top in S&P vs. MSCI EM & expects S&P to underperform EM stocks & Japan. He specifically cited India as a long term secular bullish position & said this is an excellent time to peel off a little from the S&P and buy some India. After all, Indian market has gone sideways since 2015.
Gundlach also sees a double top in S&P vs. Europe and the chart looks good. But he expects problem in Europe later in the year. So he doesn’t recommend it.
Along these lines:
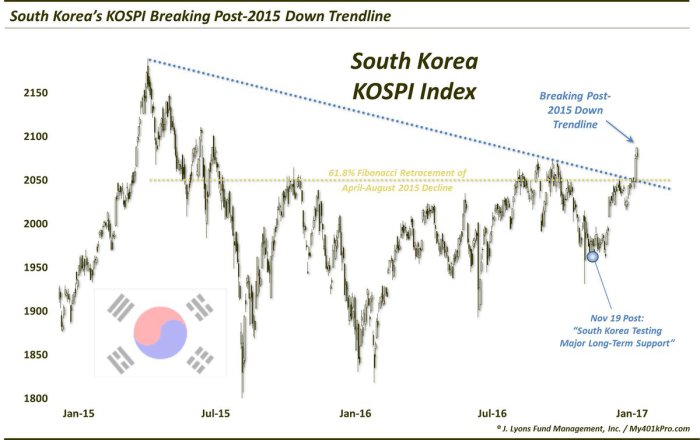
- Dana Lyons
@JLyonsFundMgmt – ICYMI>ChOTD-1/13/17 Korean Stocks Are Breaking Out$EWY Post: http://jlfmi.tumblr.com/post/155820086845/korean-stocks-are-breaking-out …
And,
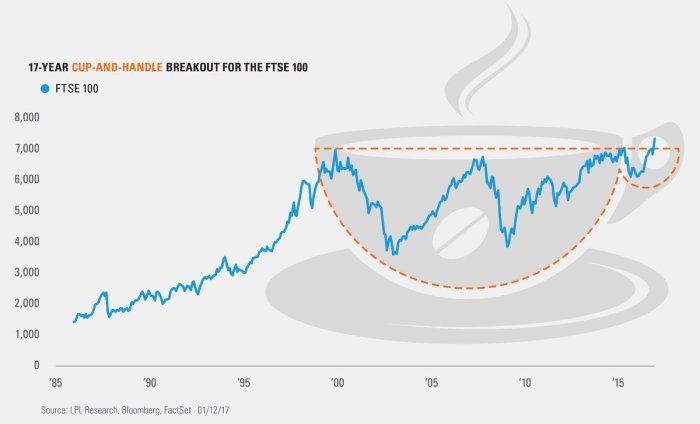
- Ryan Detrick, CMT
@RyanDetrick – Here’s your#ChartOfTheDay. The FTSE 100 breakout in the shape of a coffee cup. 17-yr picture perfect breakout. https://lplresearch.com/2017/01/13/the-breakout-no-one-is-talking-about/ …
Send your feedback to editor@macroviewpoints.com Or @MacroViewpoints on Twitter
