Summary – A top-down review of interesting calls and comments made last week in Treasuries, monetary policy, economics, stocks, bonds & commodities. TAC is our acronym for Tweets, Articles, & Clips – our basic inputs for this article.
Editor’s Note: In this series of articles, we include important or interesting Tweets, Articles, Video Clips with our comments. This is an article that expresses our personal opinions about comments made on Television, Tweeter, and in Print. It is NOT intended to provide any investment advice of any type whatsoever. No one should base any investing decisions or conclusions based on anything written in or inferred from this article. Macro Viewpoints & its affiliates expressly disclaim all liability in respect to actions taken based on any or all of the information in this article. Investing is a serious matter and all investment decisions should only be taken after a detailed discussion with your investment advisor and should be subject to your objectives, suitability requirements and risk tolerance.
1. New All-time Highs – Three Triggers
Was this a great week for Risk Parity Funds? VIX fell 63% from its close of 15.59 on Wednesday May 17, the peak of fears of problems for President Trump; US Stock Indices rallied hard to new highs for S&P 500; Treasury yields behaved as if stocks were down, Gold & Silver rallied and Dollar also closed in the green on the week. Is this what Risk Parity heaven feels like?
There were two major events that sparked these moves – the fall in feverish fears about the fate of President Trump and the Fed minutes released on Wednesday at 2:00 pm. The Magazine cover indicator we had highlighted in last week’s American Civil Wars & Insurrections article worked very well. But which event contributed to what?
The stock indices had already rallied by Wednesday 1:50 pm, ten minutes prior to the Fed minutes. All three major indices had already achieved 50%-75% of their rally for the entire week by then. VIX had already fallen 56% from last week’s close to Wednesday 1:50 pm, the bulk of its weekly fall. In contrast, Treasury yields had risen from last week’s close to 1:50 pm on Wednesday and Gold, Silver had fallen. This behavior makes sense, right? When stocks rally & VIX falls, Treasury yields should rise & Gold/Silver should decline.
Then came the release of the Fed minutes at 2:00 pm on Wednesday. The Fed confirmed their desire to raise rates AND the FED said they intend to begin balance-sheet contraction this year. The Fed-experts on Fin TV pronounced these minutes as hawkish. But it is now clear that the markets disagreed. Look at the reaction in different asset classes from Wednesday 2:00 pm to Friday’s close.
- Dow and S&P rallied by 50 & 60 bps; EEM rallied by 1%; VIX fell another 10% and Treasury yields fell across the curve with the belly of the curve falling the most – 30-yr down 2.7bps; 10-yr down 3.9 bps; 5-yr down 4.1 bps; 3-yr down 3.8 bps & 2-yr down 2.7 bps; TLT rallied by 55 bps; GLD & SLV rallied by 1% and 1.3% resp.
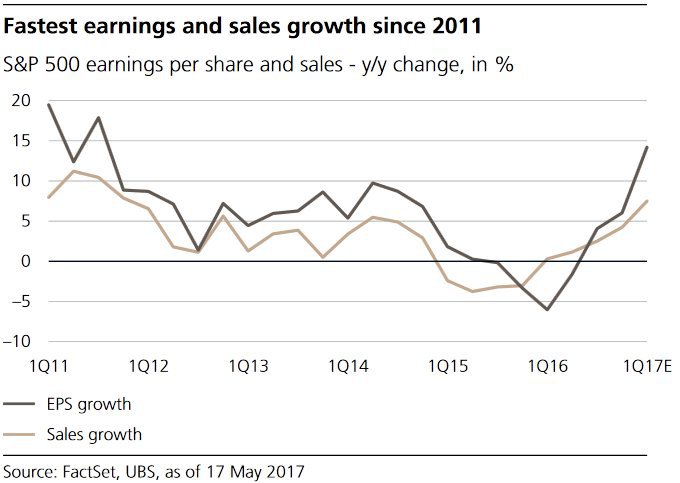
Isn’t this the textbook reaction to an easier Fed? The market is clearly signaling a classic low-inflationary condition in which inflation is dormant or falling with earnings rising.
- Babak @TN – and that includes the current time period as S&P 500 earnings and sales increase sharply YoY
$SPX$SPY via UBS
But is this condition an indication of a slowdown ahead or worse?
2. Economy – Late Cycle or “R”?
David Rosenberg wrote about jobless claims – “The Labor market is hitting the wall, something that screams of “late cycle“. He also wrote under a 1937/38 redux? heading – “There is a palpable sense of complacency out there and I don’t just mean nosebleed equity valuations, razor-thin corporate bond spreads and 10x reading in the CBOE’s VIX“.
Paul Singer of Elliott Management was more direct in his Q1 letter to his investors:
- “Given groupthink and the determination of policymakers to do ‘whatever it takes’ to prevent the next market ‘crash,’ we think that the low-volatility levitation magic act of stocks and bonds will exist until the disenchanting moment when it does not. And then all hell will break loose (don’t ask us what hell looks like…), a lamentable scenario that will nevertheless present opportunities that are likely to be both extraordinary and ephemeral. The only way to take advantage of those opportunities is to have ready access to capital.”
The Singer letter also mentioned the terrible R-word – “recession”. He was not the only one:
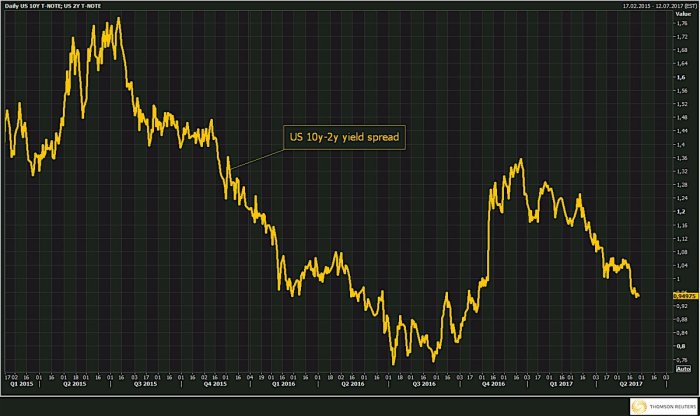
- Holger Zschaepitz @Schuldensuehner TROUBLE! US 10/2y yield spread drops further below closely-watched 100bp level. Now at 95bps. Signals higher probability for US recession.
We hear that Mark Yusko had explicitly warned investors with a recession ahead call at the Mauldin Conference. This seems to be the classic behavior of the Fed which usually begins its tightening late and ends up causing a recession. But why would a 25 bps increase create such risk?
- Lawrence McDonald @Convertbond – Why does a 25bps rate hike act like 75bps? “Smallest 50% of companies paying 30% of profits on interest, most since 2002” SG
#Debt#FOMC
How unreal is the Debt growth?
- Jeffrey GundlachVerified account @TruthGundlach Sure, the volatilities are different, but real GDP for the past decade is identical to that of the 1930’s: 1.33% annualized. Think about it!
- Jeffrey GundlachVerified account @TruthGundlach – Of course, this time US added around $10 Trillion of additional debt to achieve the 1.33% rate of real GNP growth. Around 1/2 a year’s GDP!!
All this is fine but doesn’t credit provide an early indicator of economic danger?
3. US High Yield
Current conditions look great:
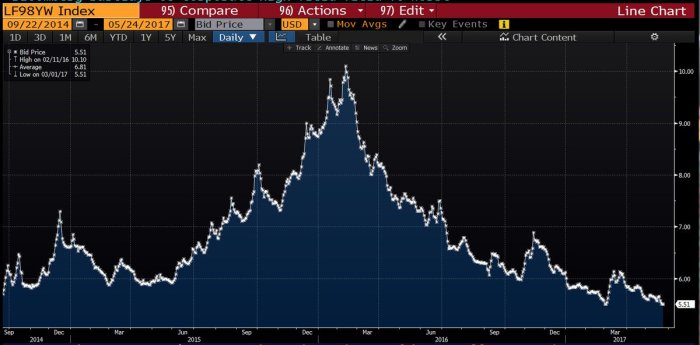
- Lisa AbramowiczVerified account @lisaabramowicz1 – May 25 – U.S. junk-bond yields have fallen down to the lowest levels in more than two years.
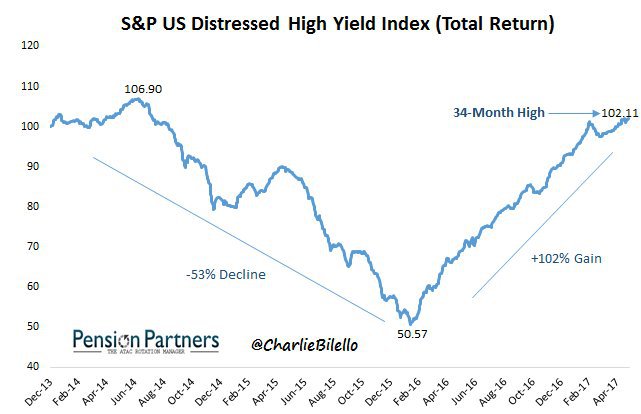
And even crap looks like gold:
- Charlie BilelloVerified account @charliebilello – Distressed Bonds hit a 34-month high. Have now recovered 95% of the losses from 2014-2016, doubled since Feb ’16.
The real question is whether High Yield is confirming the strength in Stocks?
4. US High Yield & Stocks
Here opinion seems divided:
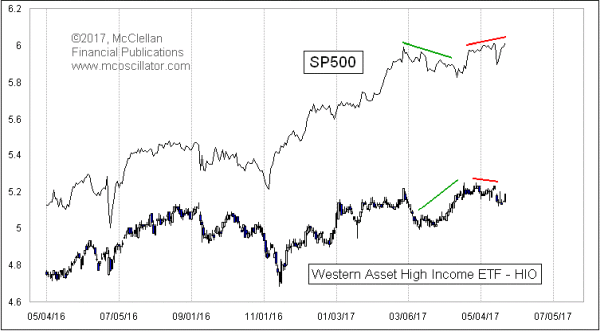
Tom McClellan wrote on Thursday in his article Junk Bonds Don’t Confirm Higher Highs:
- Sometimes the divergences are bullish, as we saw when HIO made a pattern of higher highs in March and April 2017 while the SP500 was making lower highs. That foretold the stock market strength which eventually materialized.
- Right now, this divergence between HIO and the SP500 fits well with my expectation for a 2-3 week dip into a low due in June 2017, which should be followed by a strong new uptrend. Such a selloff could serve the useful purpose of scaring out the weak hands.
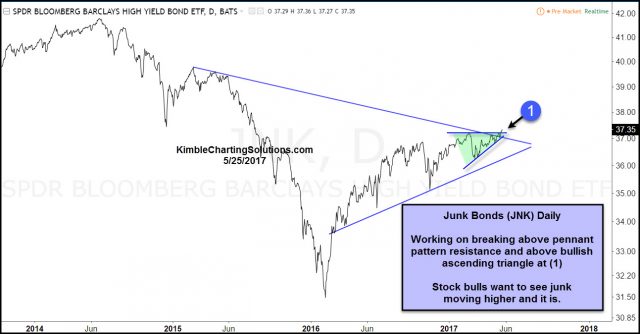
On the other hand, Chris Kimble posted on Thursday – Junk Bonds; Dual upside breakout taking place!
- JNK started heading lower back in 2014, diverging against stocks, sending a concerning message to them. JNK hit a low in February of last year and has been heading higher ever since, sending a positive message to stocks.
- JNK for the past few months has chopped sideways, just below 2-year falling resistance, which looks to be the top of a narrowing pennant pattern. At the same time it was dealing with pennant pattern resistance, it looks to have formed a bullish ascending triangle (flat top and rising bottoms).
- At this time JNK is working on a dual breakout of the pennant and ascending triangle at (1). Even thought Junk Bonds yields are low at this time and a concern to some, historically this type of price action is NOT a concerning message for stocks!
- To send a concerning message to stocks, Junk needs to break back below dual support and diverge against stocks, which at this time, is not happening.
5. US Stocks
Tom McClellan suggested a 2-3 week dip into June 2017 followed by a strong uptrend. He is not alone in this:
- SentimenTraderVerified account @sentimentrader – In 52 years, there were 5 other days when
$SPX 0.5% to a 52-week high, yet up volume % was this low. 2 weeks later, it was
  all 5.
And,
- Peter Ghostine @PeterGhostine –
$SPY a move north of 241.84 would imply 242.71, from where a 20-25 point drop should occur. But the ensuing rally would be 60+ points.
Another sign of a correction to come:
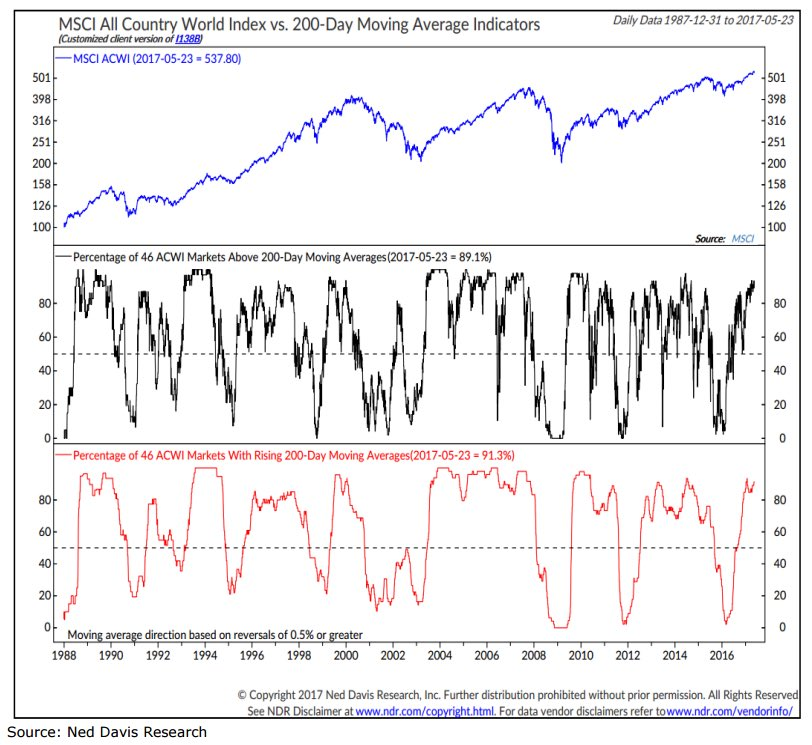
- Tiho Brkan @TihoBrkan 58 minutes ago – Almost 90% of global indices are above their 200 day MA. Can stay overbought, but a correction eventually occurs.
But Sentiment is not yet extreme:
- Babak @TN – with new all time highs, Daily
#Sentiment Index for both$SPX &$NDX 81% just barely in extreme bullish area, went above 90% early in the yr
What do statistics say about the rest of the year?
- Ryan Detrick, CMT @RyanDetrick – When
#SPX up >7.5% as of day 100 for the yr (like ’17)? Since ’50, 23 other times and higher rest of yr 20 times. Avg gain rest of yr? 9.0%.
6. Gold
May be it was the market’s reaction to the Fed minutes or may be it was something else, but there was a marked increase in admirers of Gold on Friday:
- Chris Kimble @KimbleCharting – Gold Miners; Breakout about to happen, says Joe Friday https://www.kimblechartingsolu
tions.com/2017/05/gold-miners- breakout-happen-says-joe-frida y/ …
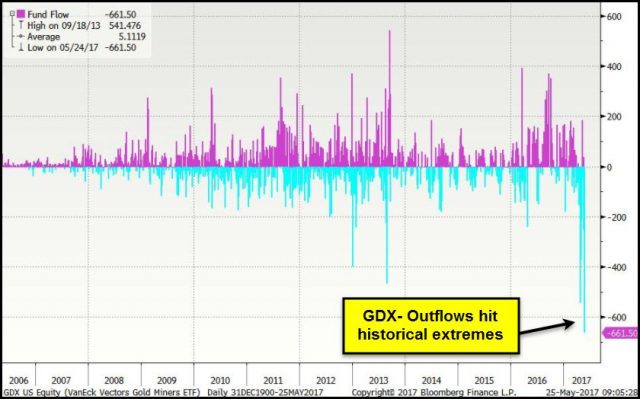
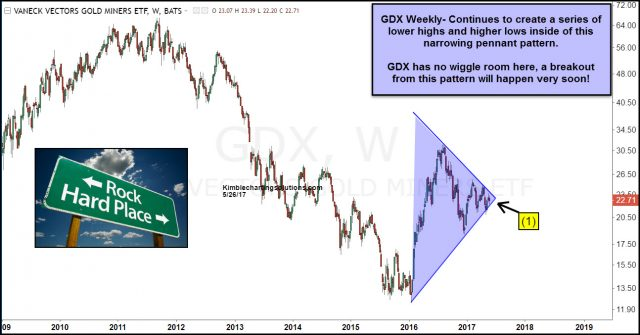
- When it comes to investors being bullish Gold miners ETF GDX, they are hard to find, as outflows are hitting levels never seen. Below looks at inflows/outflows from GDX over the past 11-years. As you can see, investors are bailing out of GDX like never before!
- Inflows and Outflows are one thing, price is another. Below looks at the price patterns of GDX over the past 8-years-
- Pennant patterns aren’t good about tipping one off to the future direction of an asset. They are good from this perspective; when a breakout from the pattern takes place, follow it, because big moves often follow.
- Joe Friday Just The Facts; GDX is going to breakout of this pattern and the odds are good a big move will follow. This will lead to an outstanding trade opportunity. Are you ready for it???
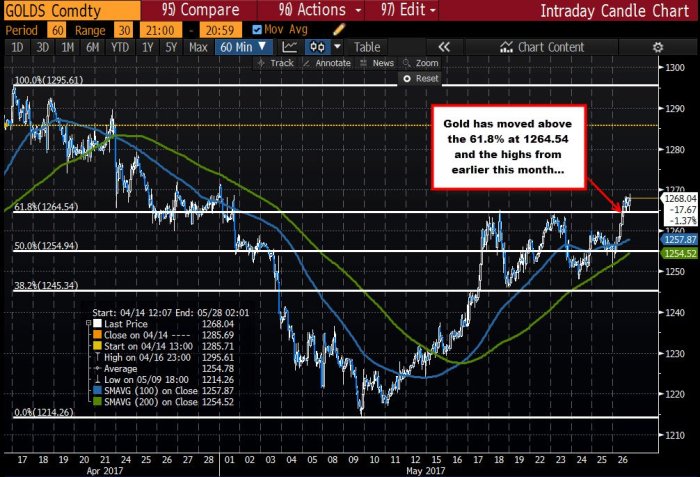
- ForexLive @ForexLive – Technical analysis: Gold ending the week with a solid gain. http://technical-analysis.forexlive.com/!/technical-analysis-gold-ending-the-week-with-a-solid-gain-20170526 …
#gold
Carter Worth, resident technician at CNBC Options Action said Buy GLD on Friday afternoon. He had put out a buy on Silver a couple of weeks ago. Now he is positive on Gold & Gold miners.
But not all are positive on Gold:
- J.C. Parets @allstarcharts – Is It Time To Buy Gold Again? No – http://allstarcharts.com/will-time-buy-gold/?utm_source=dlvr.it&utm_medium=twitter
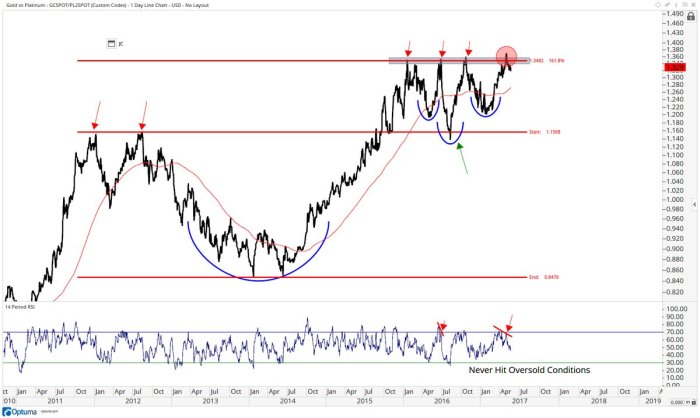
Another way Parets looks at Gold:
- J.C. Parets @allstarcharts – it’s really all about the Gold vs Platinum ratio if you ask me
$GC_F$PL_F$GLD
7. Oil
The following captures our feelings about trading Oil:
- M Lebon@LongTplexTrader –
#CL_F says have fun in Hell
Carter Worth, resident technician at CNBC Options Action has correctly advised viewers to stay away from Energy & Energy stocks. He repeated this on Friday with the succinct observation – S&P Energy made a 14-year relative low to S&P 500 this week – Stay Away!
8. Upsetting the carts above?
What can upset everything we featured above? Something that has been discarded:
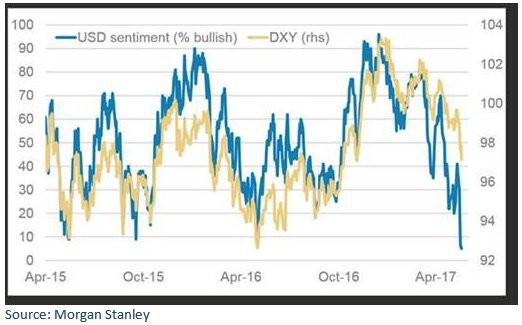
- Driehaus @DriehausCapital22 hours ago – Dollar sentiment near multi-yr lows, c/o MS. HS
That brings us to:
- Jeffrey GundlachVerified account @TruthGundlach 2017 began w/ Long $ big consensus trade. Now $ positioning shortest/sentiment most bearish since May 2011. $ rose 35%+ from 5/11 to 12/16.
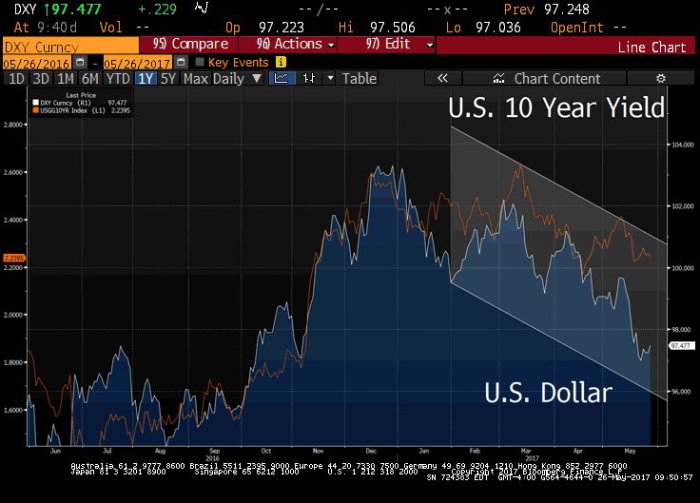
We get what a stronger Dollar would mean to Gold & Commodities. But what about rates?
- Lawrence McDonald @Convertbond – It’s an Economic Growth Story
In other words, a stronger Dollar could cause rates to go up, for Gold to decline & create a headwind for earnings of leading sectors of the S&P. No one wants that & that can be seen in the sentiments about the Dollar. Doesn’t that make you go hmmmm?
9. Wishes & Prayers to Manchester Victims
We were all reminded again this week about the horrors of what we now describe as terrorism. Below is a tribute from Dubai’s Burj Khalifa:
Send your feedback to editor@macroviewpoints.com Or @MacroViewpoints on Twitter
