Summary – A top-down review of interesting calls and comments made last week in Treasuries, monetary policy, economics, stocks, bonds & commodities. TAC is our acronym for Tweets, Articles, & Clips – our basic inputs for this article.
Editor’s Note: In this series of articles, we include important or interesting Tweets, Articles, Video Clips with our comments. This is an article that expresses our personal opinions about comments made on Television, Tweeter, and in Print. It is NOT intended to provide any investment advice of any type whatsoever. No one should base any investing decisions or conclusions based on anything written in or inferred from this article. Macro Viewpoints & its affiliates expressly disclaim all liability in respect to actions taken based on any or all of the information in this article. Investing is a serious matter and all investment decisions should only be taken after a detailed discussion with your investment advisor and should be subject to your objectives, suitability requirements and risk tolerance.
1.Front running after all
Last week we wondered whether the rally into the close on Friday, May 5 was a real move or simply front running an expected rally on Monday, May 8. Now we know that it was not merely front running but front running of a rally that never really materialized. Not only did the S&P 500 close down some 30 bps this past week but EWQ, the France ETF, closed the week down 1.7%. So much for celebrating the Macron victory.
Every one on TV keeps telling us about the strength of European economic recovery. They should try telling that to 10-yr & 30-yr German Bunds which closed the week down in yield. The US 5-year yield & 10-year yield closed the week down 3.4 bps & 2.2 bps resp.
What happened to the Fed reassurance on March 3 and the strong NFP on March 5? Why did the US 10-year yield turned lower from the 2.40% – 2.42% level reached on Wednesday & Friday? Is the Treasury market beginning to wonder if the skeptics like David Rosenberg are correct? Read what Rosie wrote on Friday:
- If my assertion is correct that core inflation peaked this cycle at 2.3%, it will have been the lowest high since the data began in 1958;
- The jobs market is very clearly cooling off here, as is typical in the latter innings of the expansion;
- Could we be in a recession (and not even know it)? – This is actually a very close call;
This is the environment in which “Fed hawks are coming out of the woodwork with increasing frequency … “, as he put it?
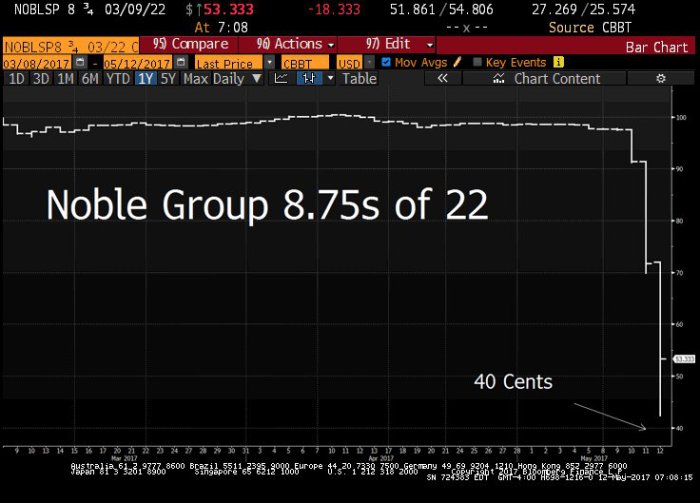
Is that why the 10-year & 5-year yields fell on Friday by 7.3 bps & 7.8 bps resp? Or was it a natural reaction to a credit event?
- Lawrence McDonald @Convertbond Breaking, Colossal Commodity Driven Credit Collapse – Kicked Off last night https://www.thebeartrapsreport.com/blog/2017/05/12/a-noble-effort/ …
2. EEM over SPY
The most interesting call of the week came from Jeffrey Gundlach who recommended a pair trade – Long EEM vs. Short SPY at the Sohn Conference on Monday.
The EEM-SPY trade began working right away with EEM up 2.4% & SPY down 33 bps on the week. However, as we understood him, Gundlach is arguing for a long term or at least an intermediate term outperformance of EM over S&P 500.
Seeking Alpha reported that “Assets under management in emerging market hedge funds rose another 5.6% in April, according to Hedge Fund Research, with India and China standing out“.
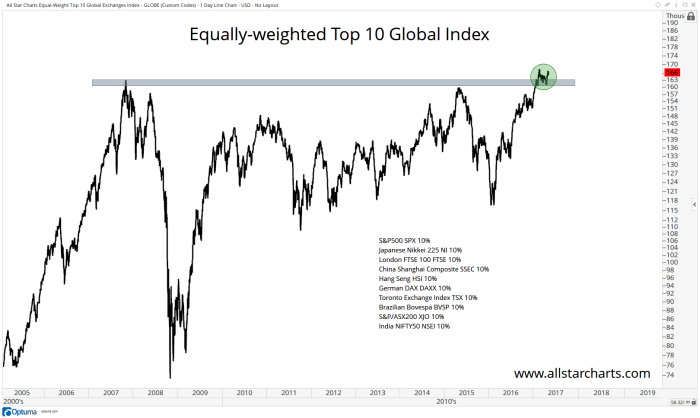
And equities are still in an uptrend, reminds J.C. Parets:
- J.C. Parets @allstarcharts ICYMI A Friendly Reminder: Stocks Are In An Uptrend http://allstarcharts.com/friendly-reminder-stocks-uptrend/ …
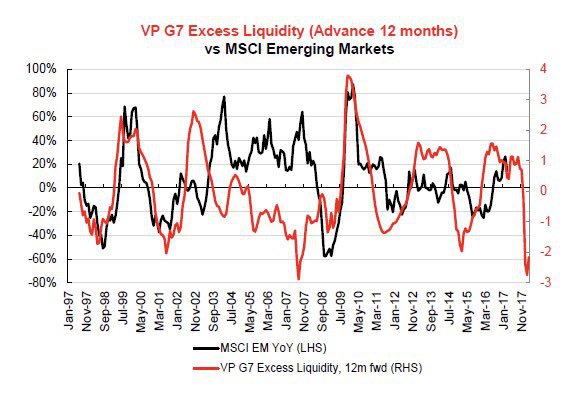
But some see a warning sign in EM sentiment:
- Jesse Felder @jessefelder Stretched sentiment leaves EM vulnerable https://blog.variantperception.com/2017/05/12/stretched-sentiment-leaves-em-vulnerable/ … by
@VrntPerception
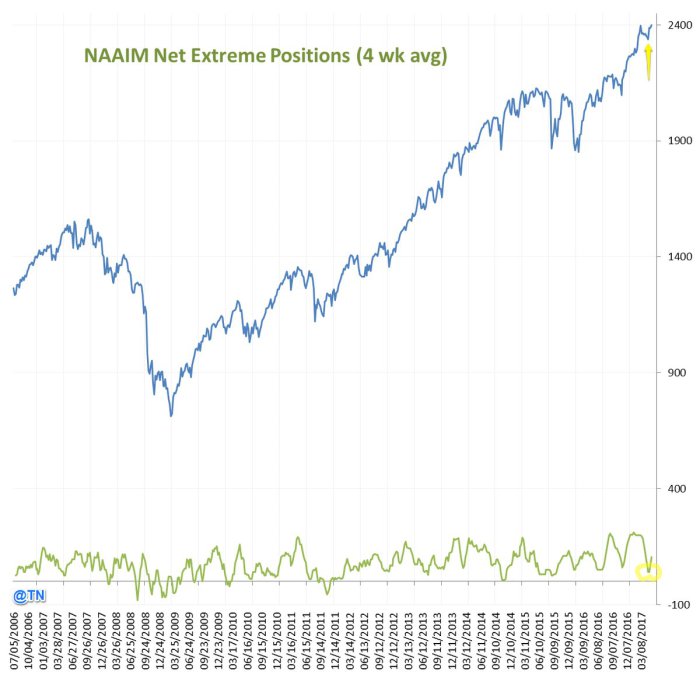
On the other hand, sentiment is pretty extended in the S&P as well;
- Babak @TN NAAIM exposure index 93% mean, 95% median (difference between most extreme positions gave successful signal mid April)
#sentiment$SPX
What about some large components of MSCI EM? China ETFs up with ASHR up 74 bps & FXI up 3.3%; India up about 1.5% and EWZ (Brazil) up 5.8% on the week.
3. China
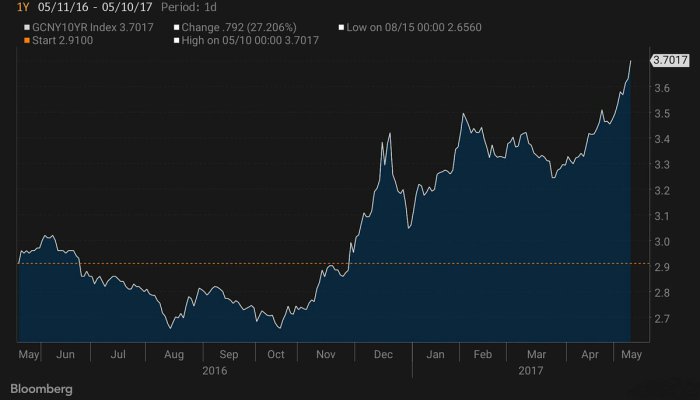
Chinese stock ETFs closed up this week but with a lower trajectory than the China 10-year yield.
- (((The Daily Shot))) @SoberLook Chart: China’s 10yr government bond yield
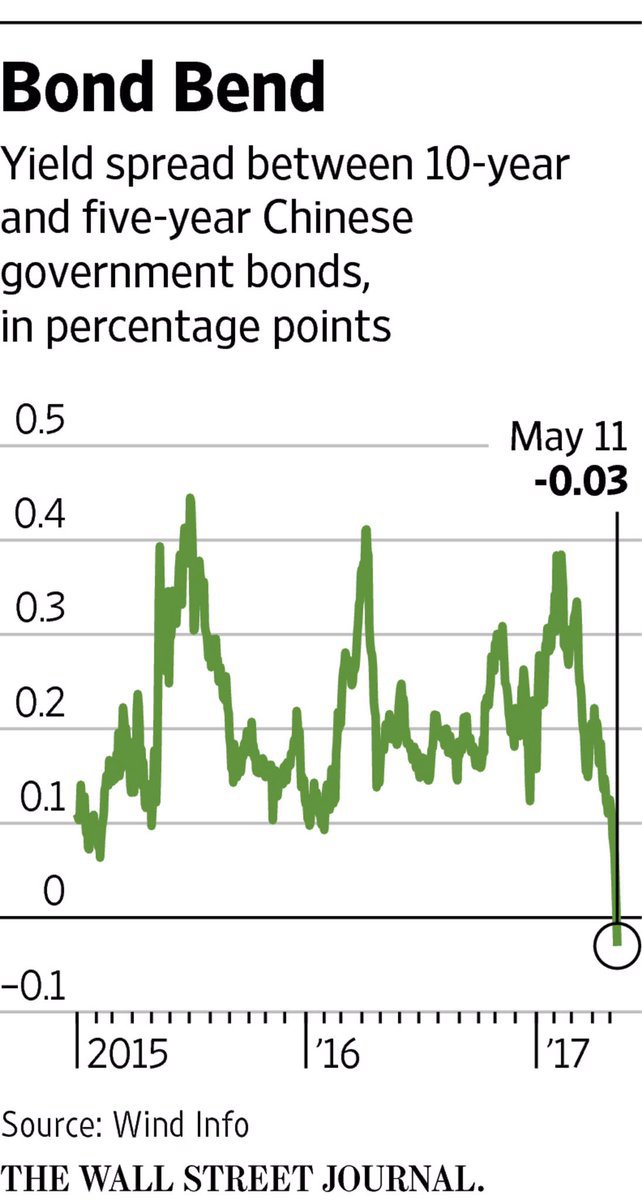
Despite this move in the 10-year yield, the Chinese yield curve inverted this week:
- Jesse Felder @jessefelder – The Yield Curve in China’s Jittery Bond Market Just Inverted http://www.wsj.com/articles/china-bonds-send-fresh-stress-signal-1494500938 …
We don’t have direct experience with Chinese macro and can’t say for sure whether an inverted yield curve serves as the same warning in China an inverted yield does in America. But it sure doesn’t sound like a major positive.
4. India
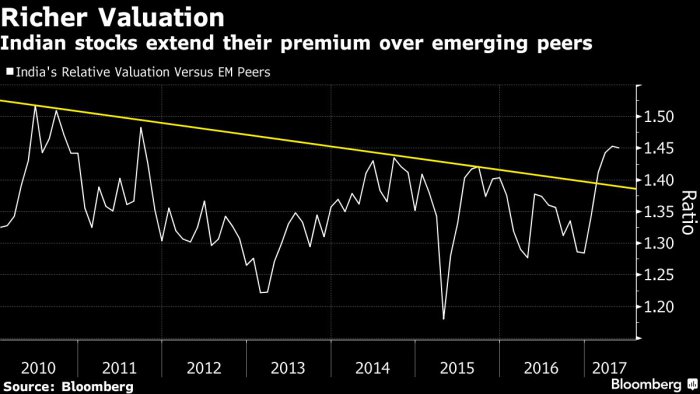
Our direct but empirical experience does suggest that fading over loved Indian stock markets works most of the time.
- Babak @TN Indian stock market is expensive compared to other emerging markets https://www.bloomberg.com/news/articles/2017-05-09/-one-trick-pony-india-is-worth-the-investment-risk-for-nomura …
Does it matter who is expressing love? We ask because Bloomberg reported “Locals driving Indian Stock Market as Foreigners’ Influence ebbs”.
- Overseas investors’ sway over India’s $2 trillion stock market is waning. Surging flows into mutual funds have placed domestic investors in the driver’s seat, providing a buffer against capital outflows sparked by global shocks, according to Deutsche Bank AG.
- Indian stocks have rallied to records as investors embrace equities amid falling returns from property and gold, a traditional favorite. Withdrawals by foreigners last month didn’t stop the S&P BSE Sensex from rising above 30,000 for the first time as local mutual funds plowed 112 billion rupees ($1.7 billion) into stocks, data compiled by Bloomberg show.
- The gush of liquidity has a downside — it is keeping market valuations elevated. The Sensex trades at about 18 times estimated earnings, the highest since 2010.
- “A massive boost of domestic liquidity is imparting further push to the valuation,” Abhay Laijawala, head of research at Deutsche Bank said. “Funds have taken over fundamentals.”
To throw in our own 2 cents, the Indian public is highly momentum driven and tends to chase performance. So this gusher of love from the Indian public tends to make us fade the rally. That, of course, is only for short term allocations. As we have said on numerous occasions, we intend to hold our long term holdings for another 10-15 years. Why? Because the long term trend of Indian GDP will take it above German GDP to become the 4th largest in another 15 years or so.
5. US Stocks
Jeffrey Saut of Raymond James wrote on Friday that his models suggest a bottom mid next week. On the other hand, Lawrence McMillan of Option Strategist remains neutral:
- “In summary, the indicators are mixed — either on sell signals or in overbought states, mostly. But $SPX has not confirmed a breakout in either direction for over two months, and until that changes, a neutral outlook is proper. $SPX is wound into such a tight range now (2380-2400), that it seems it only needs to break out of that range in order to give us some direction for the next intermediate-term move.”
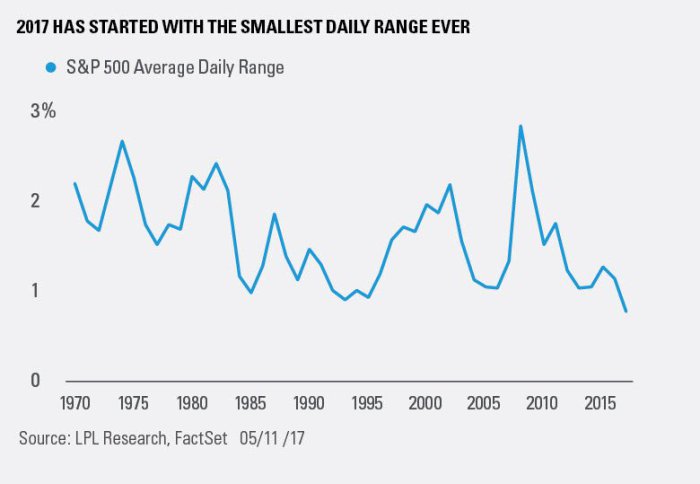
Concern was expressed this week about the low level of volatility & the calm placid nature of the market. But what follows such a period?
- Ryan Detrick, CMT @RyanDetrick – The
#SPX daily range in 2017 is the smallest ever. What does it mean? We take a look at this important question … https://lplresearch.com/2017/05/12/calm-before-the-storm-putting-this-years-tranquil-markets-in-perspective/ …
- “Looking at the four times the S&P 500 Index went six days in a row within a 0.50% daily range, it is important to note this lack of volatility usually happened amid bullish trends. Three months after the previous four streaks ended the S&P 500 was up 1.8% on average, and six months later its average gain was 3.3%.”
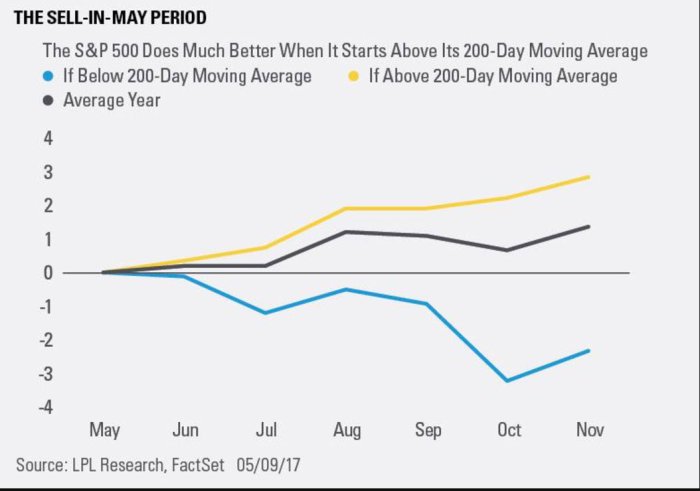
That seems to fit with the next week bottom call by Jeffrey Saut. But what about those who will sell in May and go away? How much of a decline would they be protecting?
- Ryan Detrick, CMT @RyanDetrick Nice chart that shows when “Sell in May” period starts with #SPX above the 200-day MA (like ’17), big dips are rare. https://lplresearch.com/2017/0
5/10/sell-in-may-and-go-away-t echnicals-suggest-otherwise/ …
With such data, why sell in May & go away? Or why sell at all? And you have some one as astute as Mark Cuban say Amazon, Netflix & Google are undervalued, so undervalued that he has sold puts in Amazon.
With all the bullish or semi-bullish opinions above, wouldn’t be ironic if we see a decline next week?
6. Gold, Silver & Miners
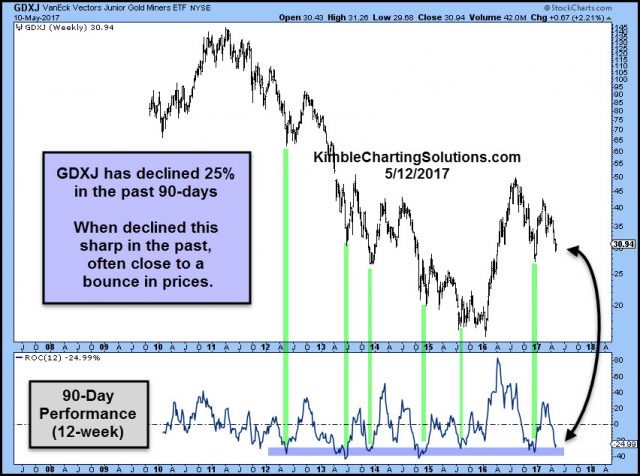
Last week, Carter Worth of CNBC Options Action said Buy Silver. That precious metal did rally by about 50 bps this week. That was about 50 bps higher than Gold which closed flat on the week. But Gold Miners were up big with GDX up 5.3% and GDXJ up 7.4%. Of course this rally seems very minor compared to the huge decline of the past several weeks.
But one saw beauty in the ugliness of the GDXJ decline. Kimble Charting pointed out – “GDXJ has fallen nearly 25% over the past 90-days. When GDXJ has been down this hard in a 90-day window, in during a bear market, it was closer to a short-term low than a high”
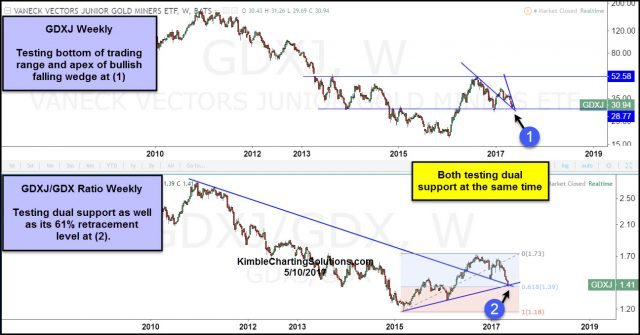
But is the GDXJ/GDX ratio suggesting the same?
Reckon so, as Josey Wells might say.
7. Oil
Back in mid-April, Carter Worth, resident technician at CNBC Options Action, called Oil a trap and recommended staying away. What about now? On Friday, Carter Worth was as bearish as in mid-April and said Oil & Oil stocks will continue to underperform the S&P. He also stated flatly “ there is no alpha in oil“.
8. Two versions
The incredible run of Baahubali the Conclusion continued this week with the film grossing 12 billion Rupees so far, a figure hardly any one would have imagined. This is a 100% Indian film with 100% Indian content.
We happened to watch Baahubali 1 this week and found one sequences that might have been inspired by a Hollywood film.
Which is better or more pleasing, the Hollywood original or the Bollywood version? Watch & decide for yourselves:
[embedyt] http://www.youtube.com/watch?v=ofmBgLEsthU[/embedyt]
Now the Baahubali 1 version:
[embedyt] http://www.youtube.com/watch?v=3u44qREuhrw[/embedyt]
The mask of the woman warrior had fallen down the enormous waterfall. The young man who lived at the base of the mountain gets the mask and climbs up the huge waterfall to discover the face behind the mask. The woman thinks he is a spy come into their camp and tries to capture or kill him. Then the duel above and the happy end once she finds he did climb up the mountain through the huge waterfall to return her mask.
Send your feedback to editor@macroviewpoints.com Or @MacroViewpoints on Twitter
