Summary – A top-down review of interesting calls and comments made last week in Treasuries, monetary policy, economics, stocks, bonds & commodities. TAC is our acronym for Tweets, Articles, & Clips – our basic inputs for this article.
Editor’s Note: In this series of articles, we include important or interesting Tweets, Articles, Video Clips with our comments. This is an article that expresses our personal opinions about comments made on Television, Tweeter, and in Print. It is NOT intended to provide any investment advice of any type whatsoever. No one should base any investing decisions or conclusions based on anything written in or inferred from this article. Macro Viewpoints & its affiliates expressly disclaim all liability in respect to actions taken based on any or all of the information in this article. Investing is a serious matter and all investment decisions should only be taken after a detailed discussion with your investment advisor and should be subject to your objectives, suitability requirements and risk tolerance.
1.”melt up”
The first four days were just great. Forget Dr. Pangloss. He was too restrained in his optimism. It was a melt up with stocks up & up, rates up & up with the Dollar up and Gold down & down. The first days were like … they were so good that we can’t even think of a suitable metaphor. So good that we didn’t even see anyone talk of exhaustion, DeMarkian or otherwise.
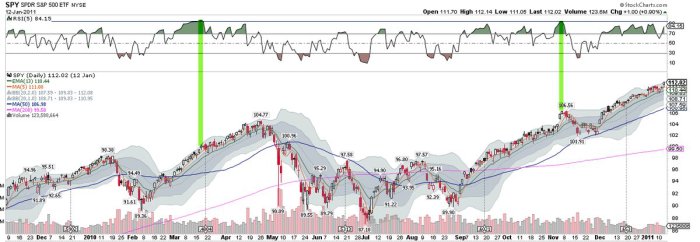
- Urban Carmel @ukarlewitz $SPY daily RSI(5) has closed over 95 twice in 13 years: mid-March 2010 and early Nov 2010. Currently at 95. Africa hot
Then came Friday with its Nonfarm Payrolls number that we couldn’t comprehend. Later on, we realized that we were not the only ones.
- Bespoke @bespokeinvest UER to 4.2%, U6 to 8.3%, LFPR up to 63.1%, AHE +0.5% MoM…this release is a complete mess to interpret.
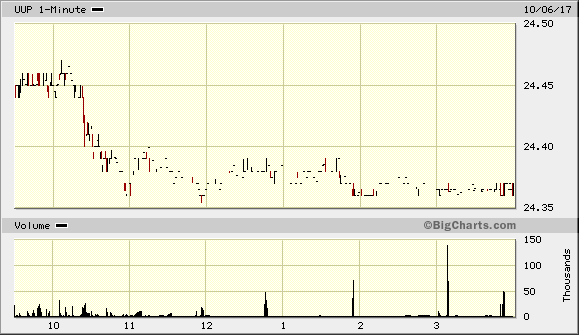
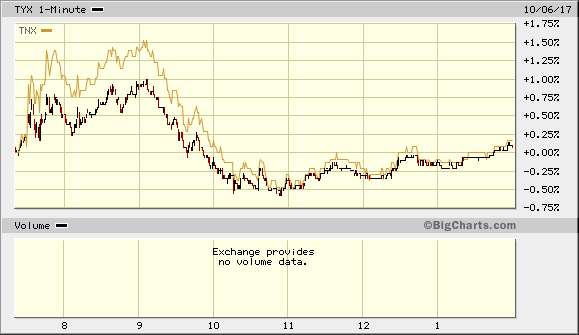
But the markets got it instantly or at least reacted as if they got in instantly. Dollar spiked and rates shot up. The highest shoot up was in the 5-year which rose 5 bps to 1.97%. The 10-year was next with yields touching 2.40%. But later in the morning, the markets seemed to hear Bespoke’s message. Look what happened then:
(Dollar -UUP) (10-yr-TNX in yellow & 30-yr-TYX)
The US Dollar actually closed lower on Friday. Treasury yields gave up a chunk of their big early morning rally but still closed up. The clearest move on Friday came from Gold.
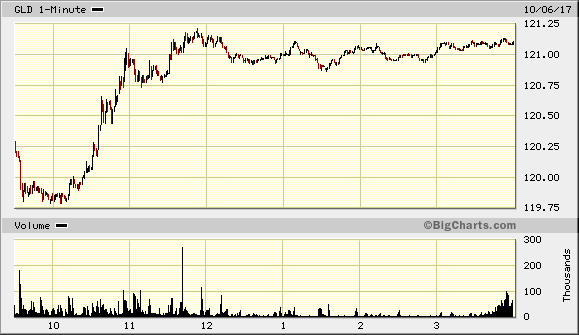 Will Friday’s semi-reversals of early morning action be just a one day event or will it last awhile?
2. Treasuries
In the immediate aftermath of the NFP report, it looked as if 1.5% on the 2-year, 2% on the 5-year, 2.40% on the 10-year were going to be broken on a weekly closing basis. But the 10-year turned back from 2.4%; the 5-year never got close to 2%. Only the 2-year closed above 1.50%. Every single ishares Treasury ETF closed above its 200-day moving averages – SHY (1-3 yr), IEI (3-7 yr), IEF (7-10 yr) and TLT (20-yr +). Once again, the 30-year was the most well behaved of these on Friday.
The only flags we understand are the national ones. Other are smarter:
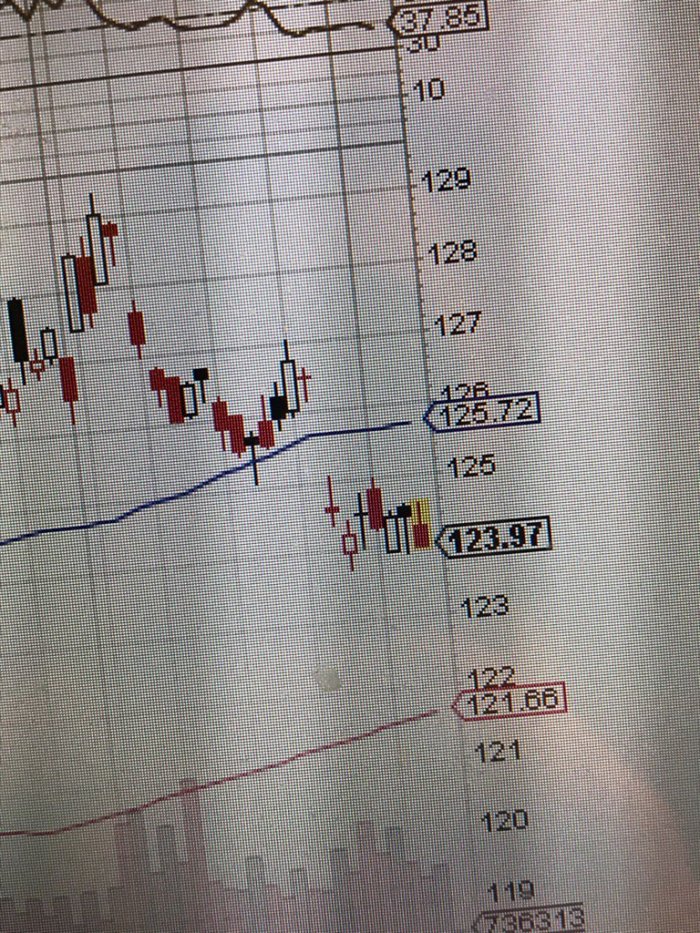
- J.C. Parets @allstarcharts Is that a bear flag in the US Treasury Bond ETF $TLT – or a bottom and about to rally? I say former. You?
HSBC’s Steven Major answered early morning on Friday on BTV Surveillance. Speaking ahead of the NFP number, he said an outlier NFP number would not matter much. He doesn’t see the 10-year yield rising above 2.5% and argues Treasury yields are headed down.
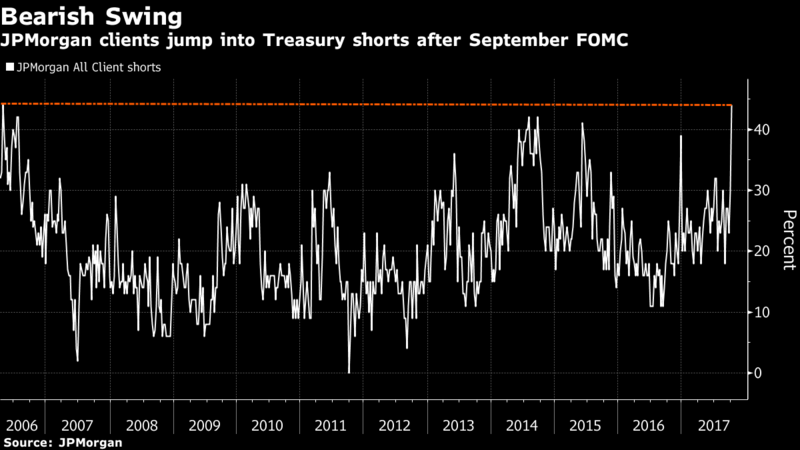
We don’t know what Gundlach thinks of positioning in Treasuries, especially of the JP Morgan kind:
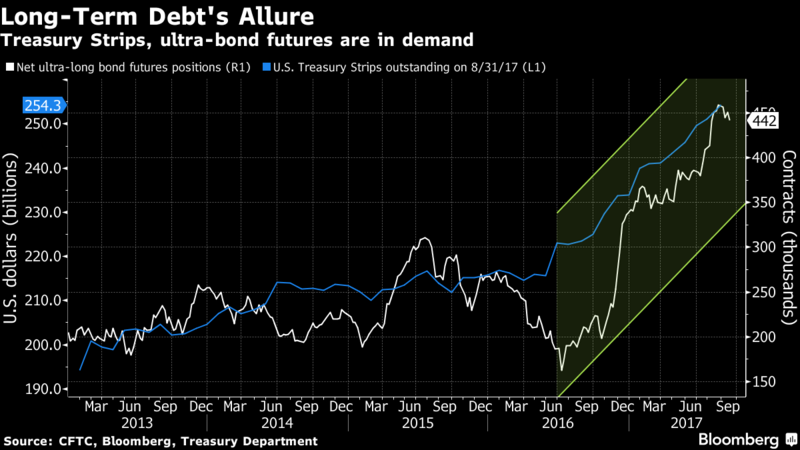
But Bloomberg is clear. The url of the above Bloomberg article titled it “biggest short in Treasuries in over a decade“. But another Bloomberg article described the opposite view of pension asset managers:
- … pension funds may be shifting cash into duration products after locking in gains in equities, said Steven Zeng, a rates strategist at Deutsche Bank Securities. Their demand may explain why the amount of Treasury notes and bonds split into principal- and interest-only securities, known as Strips, jumped to a record in August, he said. At the same time, asset managers’ holdings of ultra-bond futures — which designate Treasuries with maturities of 25 years or more for delivery — have surged.
This may explain why the 30-year has been much better behaved compared to the intermediate & short maturities.
What Treasury rates do from here may not matter to US stock indices given the momentum behind them & the allure of the year-end rally. But it should matter a lot to sector performance, especially to the chasm below:
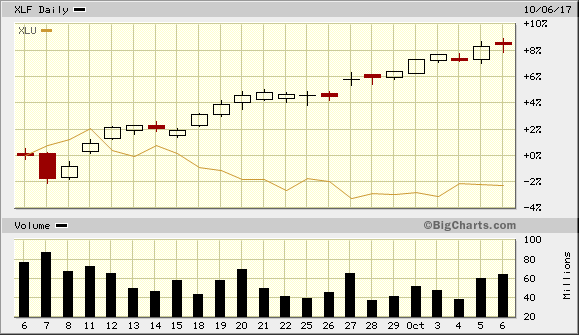 (XLF-Financials vs XLU-Utilities – 1 month chart)
3.1 US Equity Indices – Good news
Clearly the sentiment indicators for stocks are in love for ever territory. Not only is this a concern but also are valuation comparisons to 2000 & 2007. But there are some differences as well:
- Ned Davis Research @NDR_Research – Replying to @NDR_Research @TimH_NDR –Global Composite A/D Line entering Oct 2017 at new highs, trending up, unlike 1987, 1997 and 2007, when it was trending lower.
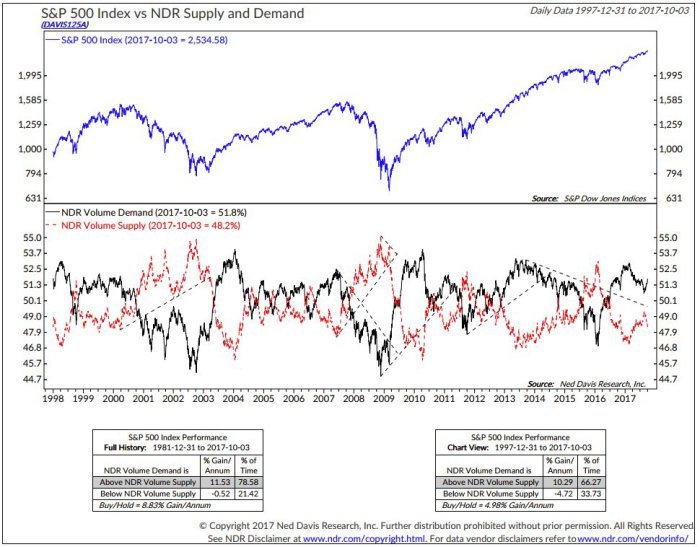
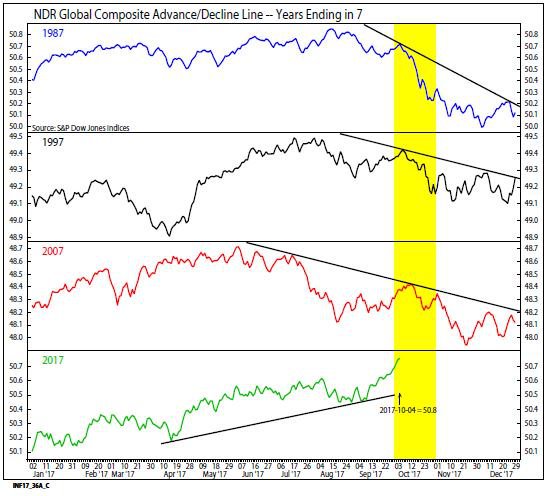 Since prices are mainly a function of demand vs. supply:
- Babak @TN LT trend intact as demand volume continues to dominate supply volume
$SPX$SPY source NDR via CMG
3.2 US Stock Indices – First Good, then Bad
CNN’s Fear and Greed index reached 96 this week. Some wrote sarcastically that it has 4 more to go before it hits 100. But what happened when this index was higher than today?
- Urban Carmel @ukarlewitz – Fear & Greed has closed higher than today once in 20 years: Nov 2004.
$SPX rose 3% into year end then fell 6% the following 5 months
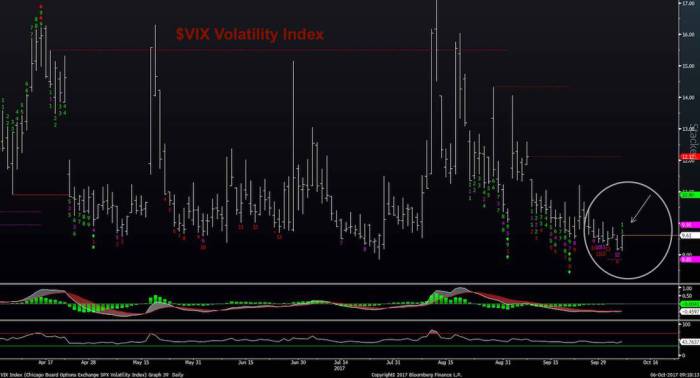
VIX is way low, actually the lowest it has been. But is that a false measurement? If so, is there still time to sell puts? WisdomTree said yes this week and pointed to the chart below:
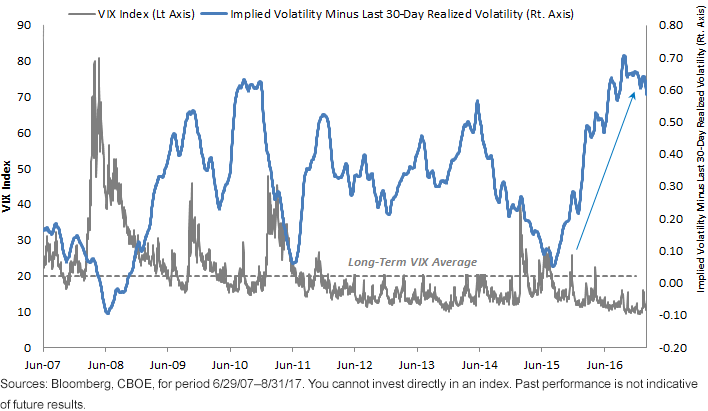 More than one guru spoke on TV about one final rally before the end of this cycle. One diagrammed it:
- Greg S., CFA @GS_CapSF Euphoria phase getting underway. Maybe one more pullback before run. @TheBubbleBubble@jessefelder@TommyThornton@MarkYusko@RampCapitalLLC
3.3 US Stock Indices – Risk Now
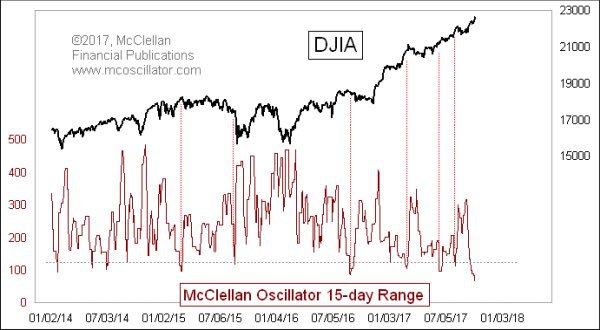
- Jesse Felder @jessefelder – The stock market has become excessively calm and quiet, befitting a meaningful top.’ –
@McClellanOsc http://www.mcoscillator.com/learning_center/weekly_chart/another_narrow_range_for_mcclellan_oscillator/#When:16:02:12Z …
Is “calm & quiet” a sign of exhaustion?
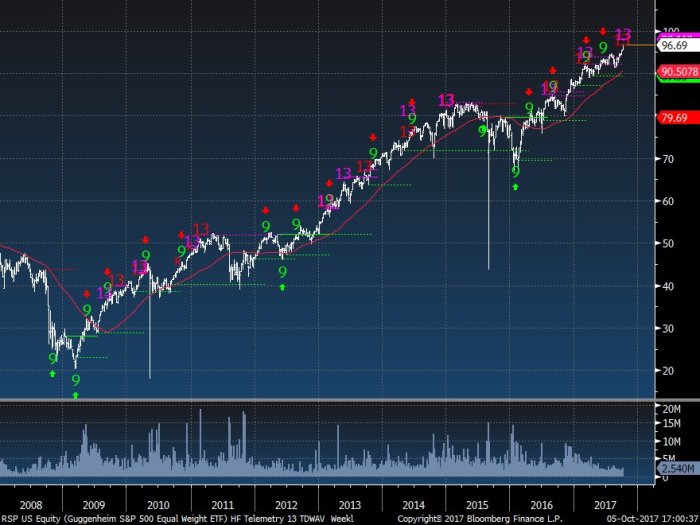
- Thomas Thornton @TommyThornton S&P equal weight index weekly upside DeMark exhaustion – note those are not bad ticks – they are flash crashes.
What might you do if you concur with the risk now school? Listen to Mark Newton, perhaps?
- See It Market @seeitmarket –NEW Blog: “U.S. Equities Trading Update: Prepare For Volatility” – https://www.seeitmarket.com/stock-market-trading-update-prepare-for-volatility-october-6-17345/ … by
@MarkNewtonCMT$SPY$QQQ$VIX
3.4 Emerging Markets – India
Two weeks ago (section 4), we discussed the reasons for the current slowdown in the Indian economy and the opportunity it might present to tactical buyers. This week we wrote about it in more detail in our adjacent article Economic Panic in India; Is That An Opportunity Again?
4. Gold
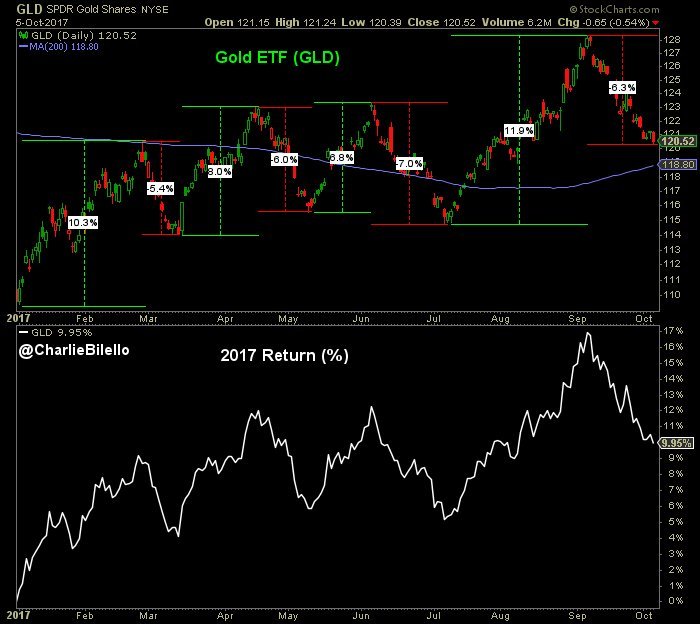
As we said before, Gold showed the clearest reversal of the post-NFP action on Friday. And it closed the week at an interesting point:
- Charlie BilelloVerified account @charliebilello Gold this year: +10%, -5%, +8%, -6%, +7%, -7%, +12%, -6%.
$GLD
5. Oil
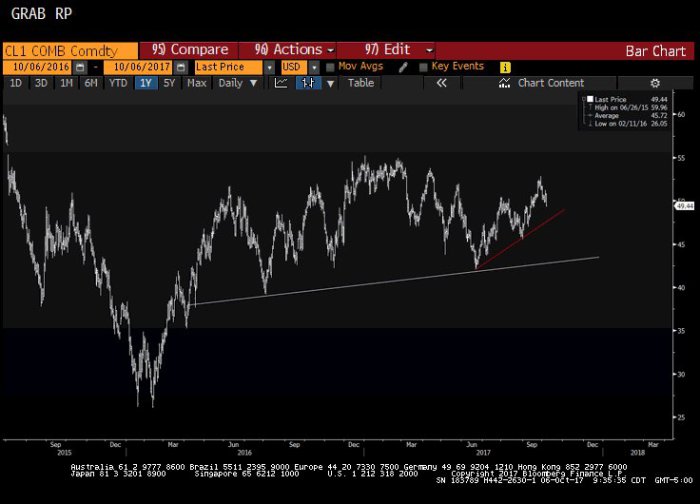
Rare agreement between a technician and a macro predictor?
- Raoul Pal @RaoulGMI Oil – Still looks like a clean top pattern forming. Still suggestive of $20 – $30 oil in next 24 months.
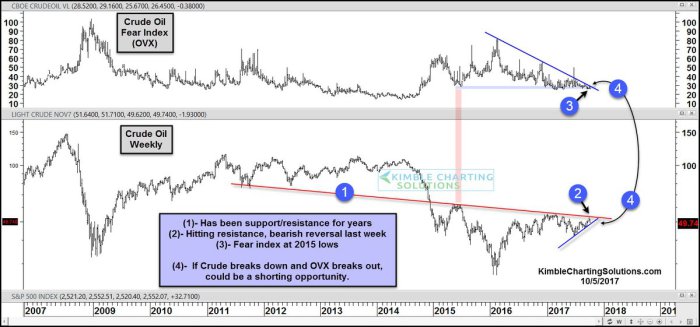
- Chris Kimble @KimbleCharting Crude Oil topping here? Support break in Crude, breakout in fear index, potentially bearish.
$CL_F$USO$XLE$SPY
6. Full Moon at Dawn?
Sounds contrary, doesn’t it? Not when the always erudite Dr. El-Erian uses his lens in addition to his mind. Lovely!
- Mohamed A. El-ErianVerified account @elerianm – A full moon … at dawn.
Send your feedback to editor@macroviewpoints.com Or @MacroViewpoints on Twitter
