Summary – A top-down review of interesting calls and comments made last week in Treasuries, monetary policy, economics, stocks, bonds & commodities. TAC is our acronym for Tweets, Articles, & Clips – our basic inputs for this article.
Editor’s Note: In this series of articles, we include important or interesting Tweets, Articles, Video Clips with our comments. This is an article that expresses our personal opinions about comments made on Television, Tweeter, and in Print. It is NOT intended to provide any investment advice of any type whatsoever. No one should base any investing decisions or conclusions based on anything written in or inferred from this article. Macro Viewpoints & its affiliates expressly disclaim all liability in respect to actions taken based on any or all of the information in this article. Investing is a serious matter and all investment decisions should only be taken after a detailed discussion with your investment advisor and should be subject to your objectives, suitability requirements and risk tolerance.
1.Bull Stampede
Last week’s action may have been a sweet Reindeer stampede. But this week’s action was a classic stampede of bulls. Last week we saw 25,000 on DJIA for the first time. That move from 24,000 to 25,000 took some 23 trading days. Some thought that was fast. Heck, we could get to 26,000 next week. That would put the 24K to 25K rush to shame in speed & intensity. And next week is Options Expiration. So who knows what fireworks we could see?
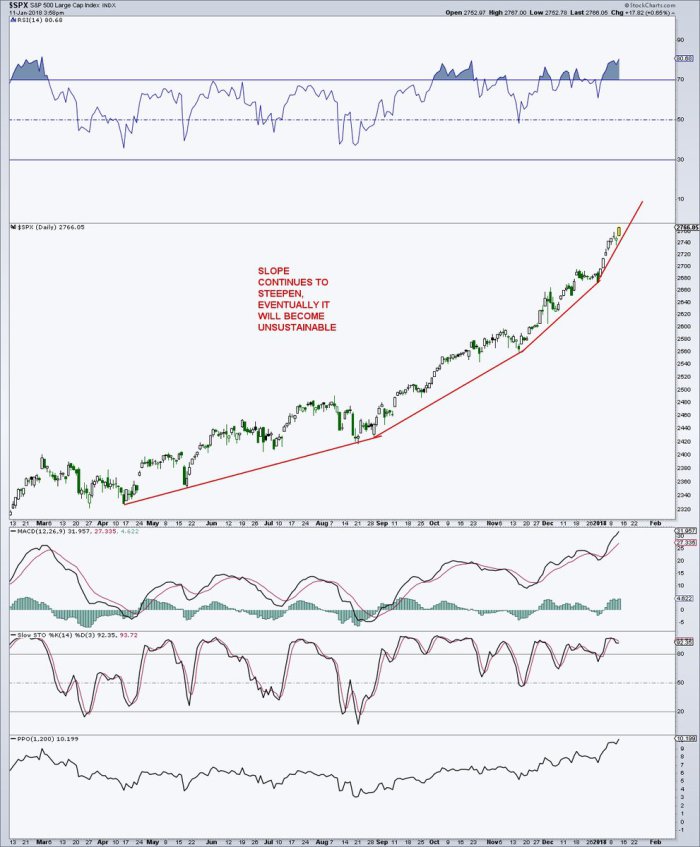
You know what fireworks do; they tend go up vertically. Our dear S&P is not behind:
- Mark Arbeter, CMT @MarkArbeter $SPX starting to look like a tech stock. Watch your slopes!
Clearly last week’s pullback warnings proved way early meaning wrong for this past week. After all, warnings are intended to prepare for what might come and not to jump ahead of the pullback. So what is a smart way to understand pullback warnings? A warning giver of last week explained this week:
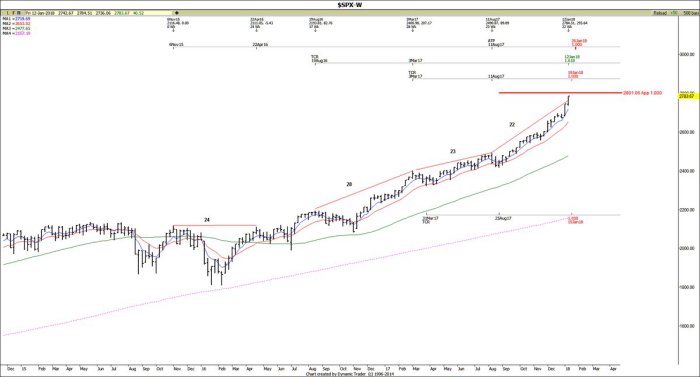
- Carolyn Boroden @Fibonacciqueen
$SPX weekly chart…..time resistance to be aware of…but don’t use this the WRONG way!!…best to just ratchet up stops on longs…leave the counter trend decisions to the pros….
So what could be a correct way?
- Lawrence McMillan of Option Strategist – “In summary, things are bullish. As long as $SPX is above support at 2700 and $VIX is below 13, the intermediate-term uptrend is intact.”
2. Where Jeffrey Gundlach, Rick Rieder & Pimco agree on rates
It is what Jeffrey Gundlach termed as a “no brainer investment” in his macro webcast on Tuesday, January 9 – the 2-year Treasury note that is yielding 2% on Friday’s close. The reasoning is simple. In a year, the 2-year note would become a 1-year note; so the capital loss would be small (even if the 2-year yield goes up to 2.5% as he expects) and the note may mature just about at the right time to take advantage of a down move in risk assets. We also heard Rick Rieder of BlackRock say that they like the short end of the Treasury curve and so does Pimco.
That is a rare agreement these days. Because so many have so many different views about the 10-year yield. Gundlach was clear & emphatic in his call – that long rates may be headed up with the 10-year yield eventually going to 3% and if it does, then it would be “game over” for Bonds. But 3% is quite far away. So he is focused (like Rick Santelli) on 2.63% level for the 10-year yield. If that is broken, then the rate rise of 10-year could accelerate. The 2.63% level on the 10-year corresponds to 3% level on the 30-year yield, he said.
But Gundlach warned that breaking the 2.63% level is not going to be easy. He thinks current conditions may be kinda like the Taper Tantrum. So a speculative trade would be to buy the 10-year Treasury around here with a 2.64% yield stop. That is not his style, Gundlach said, but the trade could work because the “convexity of being long Treasuries” is decent here.
Another guru voiced his agreement with the “taper tantrum” analogy and the 2.6% resistance:
- Andrew Thrasher, CMT @AndrewThrasher – Wed Jan 10 – Treasury yield move looks similar to late-2013 w/ the run up to the prior high showing markers of exhaustion. Many are looking for a breakout – I don’t see it. Could be wrong but I don’t see rates getting materially above 2.6%.
While we were listening to Mr. Gundlach’s conference call, the banner above the stock tape on CNBC Fast Money said “Bond Bloodbath Ahead“. With such an indicator, the long 10-year Treasury trade could work, right? Apparently, Carter Worth, resident technician of CNBC Options Action thought so too. He stepped up on Friday afternoon and said buy XLU, S&P Utilities ETF, as a mean-reversion trade.
Then you have the secular bull on Treasuries:
- Lisa AbramowiczVerified account @lisaabramowicz1 Longer-term U.S. Treasury yields are likely to decline, especially in the face of an economy that’s weaker than many think: Hoisington’s Lacy Hunt https://www.bloomberg.com/news/audio/2018-01-12/long-term-u-s-yields-likely-to-decline-hoisington-s-lacy-hunt …
@bloombergradio
3. US Economy, Reflation Trade & 3% on 10-year yield
The near term decline in 10-year yield call does fly in the face of the consensus of a global synchronized recovery and reflation. But we found a few lone brave voices that disagree with this consensus.
- Lakshman Achuthan of ECRI – ECRI’s leading indexes are telling us that there’s going to be a break in that momentum, meaning the 4th slowdown since 2010.
- Keith McCullough of Hedgeye– While investor consensus remains committed to the “globally synchronized recovery” narrative … our models are signaling quite the opposite …
Mike Wilson of Morgan Stanley sounded almost heretical and that too in that church of the reflation trade otherwise known as CNBC Fast Money, when he said – “I would be very surprised if in 2018 we don’t see a peak in the reflation trade“. Though Wilson is “still geared towards cyclicals for now“, he expects a “deceleration of growth rate” (but not recession) leading to “a rotation to the defensives“.
Congruent with “globally synchronized recovery” is what happens when the 10-year yield hits 3%. The ever-ebullient Howard Lutnick of Cantor Fitzgerald said “none of us would give a hoot if 2.5% went to 3%“. In stark contrast was Mike Wilson’s flat statement – “if we get to 3%, I absolutely believe we will see money moving from stocks to bonds“.
4. Credit & Stocks
Jeffrey Gundlach said credit spreads were too tight and that this is a “horrible time to buy corporate bonds“. A similar view about High Yield bonds was via:
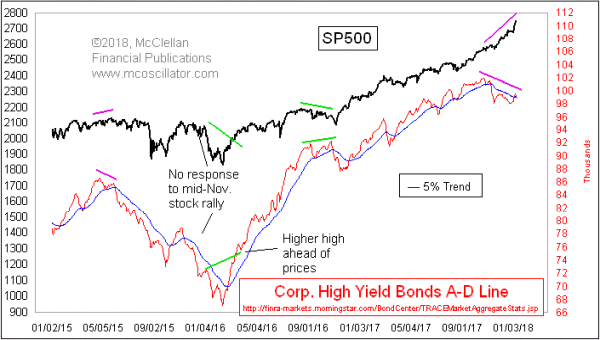
- Jesse Felder @jessefelder ‘The divergence in the High Yield Bonds A-D Line is an early warning of big trouble to come.’ http://www.mcoscillator.com/le
arning_center/weekly_chart/the _chart_that_worries_me_hy_bond _a-d_line/#When:03:30:46Z … by @McClellanOsc
Excerpts from McClellan’s article:
- “There is no divergence yet between stock indices and the NYSE’s composite A-D Line. But there is one in the High Yield Bonds A-D Line, and that is an early warning of big trouble to come.“
- “The SP500 had its final price top in October 2007, and we had warning of that from the NYSE A-D Line which had peaked in June 2007. But the High Yield Bonds A-D Line peaked all the way back in May 2007, giving even earlier warning that liquidity was starting to be a problem.”
- “This warning from the High Yield Bonds A-D Line fits well with my expectation of a significant stock market top due in March 2018. That expectation comes from my eurodollar COT leading indication, which I discussed in a Chart In Focus article back in April 2016. We feature that regularly in our twice monthly McClellan Market Report and our Daily Edition.”
- “The first half of 2018 will likely see a pickup in volatility and credit spreads as said fundamental tailwinds are eroded, at the margins. … we believe global investors would do well to rotate out of EM and into DM, as we expect the former to underperform over the intermediate term.”
5. Commodities
What is the best investment for 2018? Gundlach said Commodities. He added commodities always do well in late cycle economy and ahead of a recession.
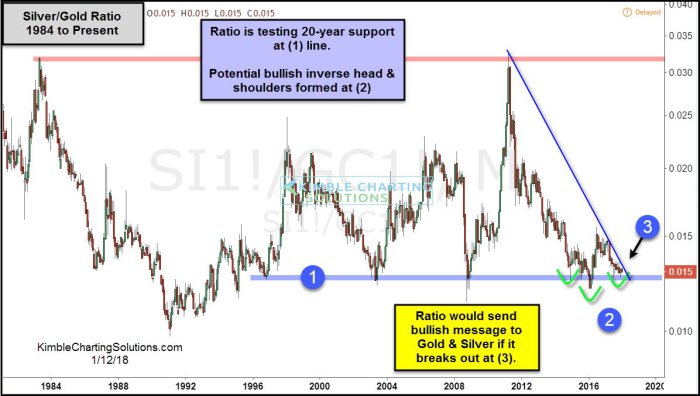
The US Dollar got hit hard this week and closed down 1.2% on the week with DXY threatening to break below 90 at this rate. This was positive for Gold and Gold miners. Chris Kimble sees an inverse head & shoulders pattern in Gold:
- Chris Kimble @KimbleCharting Gold & Silver could be creating monster bullish pattern says Joe Friday.
$GLD$SLV$GDX$GDXJ$DXY$EURUSD https://kimblechartingsolutions.com/2018/01/gold-silver-potential-monster-bullish-pattern-says-joe-friday/ …
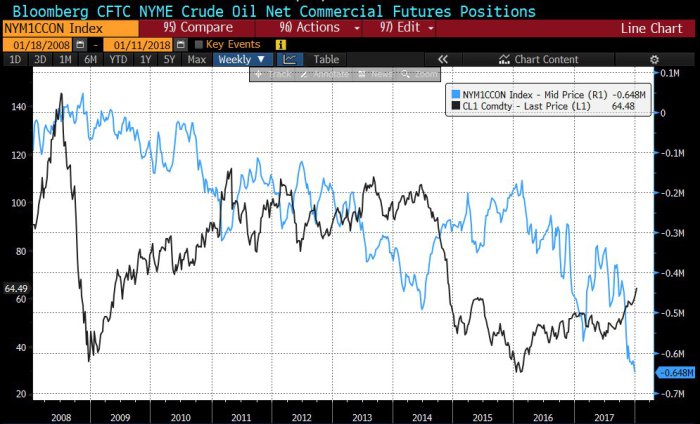
Oil continued its torrid run with a 4.7% rally on the week. Energy stocks also continued their run but at a slower rate than oil. This is also seen in positioning:
- Santiago Capital @SantiagoAuFund – #Oil at highest price in almost 3yrs. Specs never been more long and Commercials never been more short.
Send your feedback to editor@macroviewpoints.com Or @MacroViewpoints on Twitter
