Summary – A top-down review of interesting calls and comments made last week in Treasuries, monetary policy, economics, stocks, bonds & commodities. TAC is our acronym for Tweets, Articles, & Clips – our basic inputs for this article.
Editor’s Note: In this series of articles, we include important or interesting Tweets, Articles, Video Clips with our comments. This is an article that expresses our personal opinions about comments made on Television, Tweeter, and in Print. It is NOT intended to provide any investment advice of any type whatsoever. No one should base any investing decisions or conclusions based on anything written in or inferred from this article. Macro Viewpoints & its affiliates expressly disclaim all liability in respect to actions taken based on any or all of the information in this article. Investing is a serious matter and all investment decisions should only be taken after a detailed discussion with your investment advisor and should be subject to your objectives, suitability requirements and risk tolerance.
1.”Volatility is a mystery“
“Also Sprach” Shiller or Thus Spoke Shiller, Nobel Laureate in Economics, this week on FinTV. Before we explore the linkage between current volatility/economic conditions & Zarathustra/Nietzsche concept of “eternal recurrence of the same“, let us simpletons first look at what $VIX did this week and what it might portend for next week.
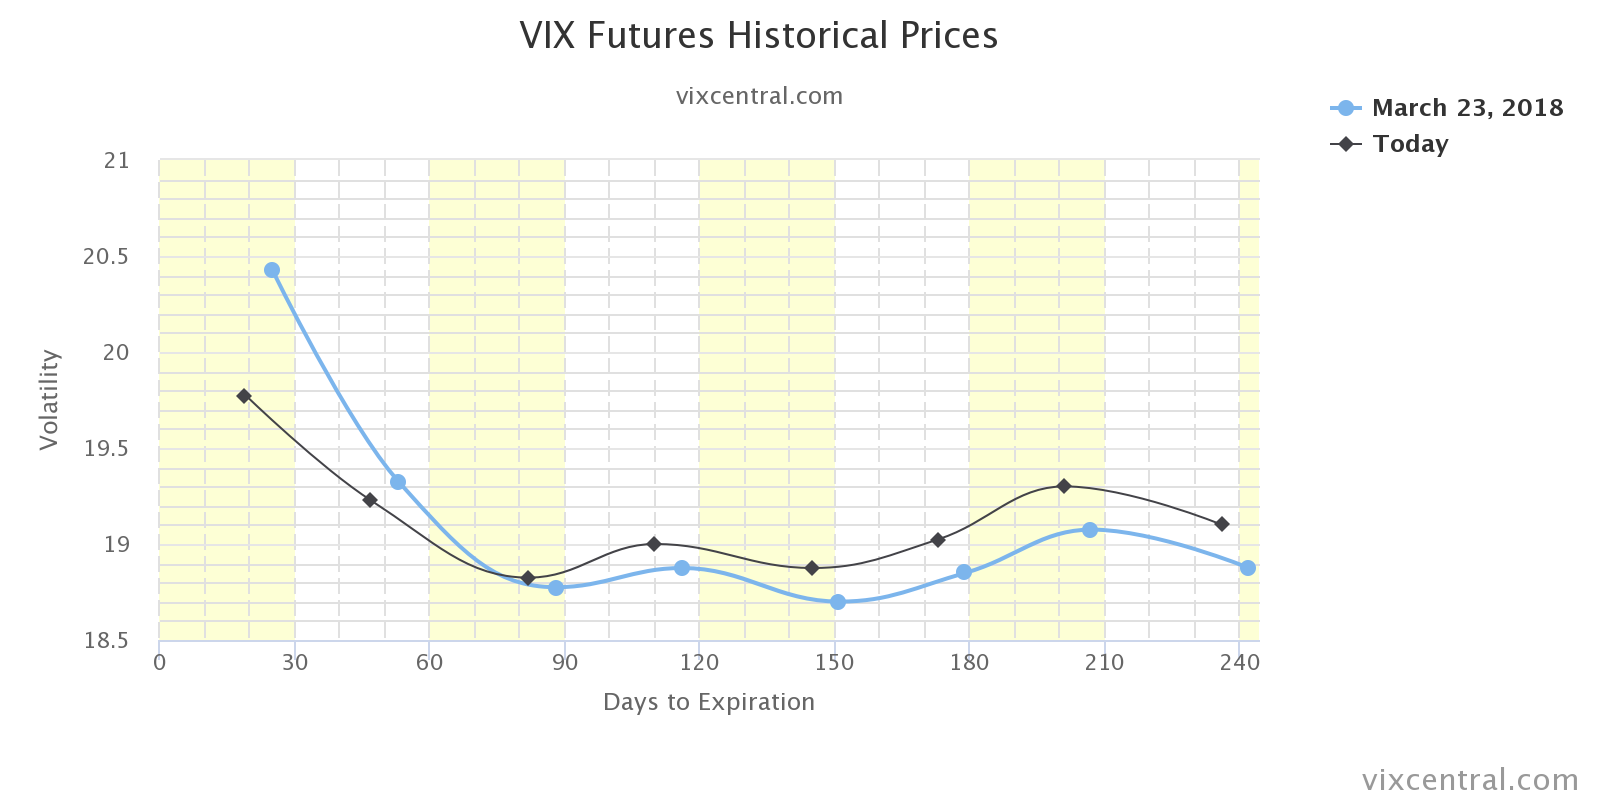
This past week, $VIX fell by 20% while it had exploded up the week before by 70%. That should suggest a further drop in $VIX for this week. The $VIX curve seems to suggest something similar if modest.
 The US Stock indices behaved similarly. While the Dow and S&P rallied by about 2.2% this week, the two had fallen by 7% the week before. Despite the 570 point rally this week, fear levels remain high in one indicator:
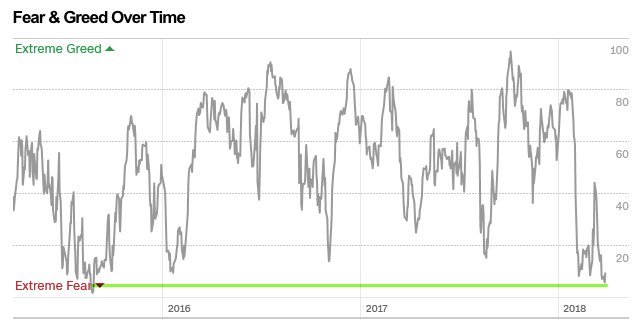
- Urban Carmel @ukarlewitz – CNN Fear & Greed at 9. Lower than Feb 2016, lowest since September 2015 (2-1/2 yrs)
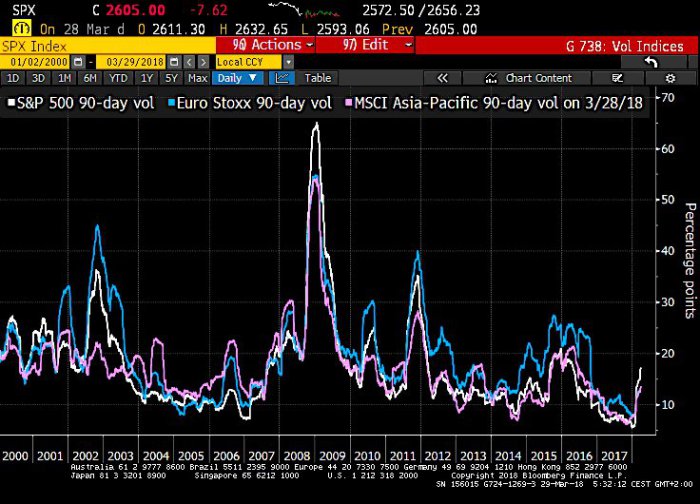
 What is more interesting is that, unlike 2016, 2015, 2011, 2010, the epicenter of the current volatility is the S&P 500 instead of Europe or Asia-Pacific, despite the biggest potential crisis being Korea & China tariffs, both in the Asia Pacific sector.
- Holger Zschaepitz @Schuldensuehner – US stocks are the Epicenter for Volatility, BBG writes, as realized volatility spiking well above the levels in Asia & Europe. That sounds a dire warning considering the last 2 times that happened were Lehman-led 2008 meltdown & the burst of dot-com in 2000/01.
When asked for reasons for the correction in stocks in February-March, Paul Ciana, technician at BAML, told CNBC Futures Now that rally in US stocks had reached an extreme in January & short volatility positions had also reached an extreme in January. President Trump driving through his Tax Cut in December was a major pillar on which S&P positioning went to extreme longs. And confidence in President Trump and the euphoria about what had been achieved was the foundation for extreme short positioning in volatility.
These two extreme positions have been concurrently & substantially reduced if not eliminated with a near perfect inverse correlation in $VIX and S&P 500. But the third extreme in positioning has not even begun its unwinding and it has been the least discussed on FinTV.
The confidence in the economy propelled by the Trump Tax Cut was also the foundation of the confidence that Treasury interest rates were headed higher, a lot higher as the Fed would keep raising the Fed Funds rate in 2018 & 2019. That led to an extreme short positioning in 2-year Treasury notes that still remains extreme despite the carnage in stocks, explosion in $VIX and 20 basis fall in the 10-year Treasury rate.
Paul Ciana of BAML told CNBC Futures Now on Thursday that the “2-year yield monthly RSI was at 85” which he termed “beyond stretch of imagination“. He added the “2-year Treasury note is extremely oversold and it has never been so oversold“.
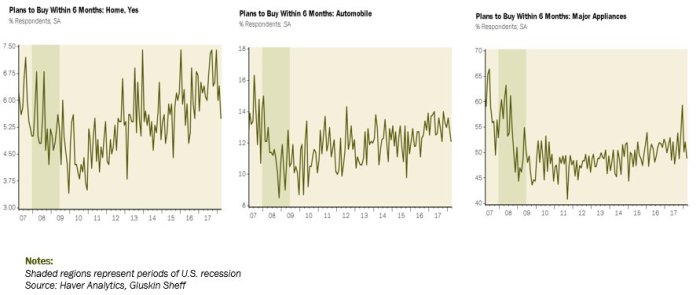
This is despite the US consumer, responsible for 70% of US economy, being “debt-strapped out and tapped out“, per the tweet below:
- David Rosenberg @EconguyRosie What does it mean when we have booming employment and massive tax cuts….and household buying plans take a deep dive? Here’s what it means — the consumer is debt-strapped and tapped out. Pent-up demand is a relic of the past.
Yet, consumer & small business confidence remains high. Why? Is that because of “Tale Risk”, a term Robert Shiller coined in March, 2014.
2. Shiller & Trump Tale Risk
In his March 20, 2014 article titled “The Global Economy’s Tale Risks”, Robert Shiller wrote:
- “Fluctuations in the world’s economies are largely due to the stories we hear and tell about them. Since Prime Minister Shinzo Abe assumed office in December 2012 and launched his program of monetary and fiscal stimulus and structural reform, the impact on Japanese confidence has been profound.”
Nine days later, we used this term & concept for the Narendra Modi wave in our article Why Are They Upgrading India Now? – “Wave” or “Tale Risk”? Not only did Shree Modi win a landslide victory, but the Indian markets went on an explosive rally.
As we all saw, the Trump phenomenon in 2016 was another pure realization of Shiller’s Tale Risk. Actually that Shiller term seemed understated & almost wrong for the Trump phenomenon. So, on December 3, 2016, we wrote Donald Trump – From Tale Risk to “Tale Reward” in 3 Weeks.
Frankly, Professor Shiller did not use his Tale Risk concept for either PM Modi or President Trump. Actually, as far as we could tell, he was not a fan of either Candidate Trump or President Trump.
Now, this week, Professor Shiller embraced the Trump Tale Reward in his NYT article The Trump Boom Is Making It Harder to See the Next Recession.
- “The truth is that we really can’t foresee where the economy will be heading in a year or two, a limitation that is particularly troubling right now, in the midst of what may be called the Trump economic boom.”
- “President Trump is, after all, a public figure like no other, and his unique — and polarizing — effect on mass psychology appears to be muddling the economic data even more than usual.”
- “At the moment, Mr. Trump appears to be elevating the levels of the main confidence indexes. That’s to be expected: He may well be the first president who is, at his core, a motivational speaker.”
- “Mr. Trump has personified these ideas and attracted millions of people to them, shifting mass psychology in ways that the confidence indexes will have a hard time capturing. The indexes routinely miss the major changes in spirit that cause long-term economic phenomena like the reckless prosperity of the Roaring Twenties, a decade of high adventuresome spirit in business.”
This may be why Prof. Shiller admitted on FinTV this week – “I am not as pessimistic as my CAPE ratio“.
In fact, this Trump Tale may be the only reason for the optimism of many Trump voters:
- Richard Bernstein @RBAdvisors – Not being political but this
@CreditSuisse chart seems important relative to lack of wage growth & recent Kansas teachers strike.
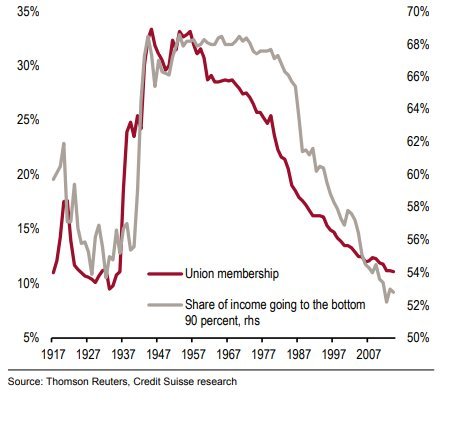 Look at the above chart and ask yourselves whether President Trump’s attack on Amazon for killing local retailers across America makes political sense or not. We won’t be surprised to see the rhetoric against social media and internet giants escalate this summer as symbols & causes of low wages of American middle class.
That will be combined with President Trump enthusiastically pitching to voters a major Infrastructure Bill after the midterm elections, a bill that will add real money into the local economies. He will ask voters to elect people who will work with him to deliver such a bill that will create jobs in their localities. Having passed a Tax Cut and acted on Tariffs as he had promised in his 2016 campaign, he will have credibility.
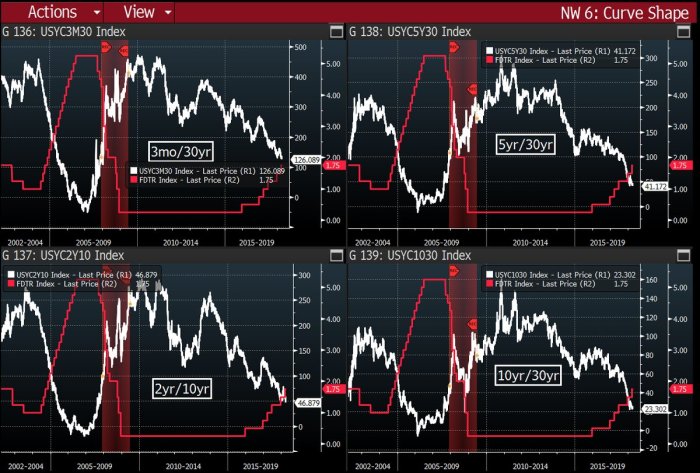
Now switch back to Fed Chairman Powell. He sees what we all see – the consumer is strapped, growth is tepid and yield curve is getting flatter. In fact, he might be having nightmares already seeing the chart below from @TheBondFreak, Randy Woodward:
So unless the economy accelerates into June and consumer gets less strapped, we expect Chairman Powell to skip the June rate hike. And if investors begin believing that, it won’t take long for the extreme short positions in 2-year Treasuries to burn in the bonfire of their own vanity.
A combination of the Trump Tale Reward and a decline in interest rates may be what will push the recession risks into a later time frame. That may be why Prof. Shiller is not be as pessimistic as his CAPE ratio.
3. Interest Rates
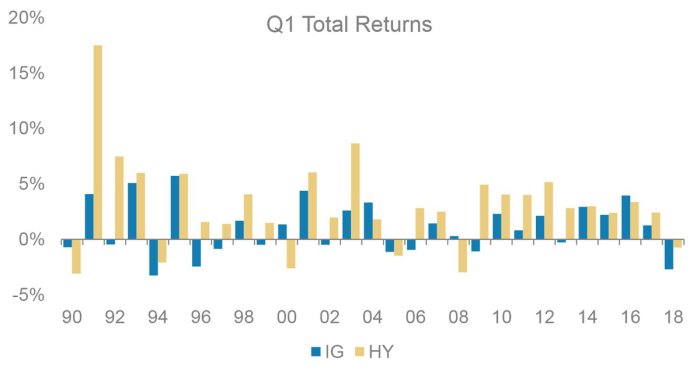
Treasuries was the only asset class that rallied hard both this past week and the week before that. The best performer was the 30-year yield which fell by 9 bps and broke thru the 3% level to close at 2.97%. The 10-year yield fell 7 bps to close at 2.74%, thus decisively breaking the 2.80% – 2.90% range. And investment grade credit is coming off a terrible Q1:
- Tracy Alloway @tracyalloway – On total returns, the first quarter of 2018 has been one of the worst first quarters *in history* for IG U.S. credit. (1994 was worse, but not by much)
 On the other hand, two straight weeks of gains have created a somewhat overbought condition and next week features ISM, Services ISM, ADP and Non Farm Payrolls on Friday. And then, you have the PC-word and we don’t mean political correctness:
- David Rosenberg @EconguyRosie – Today’s PCE deflator revealed that 1/5th of the categories that make up the index managed to pass through price increases in excess of 10% SAAR in Feb! Another stat we haven’t seen in over a decade (Jan 2007). This bond rally may not have many more legs left if this persists.
So Caveat Trade Location?
4. Stocks
What does the S&P look like at quarter end?
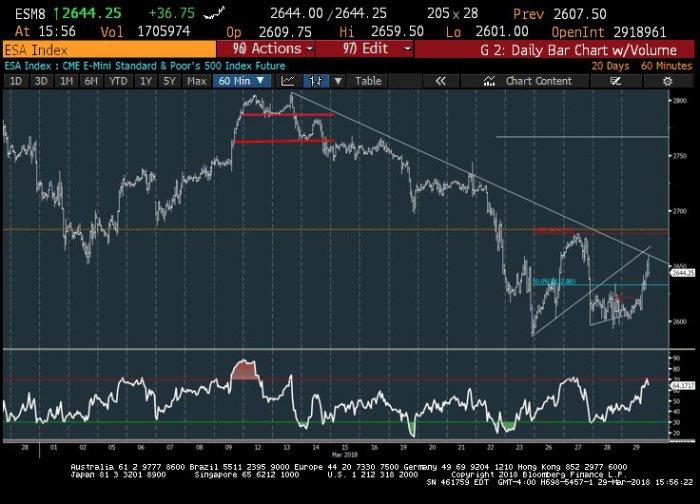
- Mark Newton @MarkNewtonCMT – OVERALL, from a ST Technical perspective-its TOUGH to enter the mth of APRIL BULLISH just yet.. as near-term momentum became overbought on hourly charts.. while Daily and weekly momentum are NEGATIVELY SLOPED, while the market (S&P) also still lies in a downtrend from 3/13 highs
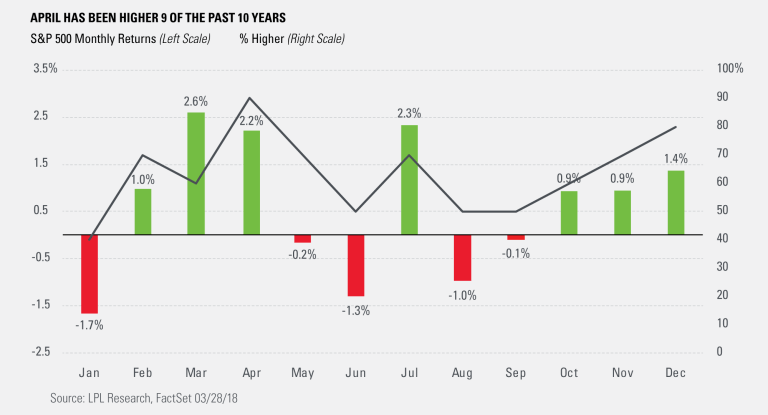
 Against that, you have relatively high $VIX, hopefully welcome data & April seasonality, which Ryan Detrick of LPL Research describes as “April has only showered gains lately, as the S&P 500 has posted positive returns in 9 of the past 10 years”.
 What other shocks may come from unwinding of extreme positions?
- Raoul PalVerified account @RaoulGMI – Oil (down) and the dollar (up) are the last shoes to drop in the rapidly shifting market narrative/trend change. I think risk reduction may well force an ugly liquidation event in oil longs and dollar shorts very, very soon leading to an even larger VAR shock.
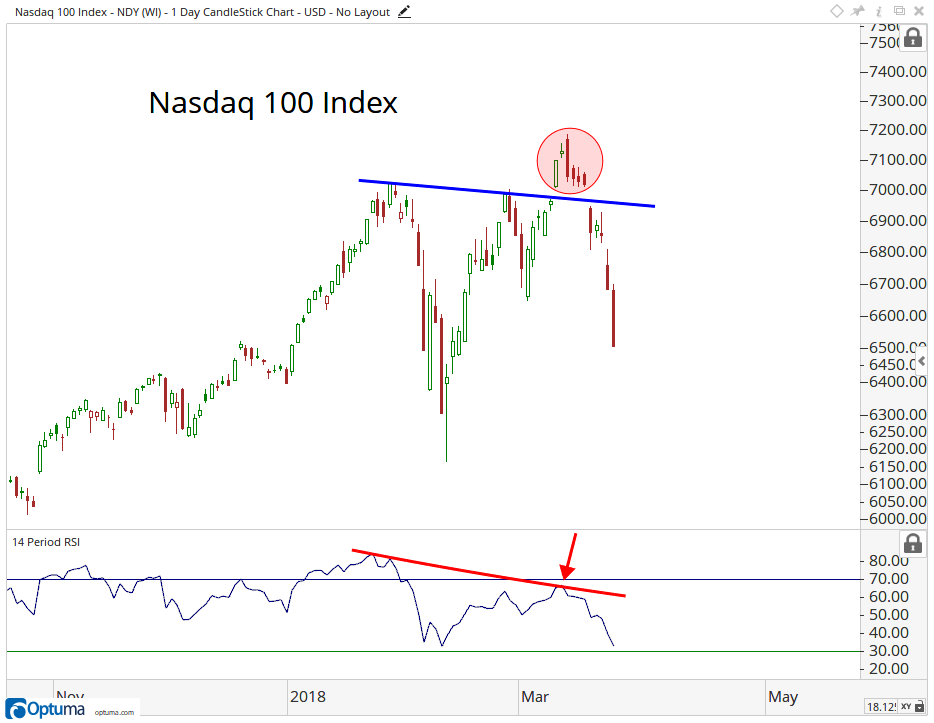
Now the most interesting & possibly most important change of heart of this past week – a post from J.C. Parets titled The Island Reversal That Will Now Be A Problem:
- In this case, we’re talking about new all-time highs above resistance the past couple of months in the Nasdaq 100 Index. That’s kind of a big deal, and it failed.
- What this Island Reversal left behind was a big mess. Taking a step back, this failed breakout (the island reversal), confirmed a bearish momentum divergence. These aren’t things we see in strong uptrends.
- First, we know this is overhead supply for sure. So we don’t want to be aggressively long from any sort of intermediate-term perspective, unless we’re above that. The risk here is to the downside, not the upside. We will get rallies, possibly even back towards 7100, but I think they will fail for now.
Send your feedback to editor@macroviewpoints.com Or @MacroViewpoints on Twitter
