Summary – A top-down review of interesting calls and comments made last week in Treasuries, monetary policy, economics, stocks, bonds & commodities. TAC is our acronym for Tweets, Articles, & Clips – our basic inputs for this article.
Editor’s Note: In this series of articles, we include important or interesting Tweets, Articles, Video Clips with our comments. This is an article that expresses our personal opinions about comments made on Television, Tweeter, and in Print. It is NOT intended to provide any investment advice of any type whatsoever. No one should base any investing decisions or conclusions based on anything written in or inferred from this article. Macro Viewpoints & its affiliates expressly disclaim all liability in respect to actions taken based on any or all of the information in this article. Investing is a serious matter and all investment decisions should only be taken after a detailed discussion with your investment advisor and should be subject to your objectives, suitability requirements and risk tolerance.
1.Positioning
Gundlach & other smart guys tell us that positioning is a large factor in analyzing trade location. So we thought we would begin with today’s positioning across asset classes:
- Raoul PalVerified account @RaoulGMI – Don’t forget we have: The largest long position in the history of equities The largest underweight in the history of bonds The largest short position in the history of bond futures (5 yr) The largest short position in the history of Eurodollar futures Part I
What about Part 2?
- Raoul PalVerified account @RaoulGMI – Don’t forget… Part 2 The biggest short vol position in the history of markets (all assets) The biggest long position in the history of oil markets The near biggest long position in the history of copper The largest short position in the dollar ever recorded.
As the saying goes, last but not the least.
2. U.S. Dollar
Guess what? The U.S. Dollar rose 1.4% this week, a rise greater than the the rise in Stock Indices, Treasuries, Gold, Silver, Oil & Copper. Is that just a spasm or fake out?
- Peter BrandtVerified account @PeterLBrandt Mon 4/23 –
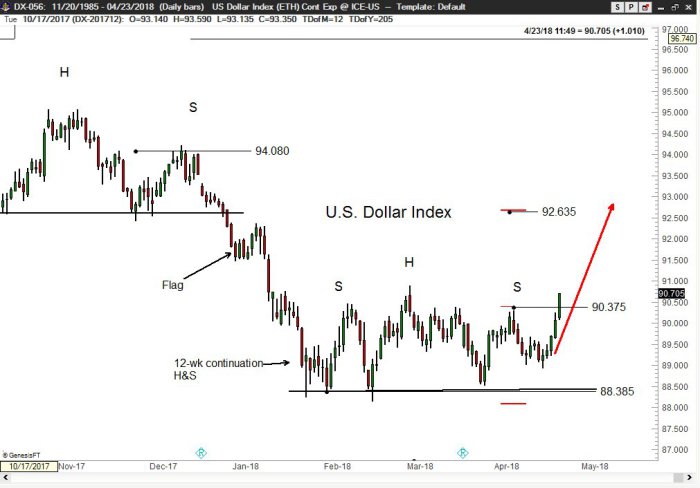
#Factor_Members#Classical_Charting_101 U.S. Dollar poised to flash major buy signal today by completing H&S bottom failure — also known as compound fulcrum. Per weekend Update, buy side appropriate
Any one else?
- Trading Ideas @AlertTrade Thu 4/26 – Trading Ideas: UUP broke the weekly downtrend in a long time http://dlvr.it/QQtDb7
 FREE trade-of-week via http://bit.do/FREEtrade
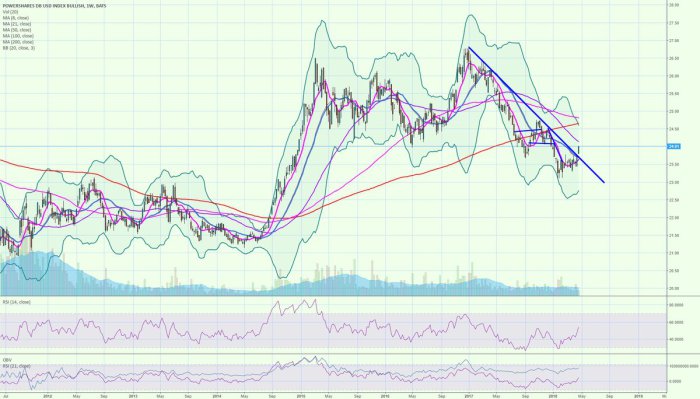 But as Rick Santelli keeps pointing out, DXY is still below its year-end 2017 level of 92.3. Can you have a breakout without DXY going + ve in 2018?
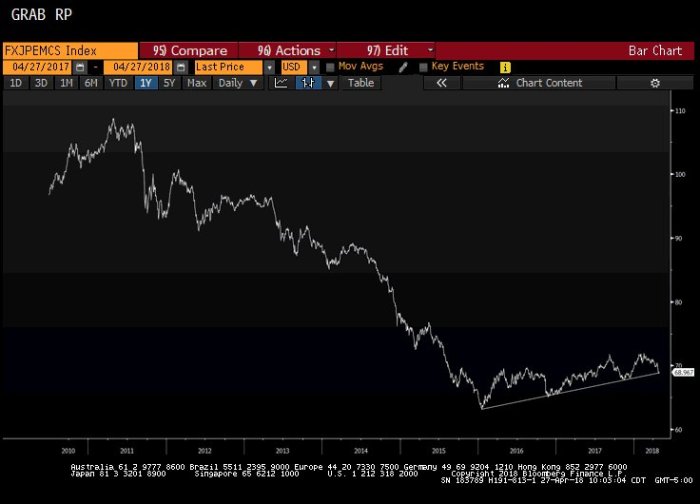
If Dollar is about to break out, then EM Currencies should be about to break down, right?
- Raoul PalVerified account @RaoulGMI – Emerging Market FX is on the verge of breaking down vs the USD. Here is JPM EM currency Index… need to watch closely.
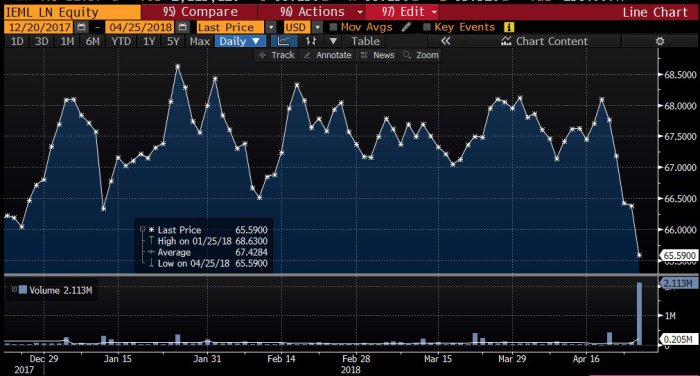
If EM FX is about to break down, then shouldn’t we see some evidence in EM local currency Debt?
- Lisa AbramowiczVerified account @lisaabramowicz1 Local-currency emerging-markets debt is getting hammered. This $7.6 billion ETF focused on the debt has fallen to the lowest price of the year. As the dollar strengthens, the risk-reward proposition is shifting. https://www.bloomberg.com/news/audio/2018-04-24/higher-u-s-yields-are-shifting-the-risk-reward-in-em-sassower …
Most of the week was spent by Fin TV in discussing where interest rates would go when they break the 3% barrier. Yet, at the end of the week & after large Treasury auctions, all rates along the Treasury Curve (except the 2-year of course) closed down.
That doesn’t mean rates will not cross the Rubicon next week given the FOMC meeting on May 1-2. And if rates do go where Fin TV says they are going, what could happen? What tends to happen every summer in the forests of the western states? Inferno!
- Lisa AbramowiczVerified account @lisaabramowicz1 – “Leverage in the U.S. is grotesque for this stage of the cycle. At the moment you’ve got peak leverage at peak prices. It’s not like you have to dig deep to find a problem.”
The Bloomberg article she references shows:
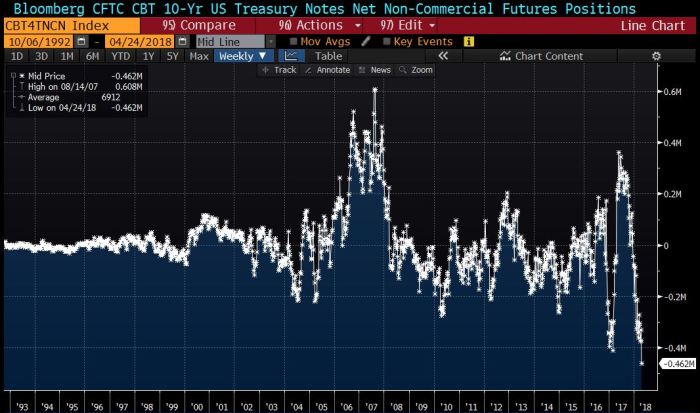
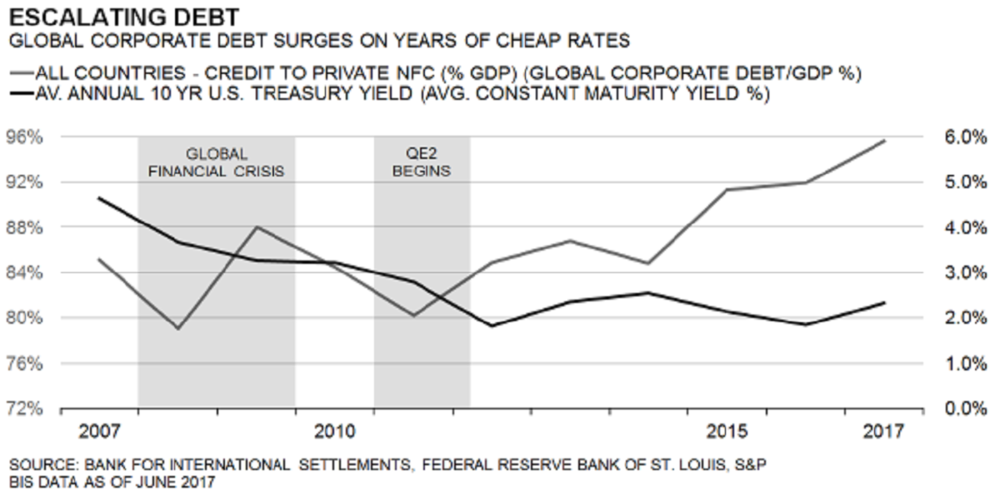 Large speculators do not seem to care because they are acting the way Fin TV is talking:
- Brian ChappattaVerified account @BChappatta – BREAKING: Hedge funds and other large speculators boost net short position in 10-year Treasury futures to RECORD level.
 If 10-year yields are rising thanks to all the above selling of 10-year Treasuries, then the 30-year yields must be shooting up even faster, right?
- Danielle DiMartino @DiMartinoBooth – New cycle low on 10/30
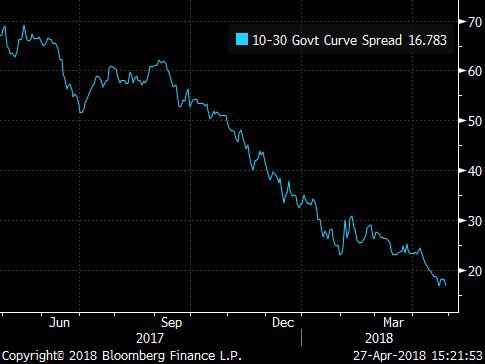 Yes, the 30-10 year yield spread fell to 17 bps on Friday. We just don’t get it. When the 30-year yield is as close to the 10-year yield, the Treasury market is virtually dismissing the probability of long term inflation. Isn’t that only possible in a long term deflationary environment?
Yet,
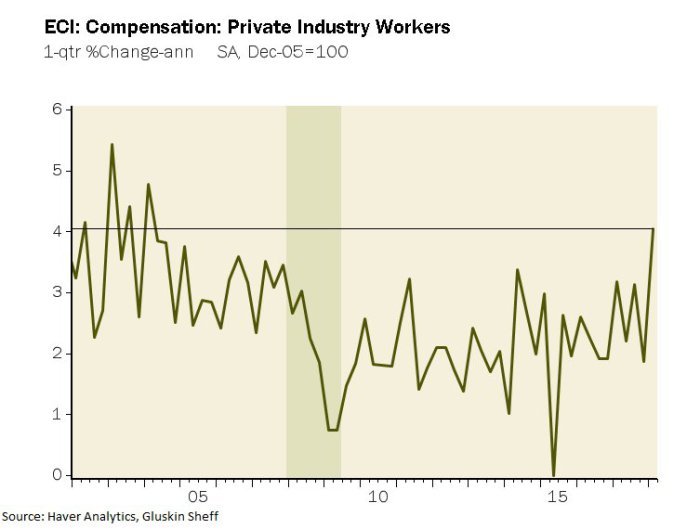
- David Rosenberg @EconguyRosie – But I would argue that the biggest data shocker of the day was the 4% annualized jump in private sector employment costs. We haven’t seen this since the first quarter of 2004!
So where is the deflation?
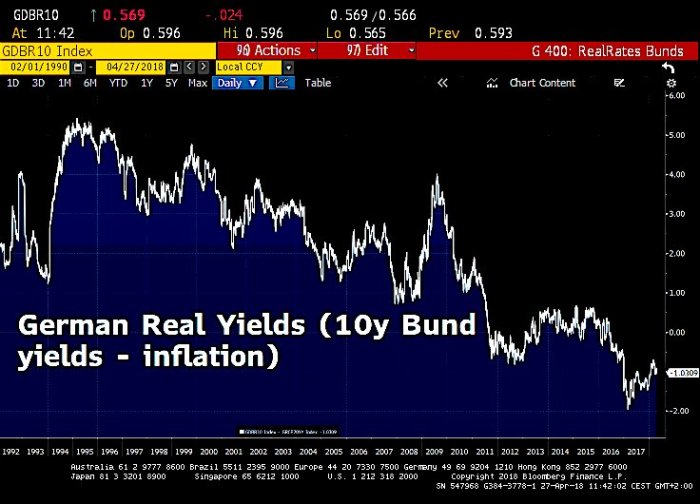
- Holger Zschaepitz @Schuldensuehner – Redistribution of wealth from savers to governments seems now official
#ECB policy. Outgoing ECB Vice President says that there is no return to simple old school monetary policy. Real rates fall deeper into negative territory. https://www.welt.de/finanzen/article175867139/EZB-Sitzung-Vize-Vitor-Constancio-erklaert-Rueckkehr-zur-einfachen-Geldpolitik-fuer-nicht-moeglich.html?wtmc=socialmedia.twitter.shared.web … via@welt
 So are there any buyers of long duration Treasuries?
- Holger Zschaepitz @Schuldensuehner – Who wants to buy US Treasuries at these levels? Citigroup for one. Target rally to 2.65%. https://www.bloomberg.com/news/articles/2018-04-26/citigroup-says-buy-3-10-year-treasuries-target-rally-to-2-65 …
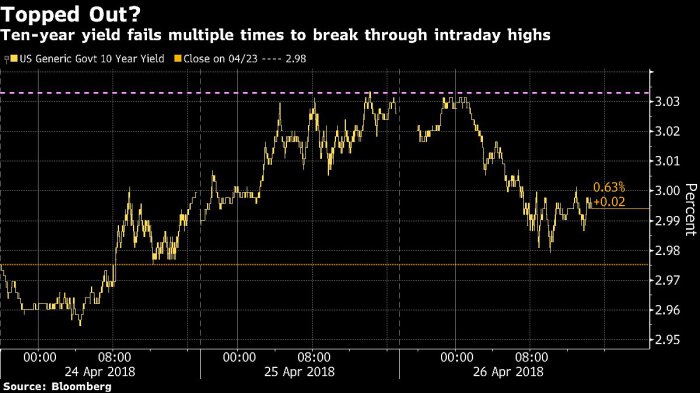 Citigroup is not the only one, it seems:
- Lisa AbramowiczVerified account @lisaabramowicz1 As 10-year Treasury yields fall below 3% once again, here are some of the firms that may be buying.
By “here” she meant the FT article that said:
- “Global bond fund managers are dubbing yields on 10-year US Treasury notes as “attractive” now that this important benchmark for financial markets has risen above the “symbolic” 3 per cent threshold for the first time since early 2014. Fixed income managers Pimco and Fidelity are among a number of investors who believe that the 10-year yield is unlikely to rise much further, reflecting a view that inflation is not going to accelerate rapidly.”
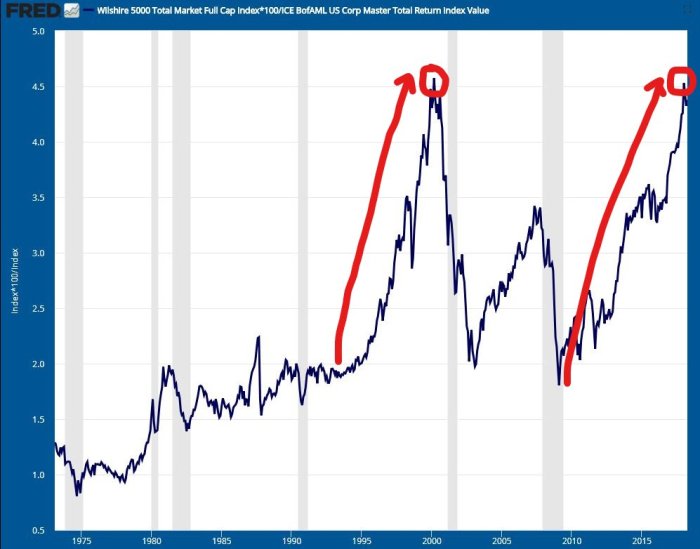
So assuming Citigroup, Pimco, Fidelity are somewhat right & knowing today’s historic long positioning in stocks coupled with historic short positioning in bonds, you have to ask whether we have seen this before? Some say yes:
- Cantillon Consulting @CantillonCH More –
#Stocks v#Bonds on a total return basis. We’ve all been here before, folks…
That brings us to,
4. Stocks
First, the only unadulterated positive we can find:
- Babak @TN – NYSE operating company only AD line continues to be supportive of major trend having already recovered to Jan 2018 highs while indices like S&P 500 remain in correction mode
$SPX$SPY
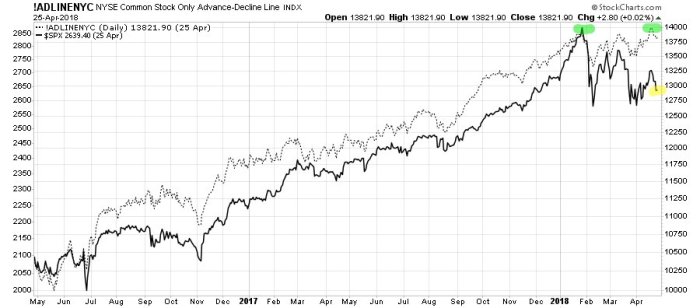 But is the above really an unadulterated positive? Or do the two green circles suggest a possible double top? Time & S&P will tell.
The next non-negative expression was:
- Chart Swing Trader @ChartSwingTrade Wed Apr 25 – I should probably just take a week off. Individual charts are destroyed but with low volume on indices day trades are tough (too choppy).
Hopefully this trader didn’t take that evening & Thursday off. Because both Facebook & CMG blew away numbers on Wednesday afternoon & Amazon delivered what Cramer called the best quarter he had seen followed by superb quarters from Intel & Microsoft.
But then,
- Bespoke @bespokeinvest – Nasdaq 100
$QQQ just went flat-line after opening up $2.50. Investors taking every chance they can get to sell gaps up.
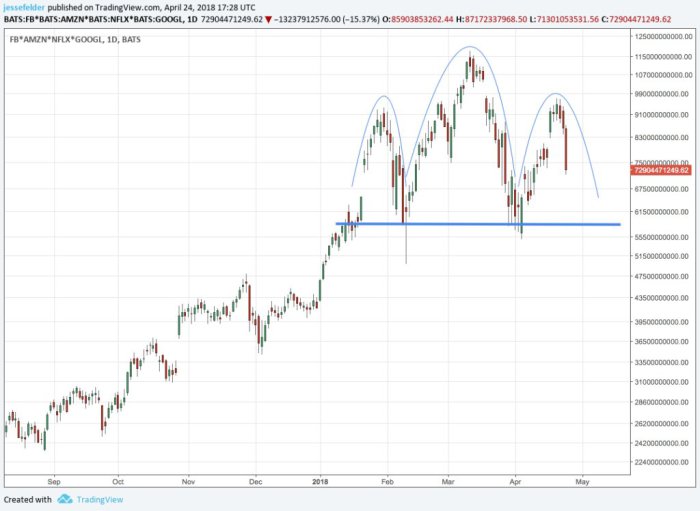
Add to this the debacle in GOOGL. FANGs seem to have gone from a +ve leader to a -ve leader:
- Peter BrandtVerified account @PeterLBrandt
#Classical_Charting_101 This chart by@jessefelder is actually quite scary. FANG displays possible powerful H&S top.$AMZN$NFLX$FB$GOOGL
What about Semis? Look what one DeMarkian actually did on Friday:
- Thomas Thornton @TommyThornton – Doubling
$MU short to 5%, Adding$STX short 2.5%,$HD short 2.5%,$NVDA short 2.5% size all on today’s Hedge Fund Telemetry daily note
This is consistent with:
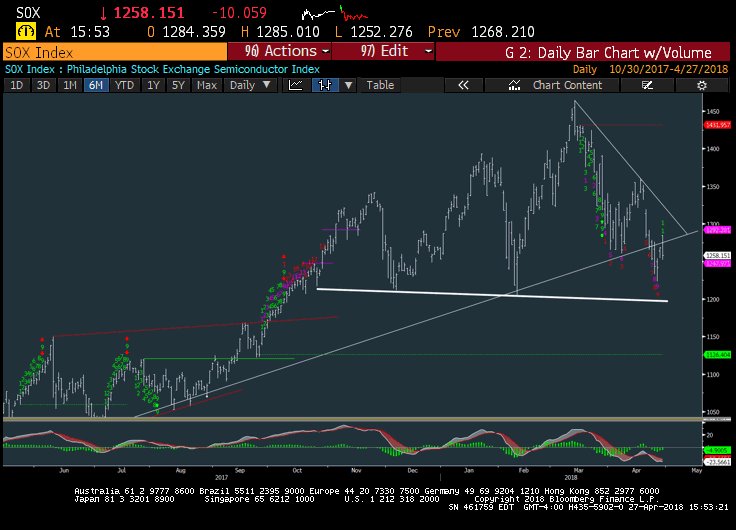
- Mark Newton @MarkNewtonCMT – No matter how you slice it. the Semis simply DON”T look that attractive here. Charts have turned ominous with DEEP retracements to the base- Watching
$SOX carefully for evidence of breaking down given leading sector qualities.. Avoid and/or consider Technical$SMH Shorts
 So Semis are a sell/short & Nasdaq 100 is in doldrums. Where can we look for leadership? Financials perhaps?
- Mark Newton @MarkNewtonCMT –
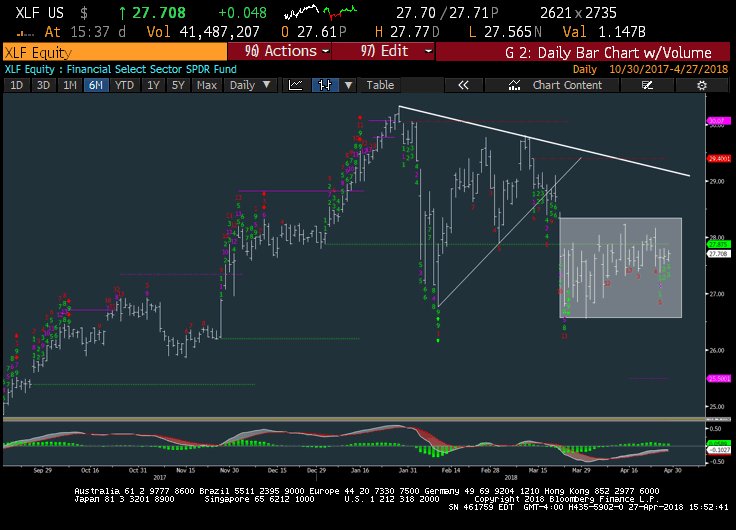
$XLF Financials have been rangebound now for the last month. Scary given “Good” earnings.. Geopolitical tension easing.. NOT a great sign.. and trend RANGEBOUND in$XLF, but largely still under pressure from late Jan.. and 1, 3 mth underperformer
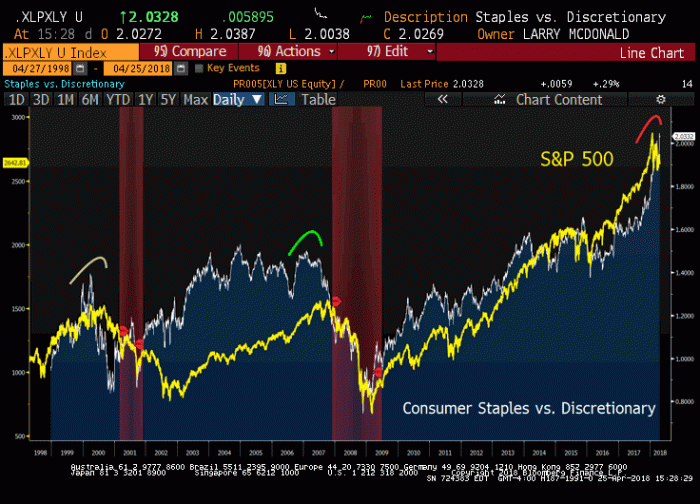
 Wait – Staples seem to have shown some life near the end of this week. Look what Larry McDonald wrote in The Bear Traps Report:
- Bottom line, the parabolic (see the white line above) outperformance of the consumer discretionary names (ratio of XLY to XLP) has been incredible and is “classic” late cycle activity. The value depression end is in sight in our view. Value will crush growth over the next 12-18 months. A solid leading equity market indicator above, watch for a shift in consumer staples.
But wait! Is this a sector we want as leadership? Look what Larry added:
- “The sector typically starts to outperform (after a period of blow off top underperformance) 12-18 months ahead of substantial equity market drawdowns and recessions.“
That leaves the only sector Larry calls a “screaming buy”, that Gundlach recommended & that Kevin O’Leary bought for his draft – Energy. But a little detour first:
5. Apple, Disney/Fox & India
Remember how India was supposed to be the next big market for Apple’s iPhone? Those who still believe that should read the reports that came out this past week. A summary by the Economic Times said:
- “The market share of iPhone maker Apple plunged while Samsung dominated the premium smartphone segment in India in the first quarter of 2018, as per two market research reports released today.
- The premium segment accounts for 4 per cent of the overall smartphone market in India and three brands — Samsung, OnePlus and Apple — contributed to 95 per cent of the overall share in the segment, the report said. “In the super premium (handsets priced above Rs 50,000 a unit) flagships segment, Apple saw its share decline from 82 to 25 per cent,” the report said”.
What was the reaction of some in India?
- Rajneil Kamath @rajneilkamath – This is hardly surprising. Apple wants special rules and norms for itself, while others have been manufacturing within the existing framework. Ofcourse their customer service is so legendary, that even Xiaomi puts them to shame.
This may not affect Apple’s earnings much but what does it do to Apple’s projected growth rate?
At the other extreme is Fox, soon to be Disney:
- Uday Tharar @udaytharar – With his phone tied to the steering my auto rickshaw driver in
#Mumbai has the most innovative way of watching#IPL
This may show why Fox’s “Star India bought the five-year global media rights for an unprecedented $2.55 billion, making the IPL one of the richest sports properties in the world. Valuations specialist Duff and Phelps had valued the IPL brand at $5.3 billion in 2017, a 26 percent increase from $4.2 billion last year.”
As a CNBC article pointed out:
- “It’s a new sports league, but the IPL is beginning to draw comparisons with established international sports tournaments like the English Premier League and the National Basketball Association in the U.S. In fact, one IPL game is now valued close to an EPL game.”
And this is in an India that is still very poor in terms of per capita income. No wonder, Disney wants to buy Murdoch’s Star Network in India.
By the way, IPL cricket is not the old 5-day cricket interrupted by lunch & tea in the afternoon. It is a fast paced 3-hour game where anything can happen and which is presented in an absolutely Indian entertainment style. It is already eclipsing Bollywood as entertainment.
To get a glimpse of T20 format of cricket, watch how the final 4 balls of the world cup final between West Indies & England turned it from a certain loss to a stunning historic win for the West Indies with the cry “Remember the name – Carlos Braithwaite”:
[embedyt] http://www.youtube.com/watch?v=dg_9IClzrao[/embedyt]
By the way, IPL has become a huge jobs generator for India, jobs for ordinary lower income Indians. And Virat Kohli, Indian team captain is already the world’s most expensive athlete (fees per commercial) per Bloomberg. And all this why India is still a poor country.
6. Oil
Energy stocks got so much love this week. Jeffrey Gundlach gave Long XOP Short Facebook as his trade at the Sohn conference. Kevin O’Leary chose Chevron as his top pick in the CNBC Stock Draft (he won last year with his second pick, Boeing) and Larry McDonald called XLE & XOP “screaming buys”.
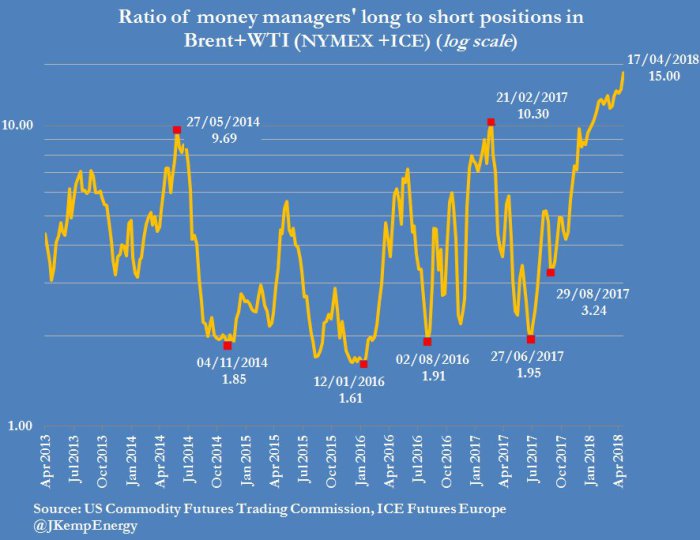
This is in the face of what Raoul Pal called “the biggest long position in the history of oil markets“. Since a picture is worth 1,000 words:
- John Kemp @JKempEnergy – HEDGE FUNDS and other money managers hold 15 long positions for every short position in Brent+WTI — the most lopsided positioning on record
We wonder whether concept of price symmetry of Caroline Boroden (Cramer’s favorite technician) applies the XOP chart below?
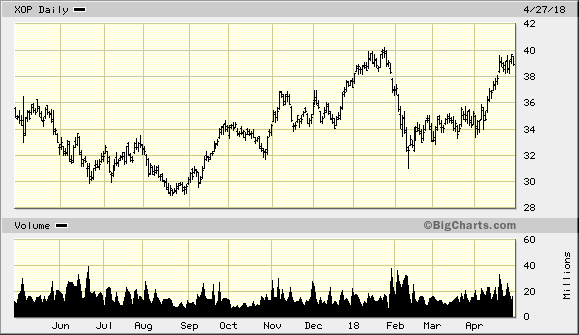 XOP has rallied 5-6 points 4 times in the past year – nearly 6 points from 34 to 39+ in April, from 34 to 40 from mid-December 2017 to late January 2018, from 32 to 37 in November 2017, from 29 to 34 in September 2017. The 3 prior rallies were followed by severe declines. So we wonder whether the current rally from 34 to 39+ will lead to a hard decline as well.
Of course, the symmetry here is in raw price ranges & not in time or the fancy levels Ms. Boroden uses. So it is highly likely that Gundlach/O’Leary/McDonald prove right and our amateurish question proves wrong.
7. Gold & Silver
According to Reuters, Jeffrey Gundlach said the following about Gold:
- Gundlach said gold prices, which have broken their downtrend line, were on the verge of breaking out to the upside. “It’s getting almost exciting … something big is happening,” he said.
- “Gold is maintaining an upward pattern above its rising 200-day moving average, which is extremely good,” he added.
- Based on classic chart reading, Gundlach said an “explosive, potential energy” of a huge “head-and-shoulders bottom” base was signaling a move of $1,000 in gold prices.
- “I’m not predicting it … I’m letting the market prove itself,” he said.
Also,
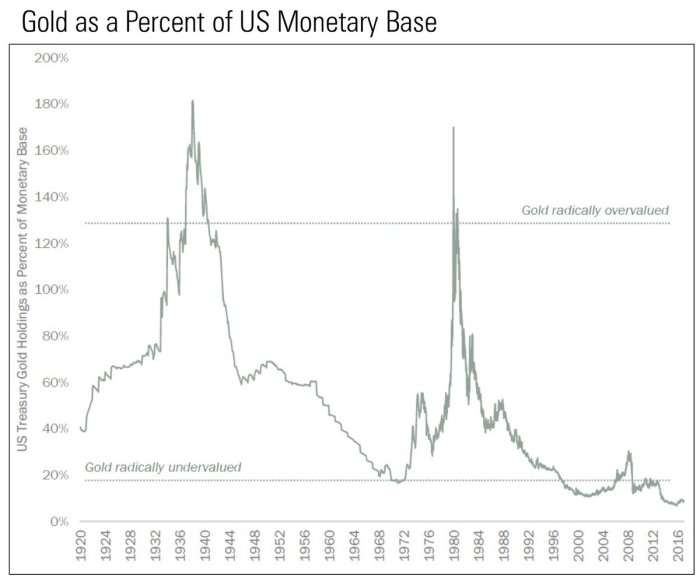
- Jesse Felder @jessefelder 2 hours ago – More – Gold is radically undervalued relative to the size of the U.S. monetary base http://storage.pardot.com/109202/64402/1Q2018_Quarterly_Strategy_Update___Call_Version___Approved.pdf … by
@KLCapital
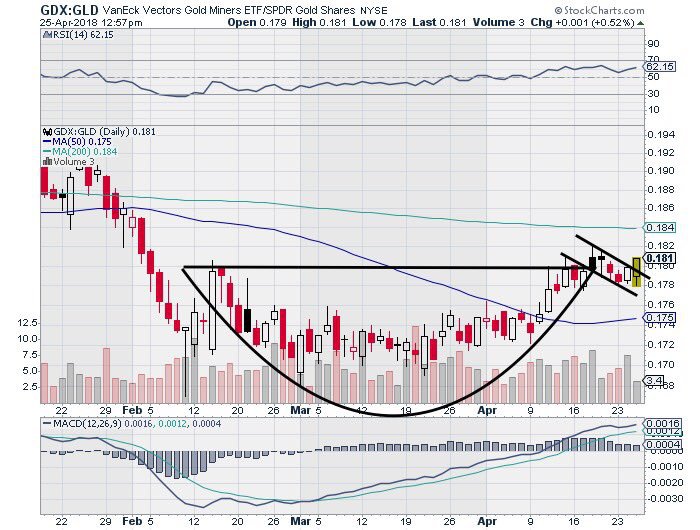 Despite all of the above, Gold just can’t get going. It actually fell 1% this week. What gives?
Send your feedback to editor@macroviewpoints.com Or @MacroViewpoints on Twitter
