Summary – A top-down review of interesting calls and comments made last week in Treasuries, monetary policy, economics, stocks, bonds & commodities. TAC is our acronym for Tweets, Articles, & Clips – our basic inputs for this article.
Editor’s Note: In this series of articles, we include important or interesting Tweets, Articles, Video Clips with our comments. This is an article that expresses our personal opinions about comments made on Television, Tweeter, and in Print. It is NOT intended to provide any investment advice of any type whatsoever. No one should base any investing decisions or conclusions based on anything written in or inferred from this article. Macro Viewpoints & its affiliates expressly disclaim all liability in respect to actions taken based on any or all of the information in this article. Investing is a serious matter and all investment decisions should only be taken after a detailed discussion with your investment advisor and should be subject to your objectives, suitability requirements and risk tolerance.
1.”when facts changed, he changed his mind“
The man who blurted out on October 3, 2018 that “we’re a long way from neutral at this point, probably” formally stated this past Wednesday in his noon speech that the same FF rate is “just below the broad range of estimates of the level that would be neutral for the economy“.
Just as no one paid any attention to his caveat “probably” on & after October 3, no one paid any serious attention to his “broad range of estimates” caveat. They took it as today’s FF rate is just below the neutral rate.
It takes real courage and secure confidence to change one’s mind so totally so publicly. Kudos to Fed Chairman Powell. When facts changed so dramatically, he reversed his decision. What changed though? Rick Rieder of BlackRock said on CNBC Squawk Box on Wednesday morning:
- “If you take the interest sensitive parts of the economy, they are braking markedly. Housing. Small business. Autos. So are we at neutral? You could debate that we’re there today. … I think growth is slowing. I think we’re going to go to 2 percent GDP next year“
More specifically David Rosenberg wrote on Friday:
- Building down the house – As if a huge downturn in the NAHB index and a 8.9% plunge in new home sales weren’t enough, pending home sales dropped in October
- Slower Payroll growth – Yesterday’s initial claims data did little to reverse the recent theme of an increase in the number of layoffs …
Coincidentally on Wednesday,
- BloombergQuintVerified account @BloombergQuint – Global economic growth may be slowing more than forecast only a month ago, warns International Monetary Fund.
OK, Chairman Powell changed his mind. But he hasn’t done anything yet. So what is the big change? The real change is that Powell eliminated tail risk from markets. The October 3 statement had created the frightful specter of 4% FF rate & a high 4-handle Treasury curve. The November 28 statement eliminated that and created the calming aura of a 2-handle belly of the curve, an aura that tells market that draining of liquidity could soon be over.
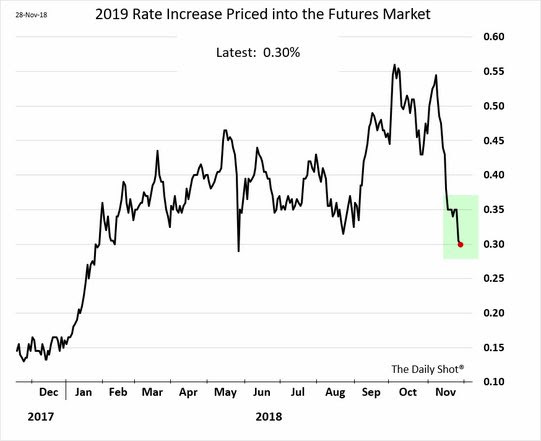
In fact, Rick Rieder of BlackRock said on Wednesday morning that the Fed will stop draining liquidity from markets in July 2019, meaning the Fed will stop reducing their balance sheet in July 2019. The always sensible Julia Coronado said the Fed may take longer pauses between rate increases in 2019. This was not just her opinion but something confirmed by markets in just a day after Powell’s comments:
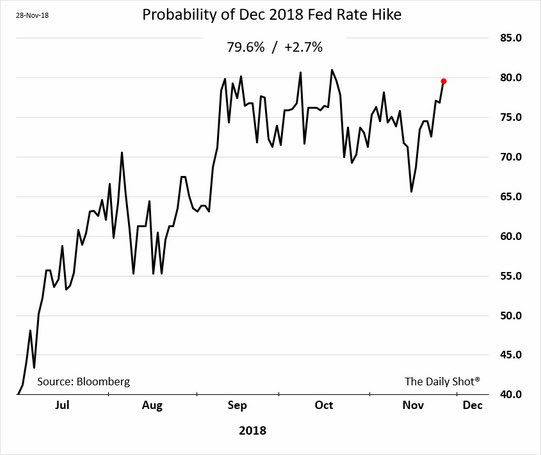
- Liz Ann SondersVerified account @LizAnnSonders Rate hike likelihood remains high for December, but expectations for full-year 2019 have dropped significantly
The Treasury curve seems to have serious doubts about the priced-in December rate hike. Why? Because one segment of the Treasury Curve is virtually near inversion. No, it is not the 10-7 year segment that Rick Santelli expected. It is the 3-2 year segment. The 3-2 year spread closed this week at 1.2 bps. This is a clear signal against raising rates in December. By the way, the 5-2 year spread closed the week at 3 bps.
How big was the Powell statement? Look what happened this week:
- Treasury curve bull-steepened with both 30-10 year & 30-5 year spreads up 4 bps each on the week; High yield ETFs, HYG & JNK rallied by 1% on the week outperforming the 26 bps rally in Treasury ETF TLT; leveraged closed end credit funds, DPG & UTG, closed up 2.8% & 4.5% resp. outperforming unleveraged HYG & JNK; Stock indices had one of their best weeks ever with Dow up 5.2%, S&P 500 up 4.8%, Nasdaq Composite up 5.6% and Nasdaq 100 up 6.5%.
The rally in Credit is important because it reduces credit-induced tail risk for markets. Stable to lower rates along the belly of the Treasury curve could result in greater demand for credit & hence enable robust credit issuance.
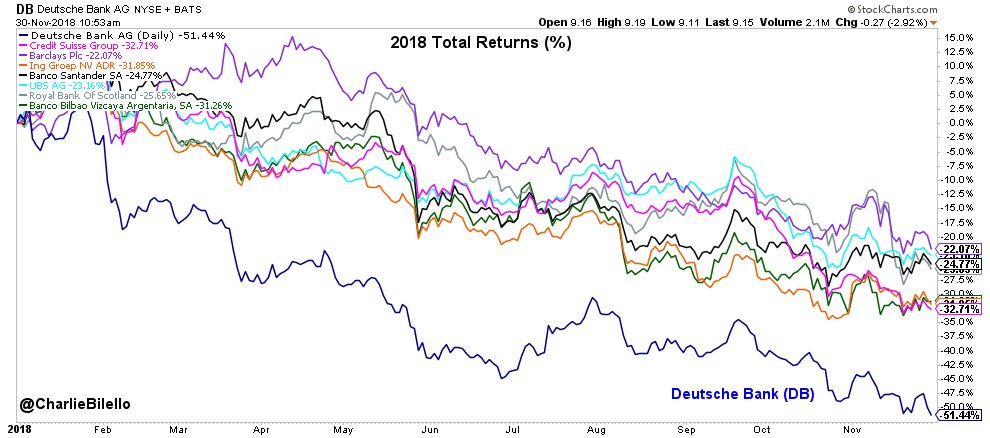
Of course, by credit we mean US credit. Because what is happening in Europe’s financial system is almost ghastly.
- Charlie BilelloVerified account @charliebilello – European banks in 2018… Barclays: -22% UBS: -23% Santander: -25% RBS: -26% BBVA: -31% ING: -32% Credit Suisse: -33% Deutsche Bank: -51%
No wonder US banks are acting badly with Citi, the most global of them all, acting the worst.
We know that Draghi has threatened to stop QE and even raise rates in 2019. If Draghi actually carries out his threats, then US markets will be negatively affected. But can Draghi actually walk the walk in 2019 especially when the EU leadership could be rolling over in mid 2019 amidst the specter of Euro banks virtually collapsing?
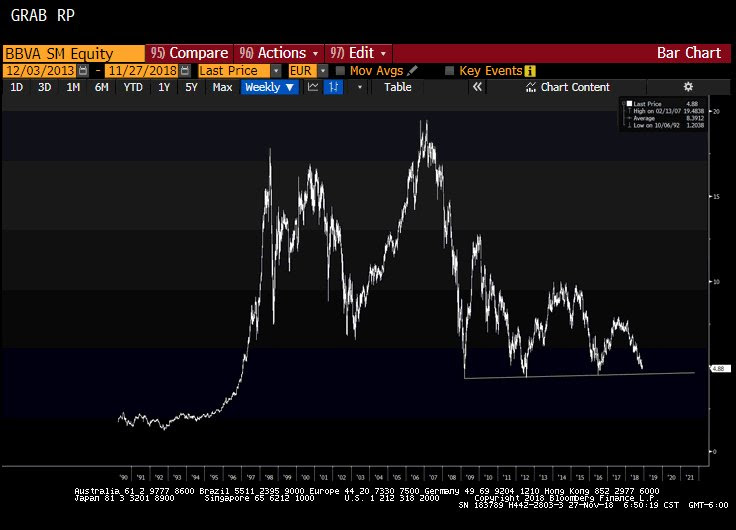
- Raoul PalVerified account @RaoulGMI – BBVA – This bank troubles me. The chart looks truly awful. It has systemic risk in Spain and is of global importance and still has a market cap of Euro 35bn. I know I keep pointing these out but no one is focussed on it….
So is it possible that Draghi backs off of his hawkish talk and we see both the ECB & the Fed switch to a done-draining mode? What could that do to US bond & stock markets with a disinflationary 2% GDP growth rate and a bull-steepening Treasury curve with stable credit?
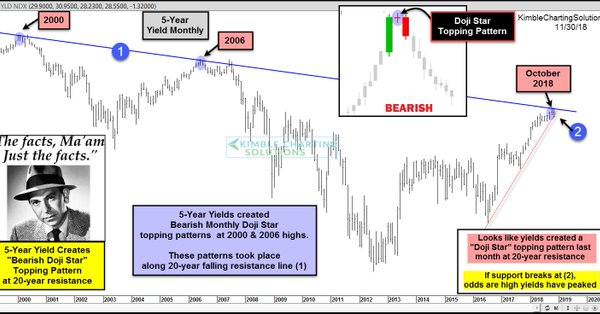
- Chris Kimble @KimbleCharting – Interest rates create bearish Doji star topping pattern at 20-year resistance says Joe Friday
 And what pattern might stock markets be suggesting?
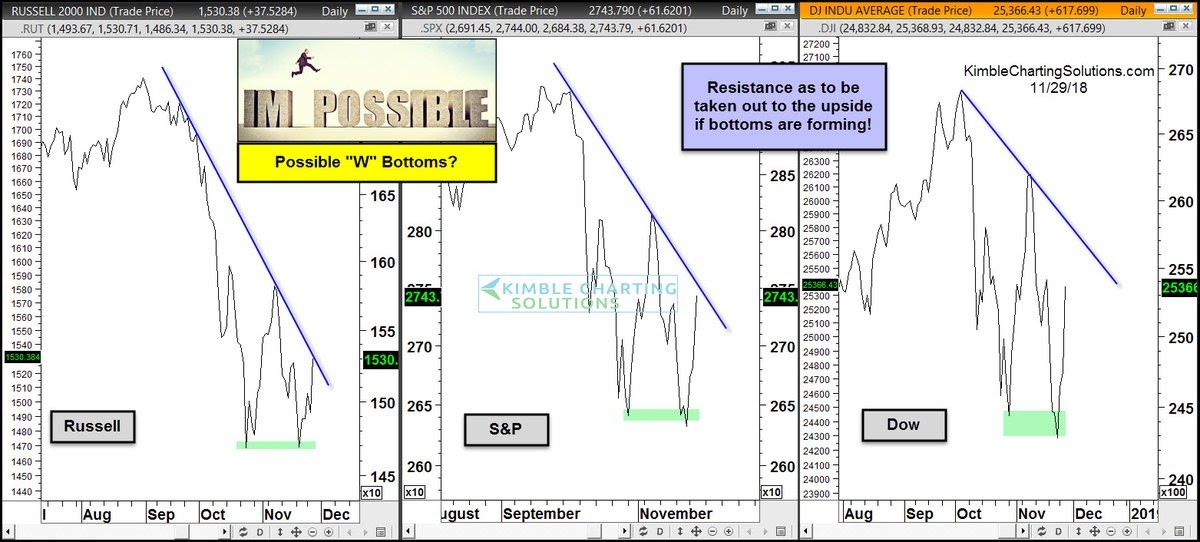
- Chris Kimble @KimbleCharting – Nov 29 – “W” or Double bottoms forming in key indices? Heavy resistance has to be taken out for this to be possible. $SPY $RUT $DIA $QQQ
And many hurdles stand in the way including next week Non Farm Payroll report, the FOMC meeting in December and, more immediately, this weekend’s US-China trade issue.
2. “He said, Xi Said“
The dinner between President Trump & President Xi and the situation it creates next week is totally binary and no one except President Trump really knows what might come out of it. But some smart people saw signs in markets that suggest a bullish result on Monday.
Rick Rieder of BlackRock, the World’s largest & most globally plugged-in asset manager, said on CNBC Squawk Box on Wednesday morning:
- “we have added a risk element to next week; Monday will be a happy day“
David Rosenberg wrote on Friday:
- “A slightly less ebullient tone to end the week, even as signs emerge ahead of the G-20 meeting that trade tensions are being defused“
And,
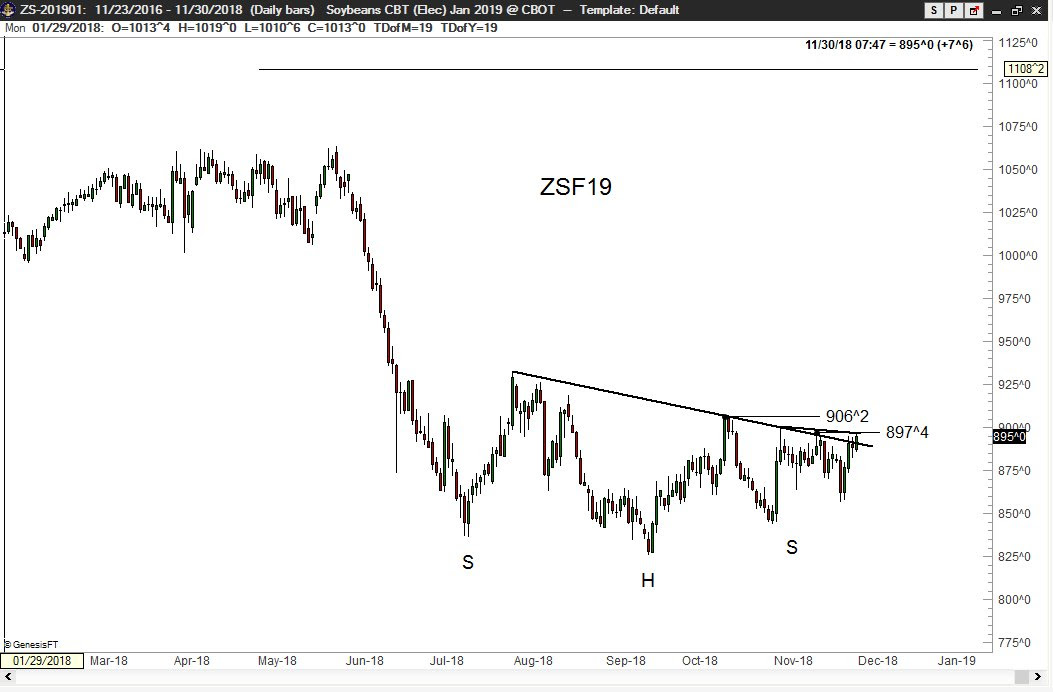
- Peter BrandtVerified account @PeterLBrandt – Good news for the worthy American farmer?? This chart suggests a possibility of a resolve of the Chinese tariff situation. Cash basis at port for Brazilian Beans is on fire. $ZS_F
What about US stocks? Look at the progression of the Net Long position of a smart DeMarkian for the past three days:
- Thomas Thornton @TommyThornton – Current positioning: Equity now net long +13% on the Hedge Fund Telemetry Trade Ideas Sheet.
- Thomas Thornton @TommyThornton Increased net long exposure to +24% today on the Hedge Fund Telemetry Trade Ideas Sheet.
- Thomas Thornton @TommyThornton – Nov 30 – Today’s Hedge Fund Telemetry Daily Note titled “He said, Xi said” was just sent to clients. The Trade Ideas Sheet increased long exposure to 33% net long from 24%
3. US Stocks – Bear Trap &/or Bull Flag?
We think it is a big deal when a long term bull changes into a bear or when a long term bear changes into a bull. Below we discuss the latter.
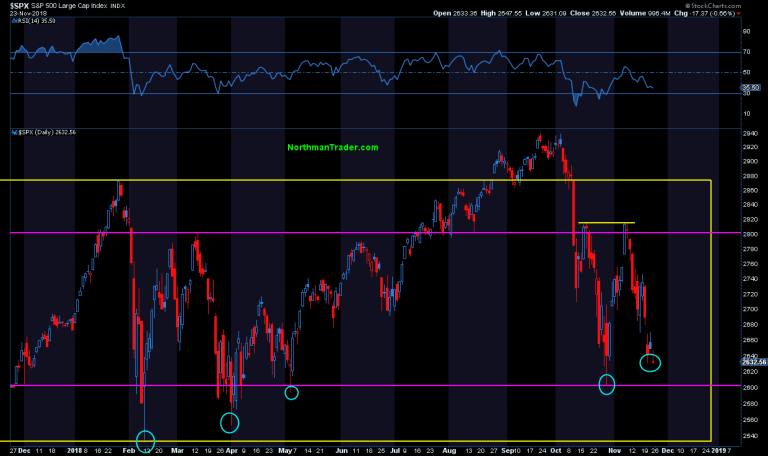
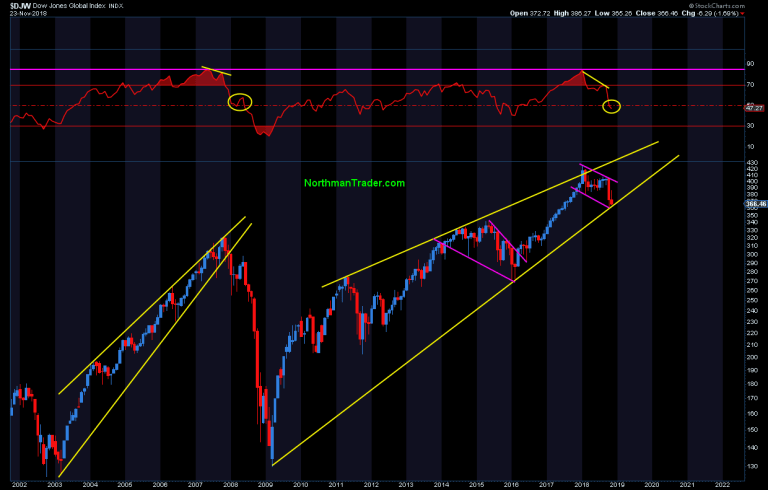
A veteran bear is now warning of a trap for his kind and talking about a bull flag triggering a major rally. We urge all to read the Bear Trap article of Sven Henrich posted on November 25, 2018 on Northmantrader.com. Whether he proves to be right or wrong, the discussion and the charts are very interesting. Below are a couple of excerpts:
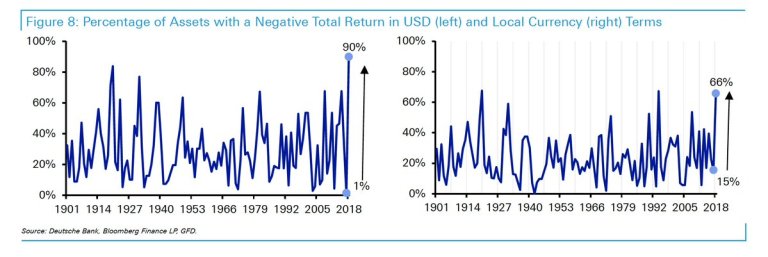
- “currently the year is shaping up to be the worst ever in terms of total asset classes in negative territory, 90% “
- “In short: Bears have taken over everything and are dancing on the corpses of bulls that have mocked them for so long.”
Then he asks:
- “Why haven’t we taken out the lows? I mean, given all this backdrop of global misery and wipe outs in asset classes, why is the $SPX still in range?”
He sees,
- “triggers that could kick in the technical signals that are increasingly abundant suggesting a major rally may be in the works“
So where is the bear trap?
- “The bear trap would be a failure by bears to create a sustained break of the trend line. Indeed, one can see a potential bullish pattern emerging here, that of a bull flag, a bullish pattern not unlike what we also saw in 2016 which was a bullish wedge then“
What about Bonds? He wrote 3 days prior to the Powell speech:
- “Bonds have so far averted the feared breakdown and the yield scare has for now disappeared from the headlines. And maybe, just maybe, the bond market is signaling something other than an economic slowdown, perhaps is it signaling a dovish rate hike to come. Bear trap?“
How does another measure the potential of a rally?
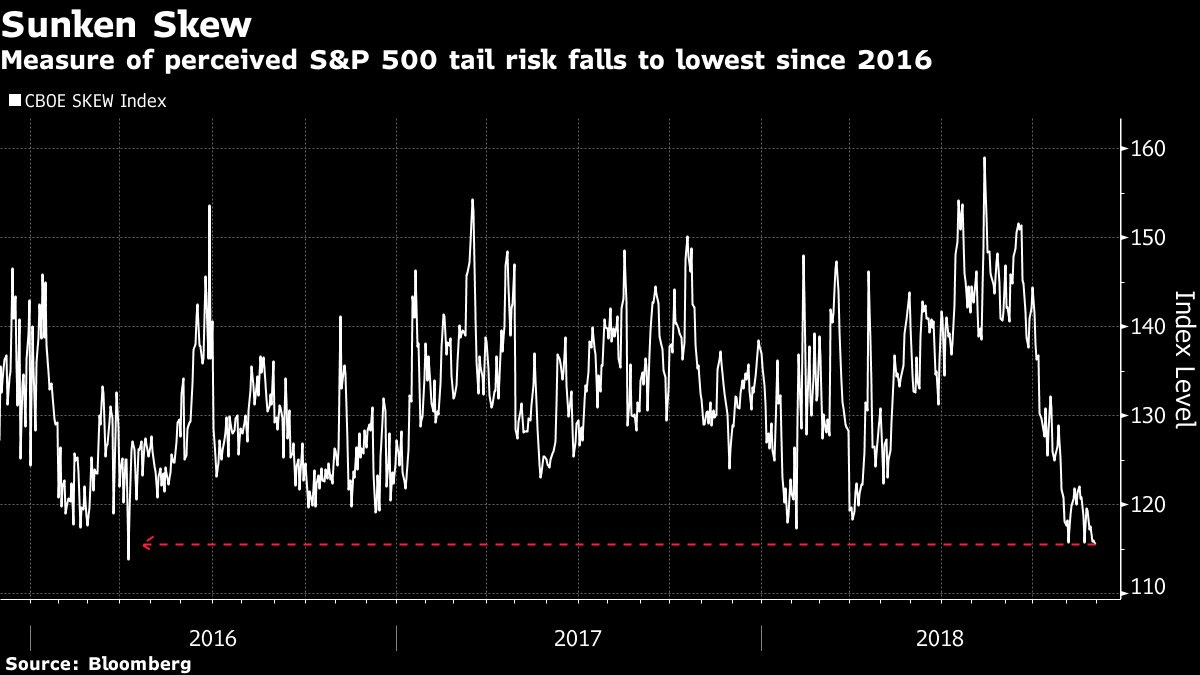
- SentimenTraderVerified account @sentimentrader – Over the past 9 years, the S&P’s annualized return when SKEW was below 120 is +38.9%.
4. EM Stocks
When discussing EM stocks, don’t you have to begin with the Dollar?
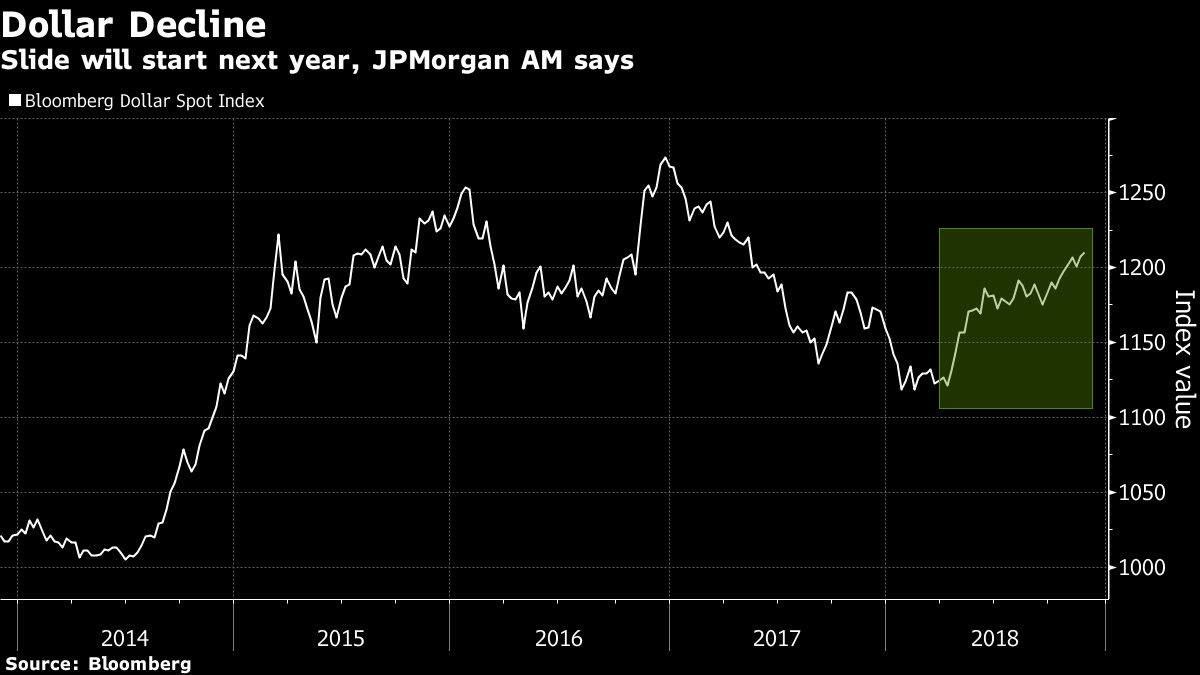
- BloombergVerified account @business – A dollar slump is on the horizon in 2019, and it could last for years, says JPMorgan Asset Management https://bloom.bg/2RdUn0y
Ruchir Sharma of Morgan Stanley Investment Management called the Dollar “very expensive” and said he expects 20% downside in the Dollar over next few years. Conversely he thinks the Mexican Peso is way oversold. He sees an extended period of de-globalization in which previous winner (China) will lose and previous losers, especially Mexico, will benefit a great deal. That is why Mexico is his favorite emerging market. He also likes Vietnam, Indonesia and Malaysia.
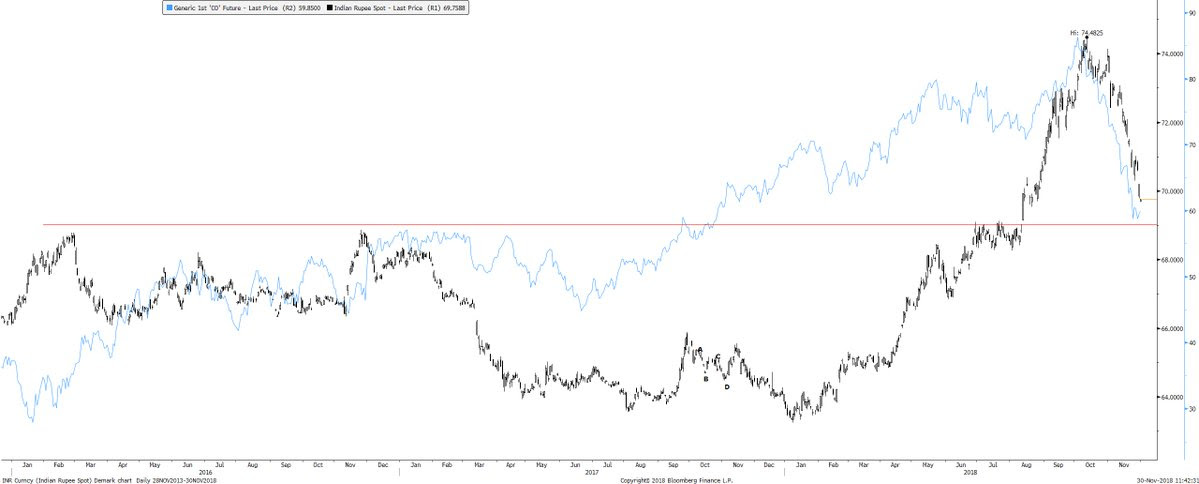
What about Mr. Sharma’s motherland? Business Standard of India reported that the Indian Rupee was up 5.9% in November, its biggest monthly gain since January 2012. Naturally, right?
- Sunchartist @Sunchartist – USDINR correlation to Brent with a leg. Has benefitted tremendously with oil fall Where to next
Not just the fall in Brent but also the fall in US rates. So how has the India Nifty performed?
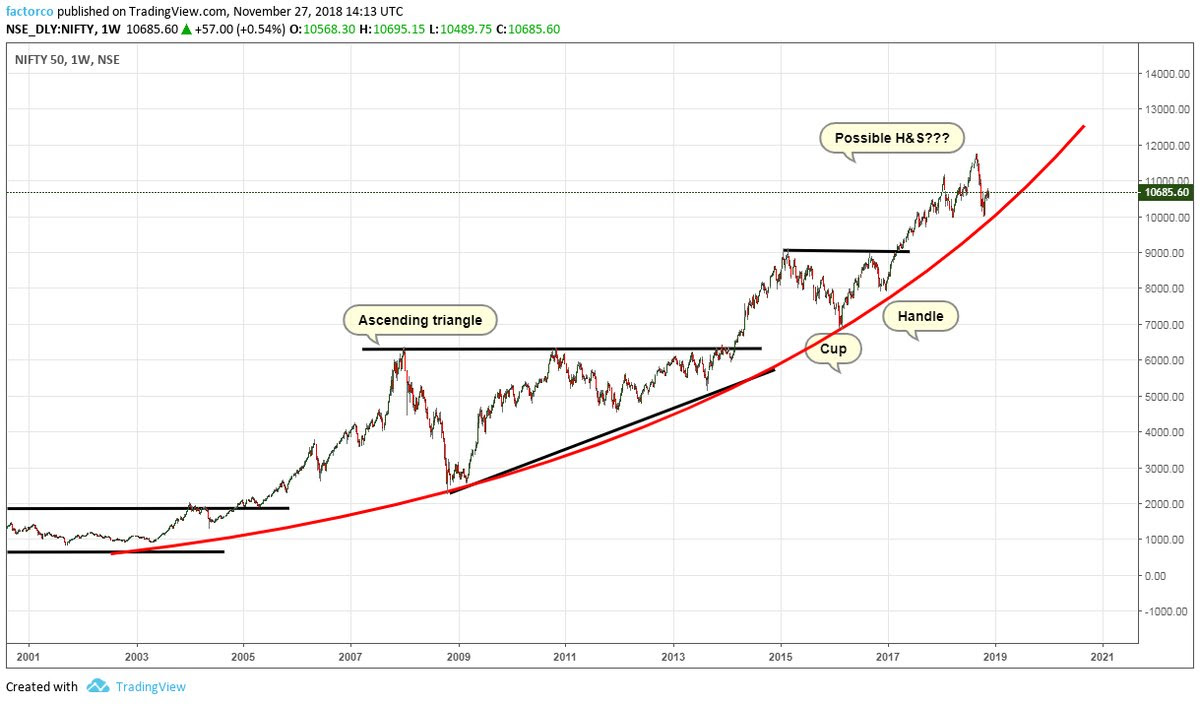
- Peter BrandtVerified account @PeterLBrandt – Nov 27 – The Nifty 50 is an index that loves huge classical charting events. Dominant chart construction remains the parabolic advance. The H&S is not a prediction, but a “what-if” narrative.
5. Kudos to Larry Kudlow
Any one who has watched Larry Kudlow on TV can see what a smart player he is. In an industry with huge egos and intense backstabbing, Larry Kudlow reportedly is liked by virtually all. Jim Cramer and he are probably poles apart. But they were able to jointly produce a show that changed CNBC’s post market franchise for ever. And it seems Jim Cramer and he genuinely like each other, another rare commodity in the TV business.
As Presidents Trump & Xi sit down to a dinner with both geopolitical & market impact, we can’t help admiring how Larry Kudlow has succeeded in the Trump Administration. If you notice, no one makes a public snide comment about him, a rarity in an administration in which negative comments fly with abandon. We don’t know of course but it seems from the outside Kudlow’s ability to get liked despite his opposing views has stood him in good stead.
That reminds us of our CNBC Moment of the Week of July 3 – July 9, 2010. At that time, Larry hosted a CNBC show with Melissa Francis & Trish Regan (both now at Fox Business). We described that moment thus on July 10, 2010:
- “Melissa Francis returned to The Call this week and in just a couple of days, we saw the result – A beaming Larry Kudlow flanked by Melissa Francis & Trish Regan playing up to him. It was such a picture that a cult Bollywood song instantly flashed to our mind. The opening words of the immortal hit Huzur E Wala (from 1966) are a perfect description of the montage of Larry Kudlow in the middle with Melissa & Trish gazing at him from both sides (on Thursday July 8 morning at about 11:34 am, as we recall):”
Below is that Huzur E Wala clip, a clip that all three of them enjoyed at that time (based on very rare feedback from CNBC folks). A rough translation of the opening verse is:
Big Guy,
With Your Permission,
We would reveal to the entire World that,
We love Your Style
& We are not scared to admit it publicly?
https://www.youtube.com/watch?v=-6ym4uOOtEo
Send your feedback to editor@macroviewpoints.com Or @MacroViewpoints on Twitter
