Summary – A top-down review of interesting calls and comments made last week in Treasuries, monetary policy, economics, stocks, bonds & commodities. TAC is our acronym for Tweets, Articles, & Clips – our basic inputs for this article.
Editor’s Note: In this series of articles, we include important or interesting Tweets, Articles, Video Clips with our comments. This is an article that expresses our personal opinions about comments made on Television, Tweeter, and in Print. It is NOT intended to provide any investment advice of any type whatsoever. No one should base any investing decisions or conclusions based on anything written in or inferred from this article. Macro Viewpoints & its affiliates expressly disclaim all liability in respect to actions taken based on any or all of the information in this article. Investing is a serious matter and all investment decisions should only be taken after a detailed discussion with your investment advisor and should be subject to your objectives, suitability requirements and risk tolerance.
1.Economy, Confidence & the R-word?
This was the week in which Fed Chairman Powell & Fedhead Bullard tried to become hawkish & tried to take back some of the easing built in by the markets. Was that just trying desperately to show they are not capitulating before President Trump or do they have a real reason to show they are less dovish than the markets assume?
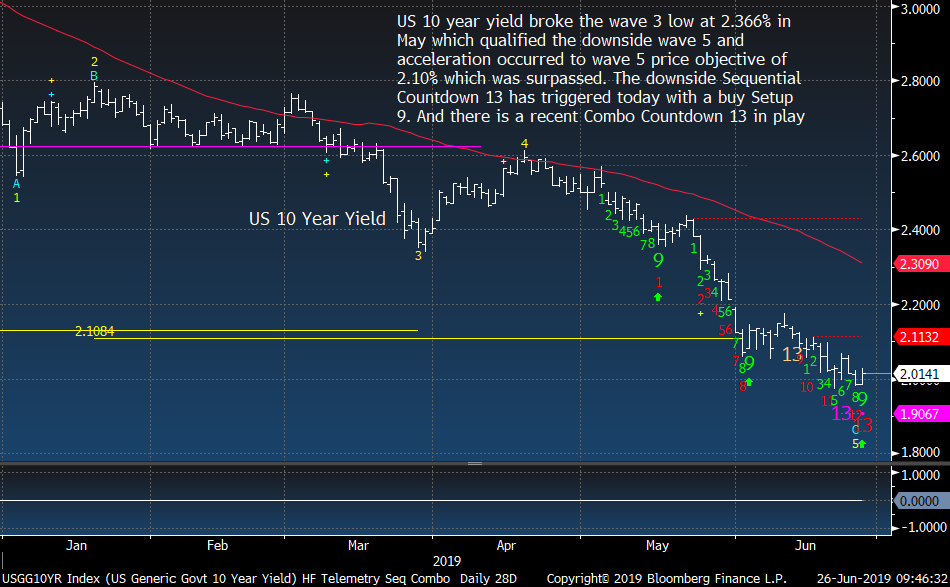
We all know the end result of this week – the entire Treasury curve fell in yield with the 30-yr & 10-yr yields falling by 5.6 bps, the 5-year yield falling by 3.2 bps & the 3-yr & 2-yr yields falling by 2 bps.
So what did the bond market see that the Fedheads could not?
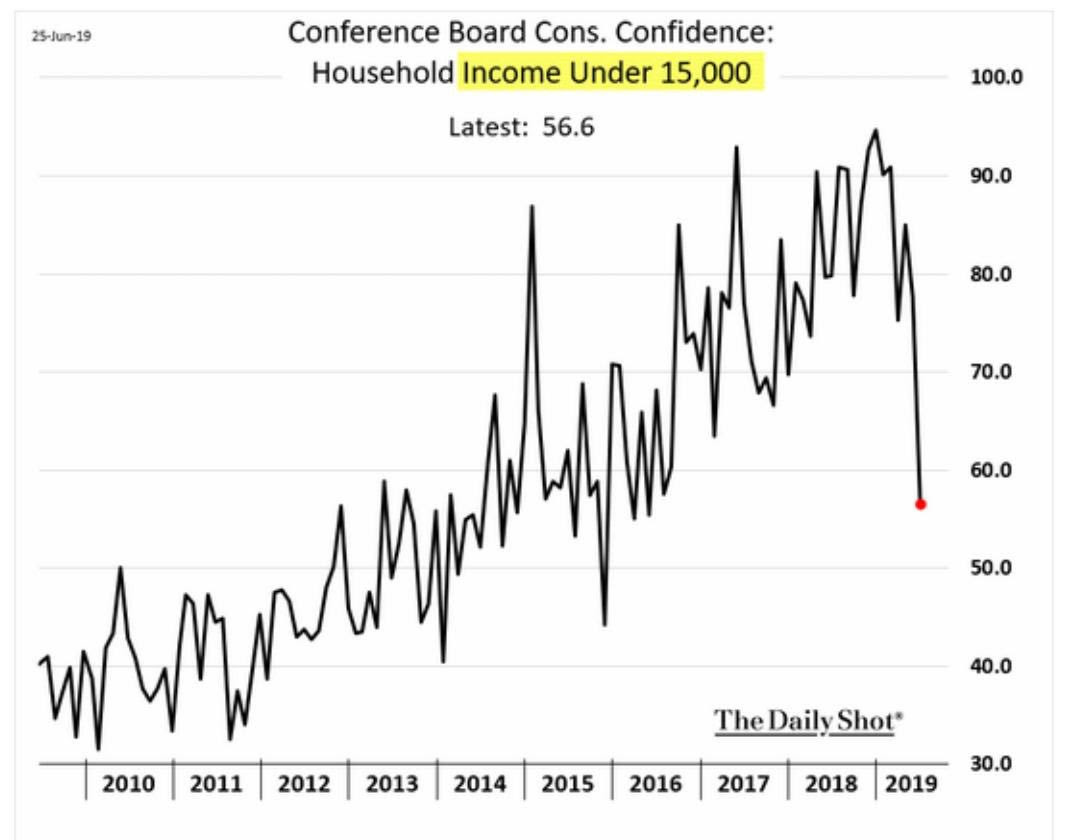
- jeroen bloklandVerified account@jsblokland– Yikes! Consumer confidence of low-income households in the US has collapsed. #notgood ht @SoberLook
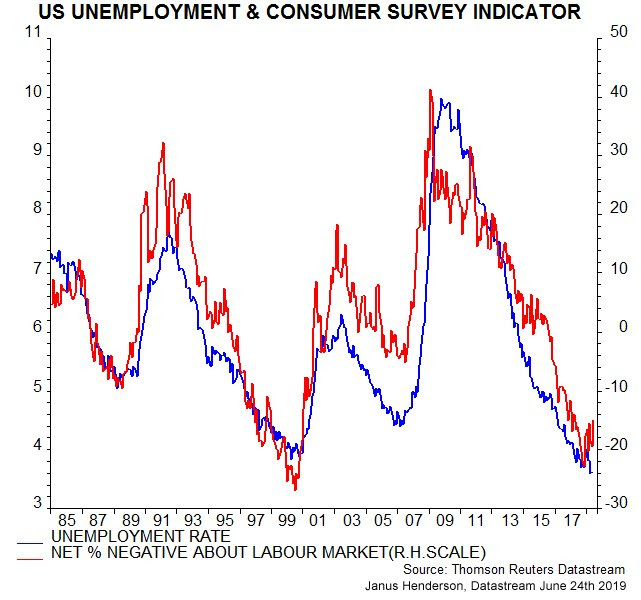
Could this possibly be due to employment trends?
- Jenna & John@StrategicBond – US employment outlook continues to darken: Conference Board labour market indicator suggests turn is in…
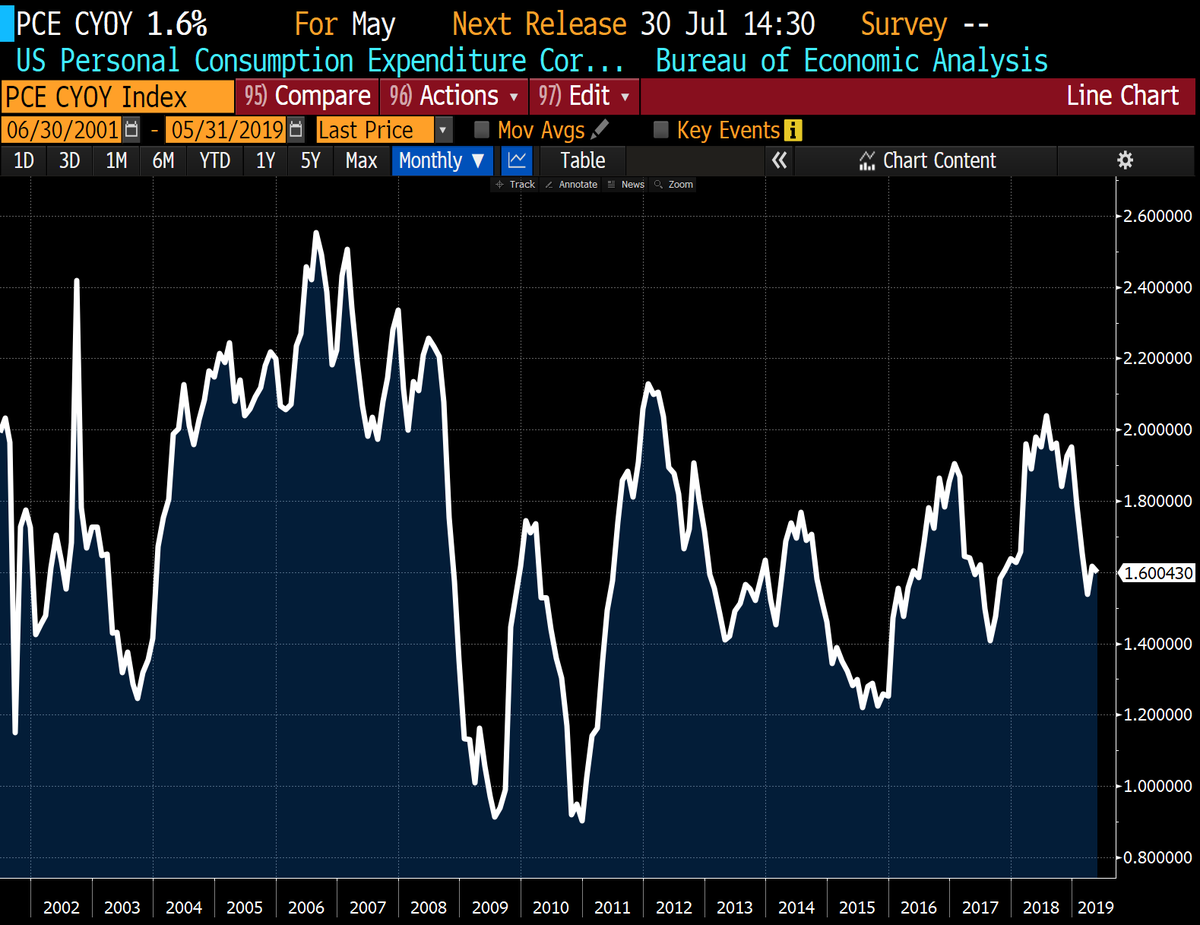
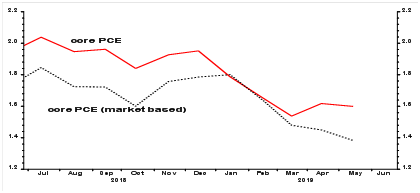
- jeroen bloklandVerified account@jsblokland – US Core #PCE deflator 1.6%!
But is this 1.6% a markets driven number or a number with stuff loaded into it?
- Albert Edwards@albertedwards99 – US core PCE looks as if it has stabilized around 1.6% yoy over the last 3 months, soothing deflation fears. But just look at “market based” core PCE (ie excluding made up items). It’s still heading downwards quickly and now only 1.4%. (See table 11, https://www.bea.gov/system/
files/2019-06/pi0519.pdf… )
 While the Fed ignores the reality & keeps looking inwards at how it “independent” it appears, the Treasury curve keeps spelling the R-word:
- Jim Bianco@biancoresearch – The 10-year/3mo curve has been inverted 20 consecutive days. 5-year/3mo now over 3 months. Both are long enough to say damage is being done and recession probabilities are rising.
But can anyone see the R-word in any data?
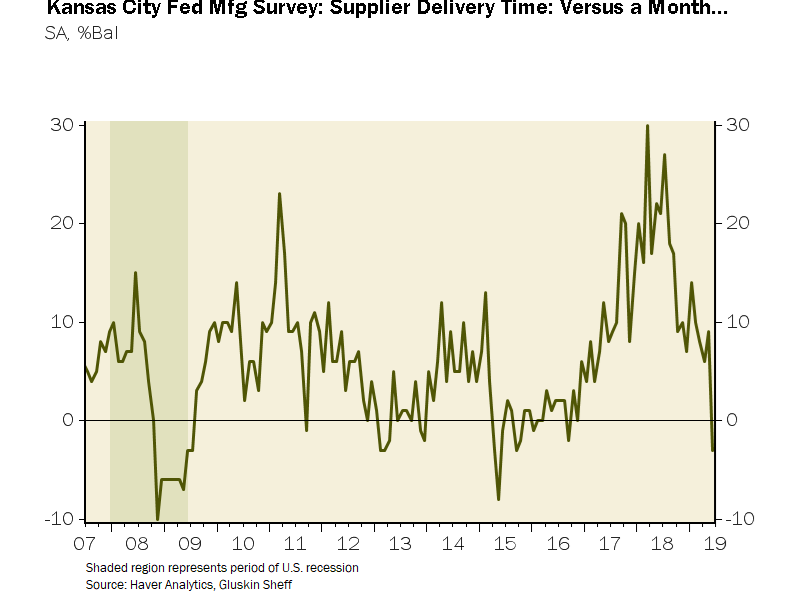
- David Rosenberg@EconguyRosie – Yet another recession-like metric. The Kansas City Fed manufacturing survey sagged to a 31-month low in June; and what is really disturbing is the sharp slide in vendor delivery delays to its most contractionary level since September 2015.
So what are the Fedheads thinking? Dallas Fed President Kaplan alluded to it on Monday & BTV’s Lisa Abramowicz documented it on Friday:
- Lisa AbramowiczVerified account@lisaabramowicz1 – High-yield bond sales surged this month to the highest since September 2017. This year’s total issuance of about $130 billion is 18% higher versus the same period last year.
No wonder the Fed is worried about creating a high yield issuance bubble if it lowers the Fed Funds rate by 50 bps or even by 25 bps. So their preferred solution is push the U.S. economy towards recession & thereby leading credit managers to sell credit now. Brilliant, right?
Brilliant or not, a smart money manager like Bob Michele of JPMorgan Asset Management’s head of global fixed income is now a seller of credit on strength instead of his earlier posture of buying on weakness:
- This is the first time since the financial crisis where we’re actually looking systematically to sell on strength rather than to buy on weakness.
- The probability of recession keeps rising. The data doesn’t look that great. And on the trade front, it feels as though corporate confidence has been damaged already, and it’s making it difficult for companies to do any sort of capital expenditure planning because of the potential impact to the global supply chain. For us, we’ve ridden high yield and credit for a long time. It’s time to take some profits and look to rotate into higher-quality fixed income.
- You’ve got a Fed that is actually seeing troubling things, and they’re responding to that. They’ve now seen a decade pass where they’ve been unable to create inflation expectations. They’re trying to cushion the downside from all of that.
- I don’t know that that’s great for credit. It’s not a robust picture — companies have added a lot of leverage. If a recession hits over the next 12 months or so, our expectation is that default rates, which are below 2%, reach 5% or even 8%. The market seems pretty complacent as things are visibly slowing down.
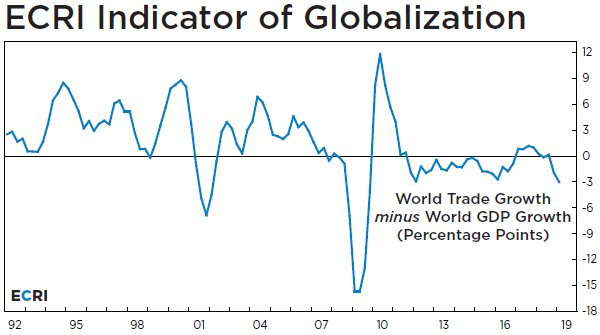
When a 10-year bull turns into a bear, we need to take note. Also for those who are still focused on trade deals, or more precisely positive words about trade deals, the long term trend may have passed by all that:
- Lakshman AchuthanVerified account@businesscycle – De-globalization has been happening for much of this decade, as its roots run much deeper than the trade war. So, while a resolution to trade disputes would be welcome, de-globalization will continue. #G20
 http://bit.ly/2JbdXrD
 After all of the above, is there any good news or should people buy expensive razor blades to slit their wrists when the time comes? First a good news from the 10-year bull now turned into a bear on credit.
- Bob Michele of JPMorgan Asset Management – The one area that people are surprised to learn we still have confidence in is the banks globally. Under the regulatory framework of the last decade, banks look pretty well reserved to us and in far better condition than going into any previous downturn that I can remember — and I’ve been doing this for 38 years, so my memory goes back a long way.
Well 38 years covers both 2008 & 2000 and that’s a good thing. The second is what the truly & true old master said about the upcoming recession that might actually be here already:
- Gary Shilling to Real Vision – it’d [recession] would probably be a run of the mill affair which means real GDP would decline 1.5% – 2% not the 3.5%-4% decline you had in the serious recession
2. Stocks & G-20
First, as Jeff Hirsch of Stock Trader’s Almanac, said on CNBC – “1st trading day of July is the best trading of the year with 85% probability“. Second from Market Ear,
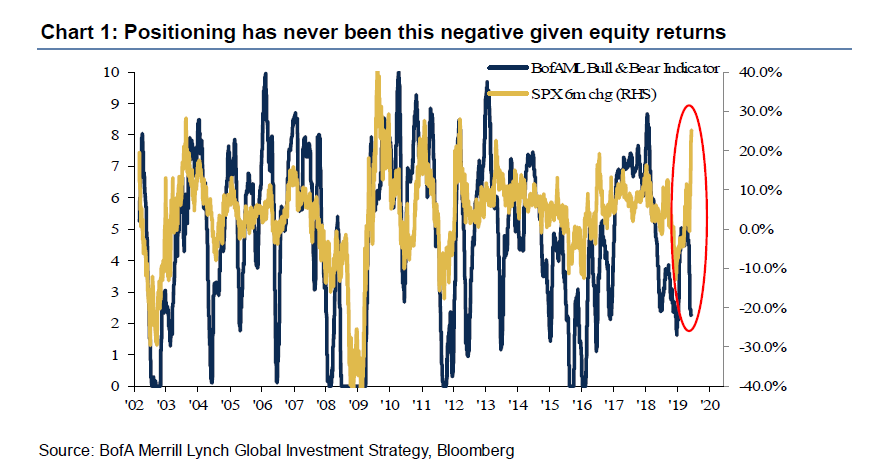
- pain trade is very much up; positioning has never been this negative amidst such strong equity & credit returns. we still think “pain trade” is very much up so long as recession & trade war escalation avoided.
The intermediate term looks OK provided support holds & volatility doesn’t spike, according to Lawrence McMillan of Option Strategist:
- Equity-only put-call ratios remain strongly on buy signals. Their downward trajectory was not even fazed this week, as they held steady to their buy signals even while $SPX corrected a bit.
- Market breadth continues to dance back and forth without getting extremely overbought or oversold. At this point, both oscillators are on buy signals.
- $VIX has remained at somewhat elevated levels without actually turning bearish. So, as long as $VIX stays below 17, the stock market can still rise without concerns from volatility.
- The intermediate-term outlook remains generally bullish as long as $SPX holds above support [2890-2900] and $VIX does not break out to the upside.
On the other hand,
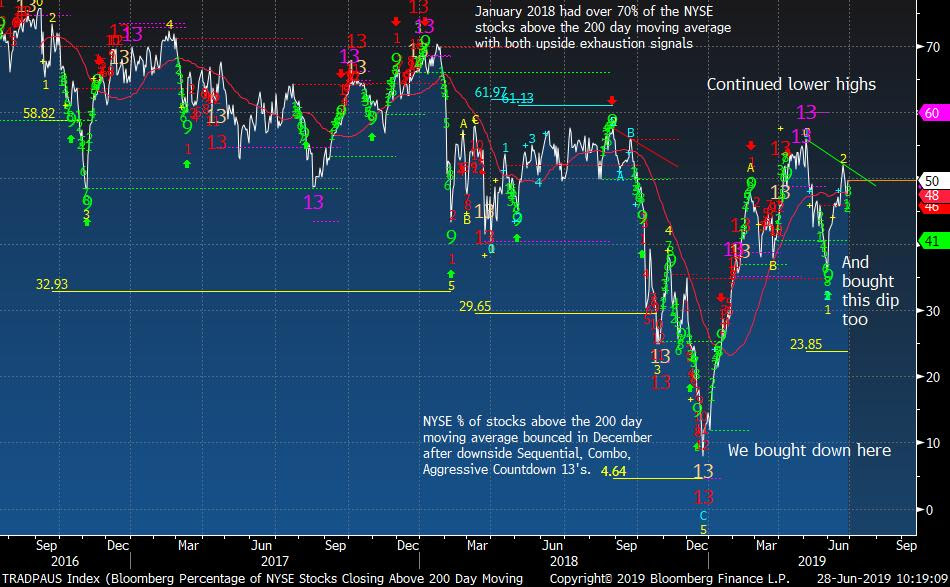
- Thomas Thornton@TommyThornton – NYSE percentage of stocks above the 200 day moving average continues to make lower highs.
And now the bad news:
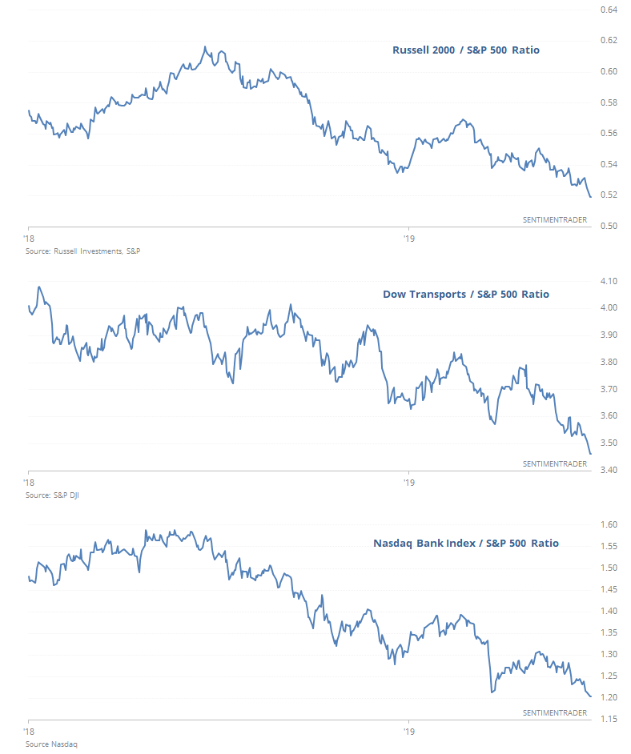
- SentimenTraderVerified account@sentimentraderWithin days of the S&P 500 hitting a new high, the following all collapsed to a relative low: * Small caps * Transports * Banks This has happened twice in 40 years, both leading to a 15% drop in the S&P w/in 2 months.
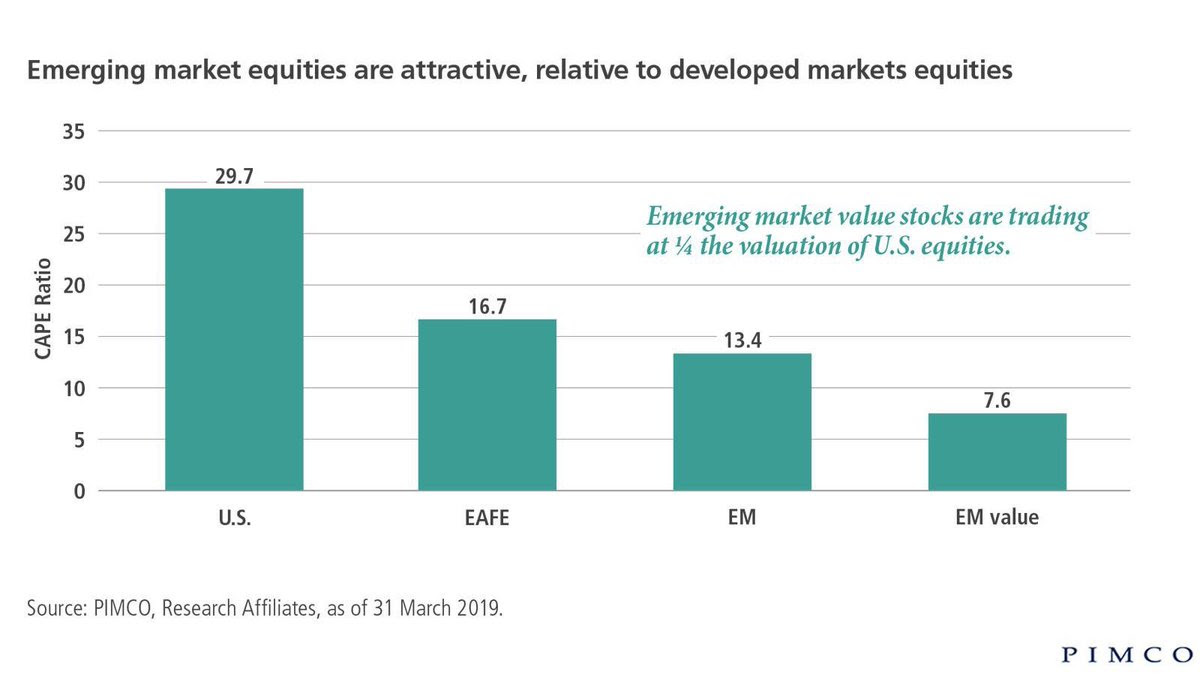
So what is a good trade in equities? In a graphic that would make Morgan Stanley’s Ruchir Sharma proud,
- jeroen bloklandVerified account@jsblokland – EM stocks for the long run? The cyclically adjusts #PE, or #CAPE, of EM equities is massively lower than that of US equities! Chart via @PIMCO
 And the same Sentiment Trader, who warned of a 15% decline in S&P in 2 months, wrote in their article Wall Street isn’t keeping up,
- “The McClellan Summation Index for emerging markets is above to climb above zero, showing that stocks’ momentum underlying the index is improving. The EEM fund has returned an annualized 19.8% when the Summation Index is above zero, and the Backtest Engine shows that when it crosses above zero, EEM was positive three months later 26 out of 36 times.”
3. Treasury Bonds
We do wonder whether U.S. stocks can rally hard without Treasury bonds selling off some. Not selling off hard as they would if the data turns strong & Fed gets hawkish in action but rates could rise just a bit to get above the brink line.
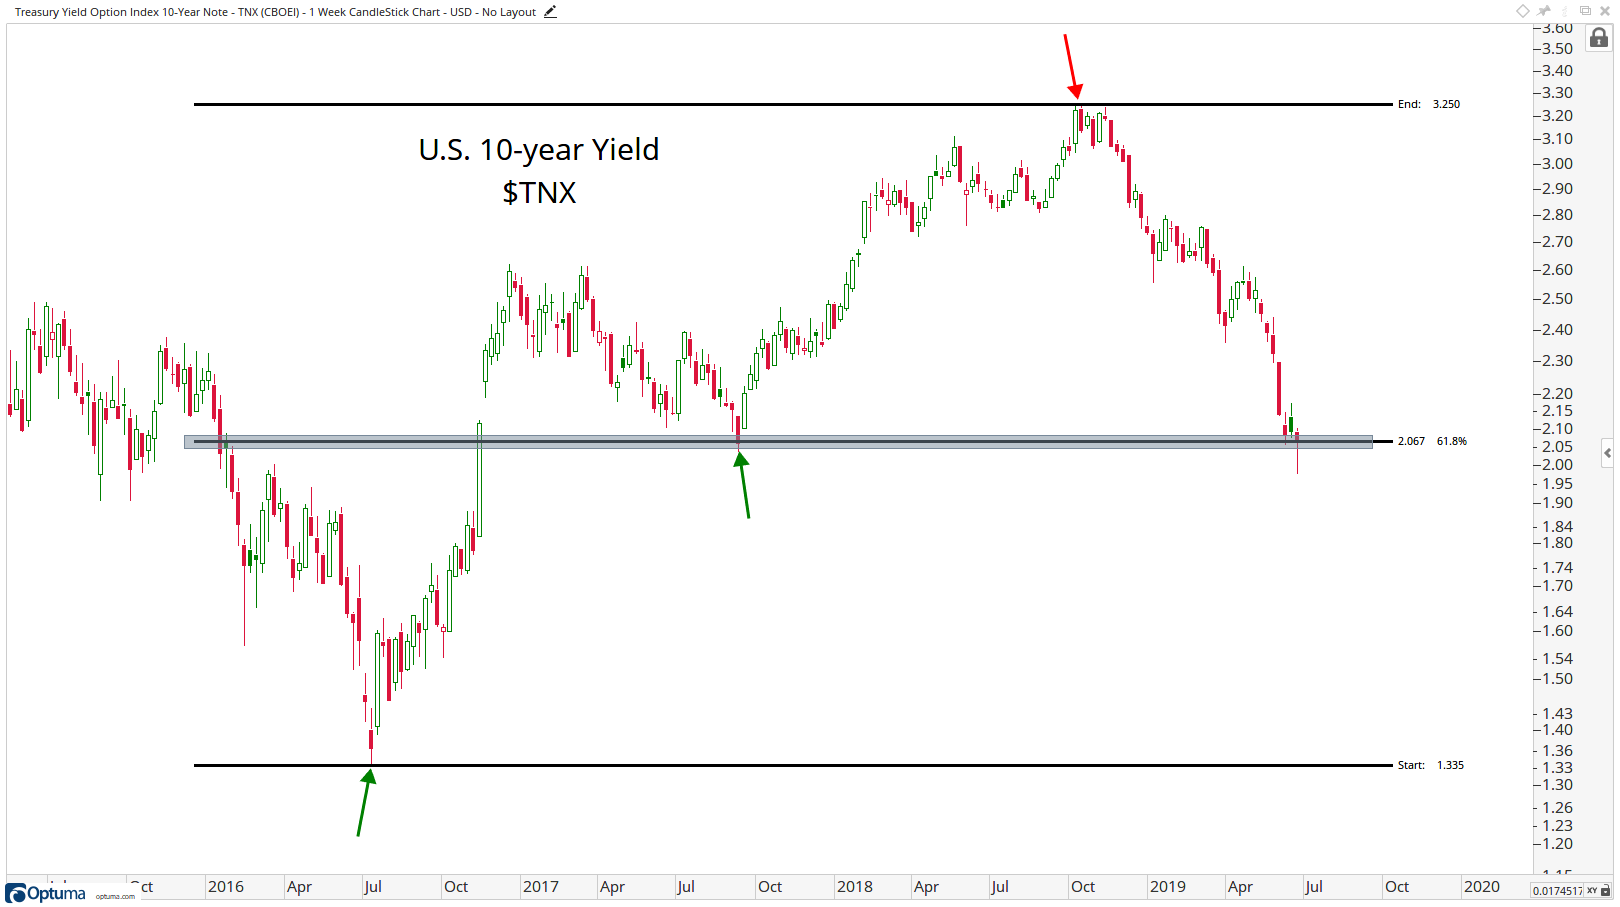
That line is 2.06% on the 10-year Treasury & the $131.50 level on TLT, as J.C. Parets describes in this article US Bond Market Flirts With Critical Levels:
- You’ll also notice that this 2.06 level represents the 61.8% retracement of the entire move higher since 2016. This was the start of an epic move in rates. We have now retraced a perfectly logical portion of that. If this level fails to hold, the downside is serious. We can see rates back under 1.40 potentially, in that scenario.
- Here is the most liquid Treasury Bond ETF $TLT. It’s basically the rates chart above, but flipped upside down. We have now retraced exactly 61.8% of the entire decline from the 2016 high down to last year’s lows. I’m watching 131.50 here the same way I’m watching 2.06% in the chart above
And then you have the clear trade:
- Thomas Thornton@TommyThornton – Here’s my @realvision trade idea “Short Bonds”
Despite the above charts, next week’s data, especially next Friday’s Non Farm Payroll Report, will decide what happens to Treasury Bonds & Interest Rates.
4. Abe at G20, Quad, Pompeo & India
You know what the Quad is right? It stands for a quadrilateral body of Indo-Pacific States – America, Australia, India & Japan. While it is not against any specific country, see how a picture of the Abe hosted dinner tells the real story.
- Jeff M. Smith@Cold_Peace_– Jeff M. Smith Retweeted All India Radio News – Abe, you sly dog. Seating the Quad together [Morrison, Modi, Trump, Abe] , directly across from Xi.
Before the G20, Secretary of State Pompeo visited India for a sit down meeting with Indian Foreign Minister JaiShankar. Mr. JaiShankar said at their press conference that they [Pompeo & he] “earned their pay today“. Pompeo put the trade differences between US & India in proper perspective:
- Dhruva JaishankarVerified account @d_jaishankar – Pompeo, earlier in the day: “[T]he press is always going to write about the noise. It’s the story, it’s the moment. It doesn’t capture the full range and scope of the [India-U.S.] relationship.”
And the real reality was stated succinctly by Mr. Pompeo:
- Dhruva JaishankarVerified account@d_jaishankar – Mike Pompeo: there is a “new age of ambition” for our two nations.
That doesn’t mean the economic/trade tensions are not real. But they are manageable. Listen to Secretary Pompeo in the clip below:
Send your feedback to editor@macroviewpoints.com Or @MacroViewpoints on Twitter
