Summary – A top-down review of interesting calls and comments made last week in Treasuries, monetary policy, economics, stocks, bonds & commodities. TAC is our acronym for Tweets, Articles, & Clips – our basic inputs for this article.
Editor’s Note: In this series of articles, we include important or interesting Tweets, Articles, Video Clips with our comments. This is an article that expresses our personal opinions about comments made on Television, Tweeter, and in Print. It is NOT intended to provide any investment advice of any type whatsoever. No one should base any investing decisions or conclusions based on anything written in or inferred from this article. Macro Viewpoints & its affiliates expressly disclaim all liability in respect to actions taken based on any or all of the information in this article. Investing is a serious matter and all investment decisions should only be taken after a detailed discussion with your investment advisor and should be subject to your objectives, suitability requirements and risk tolerance.
1.Happiness abounds but too early?
Last week we wondered whether the end of the uncertainty trident would prove bearish or bullish for the stock market. They answered clearly with a terrific week in the stock market. Except for a tiny negative close on Wednesday, the indices closed positive every day. In fact, Nasdaq & NDX closed up every day regardless of what interest rates did or what the Dollar did. The Dow closed up 1.1%; S&P up 1.6% & NDX up 2.2% . Russell 2000 also closed yo 2.2% on the week.
The relentless upward move began generating sell signals from several smart folks. Jim Cramer pointed out that the S&P oscillator he uses hit am overbought +5 which suggests selling or at least not buying more. Tony Dwyer began murmuring about a pullback. Some were direct:
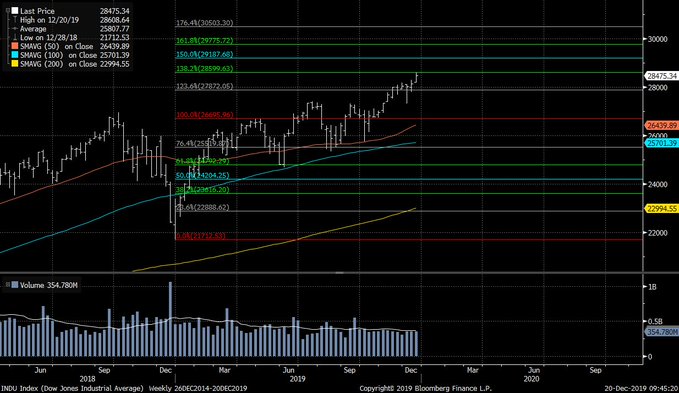
- Lawrence McDonald@Convertbond – Sell Signals: Dow Jones Industrial Average Fibonacci level reached — the 138.2% line = 28,600…
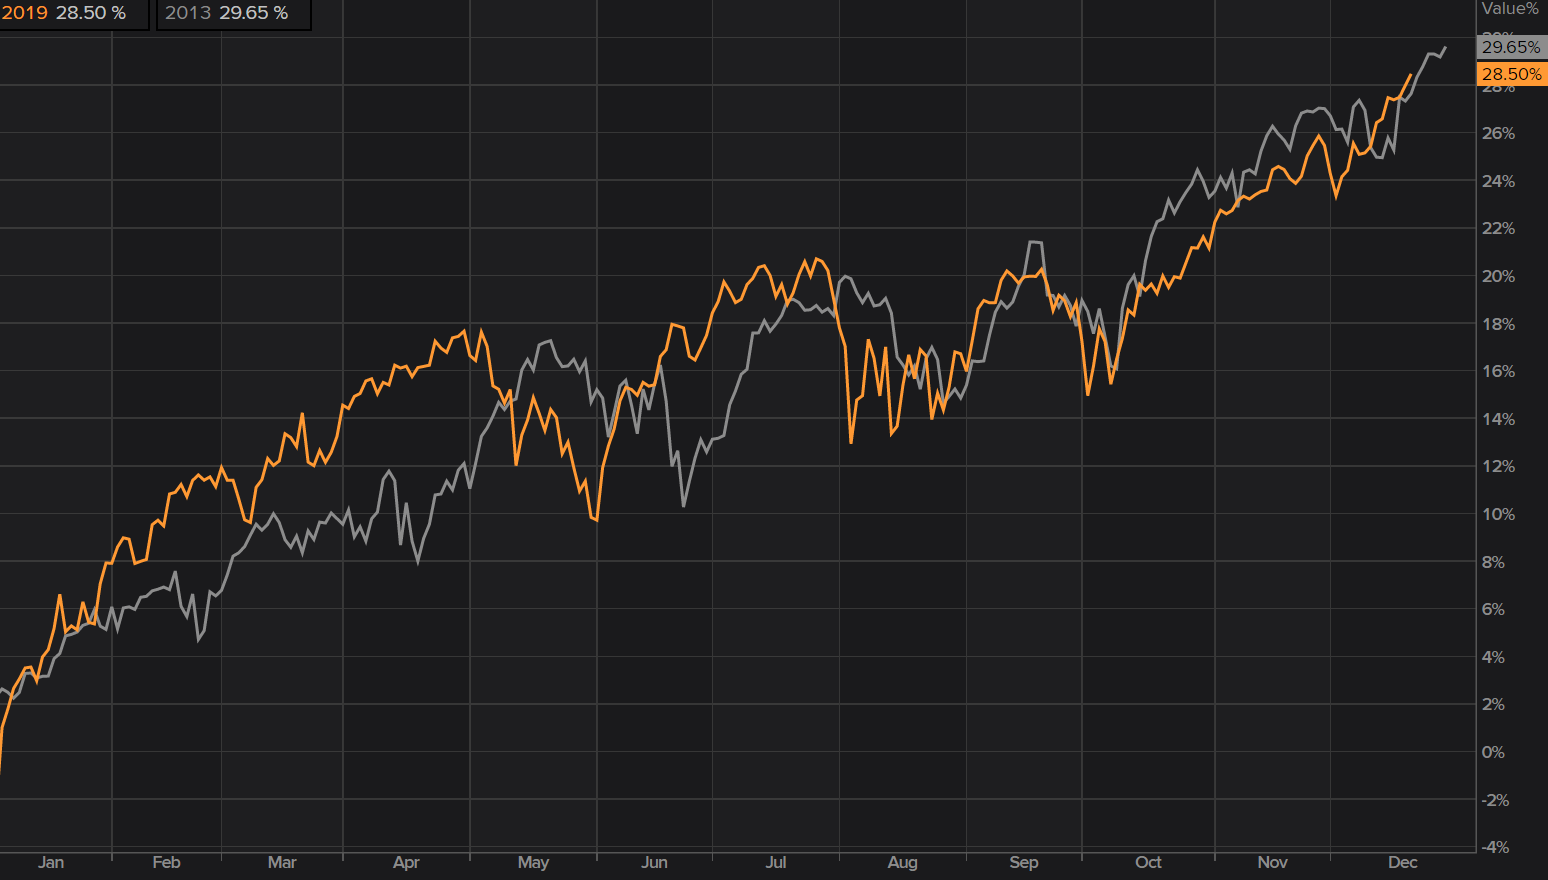
Even the consistent advocates of 2013 parallel chose discretion over valor on Friday:
- Market Ear – Time to fade the perfect trade? The 2013 analogy has continued giving and giving. Chasing the last percent seems like a late trade. Time to move on.
Also this rally is only one higher S&P close away from both 1999 & 2013.
- Ryan Detrick, CMT@RyanDetrick – Today will be the 6th new all-time high for the S&P 500 in December. Somewhat surprisingly, 7 (most recently in 1999 and 2013) is the most this most bullish month of the year has seen since 10 back in December 1954.
But wait a minute. The Santa Claus rally has not even begun & will not begin till Tuesday. As Jeffrey Hirsch of Stock Trader’s Almanac explained on CNBC Worldwide Exchange on Friday, this rally is a 7-day event with 5 finals days in 2019 & first 2 days in 2020. So if the above sell recommendations prove correct, then we will not have a Santa Claus rally in 2019.
Is it really possible this glorious 2019 would end with such a whimper? And, as Mr. Hirsch reminded viewers, “if the Santa Claus rally should fail to call, then Bears may come to Broad & Wall“.
Of course, we could see a sharp sell off early next week & then see a strong rally post Christmas to satisfy both camps. Frankly, the real problem for many investors is the tussle between an intense desire to not sell until 2020 to avoid taxes and a deep fear of being caught holding the bag as others sell before year-end.
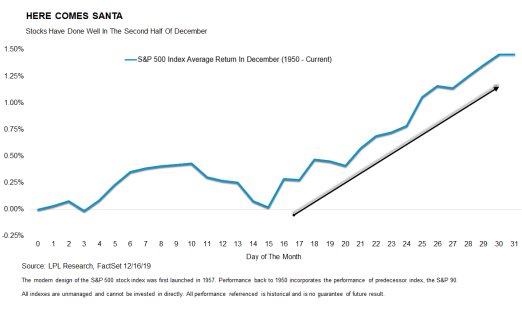
On the other hand, you have the statistical case of December returns getting realized in the latter third of the month:
- LPL Research@LPLResearch – –Is It Time For Santa? ow.ly/Xbwp50xClwC insights from @RyanDetrick #LPLChartOfTheDay
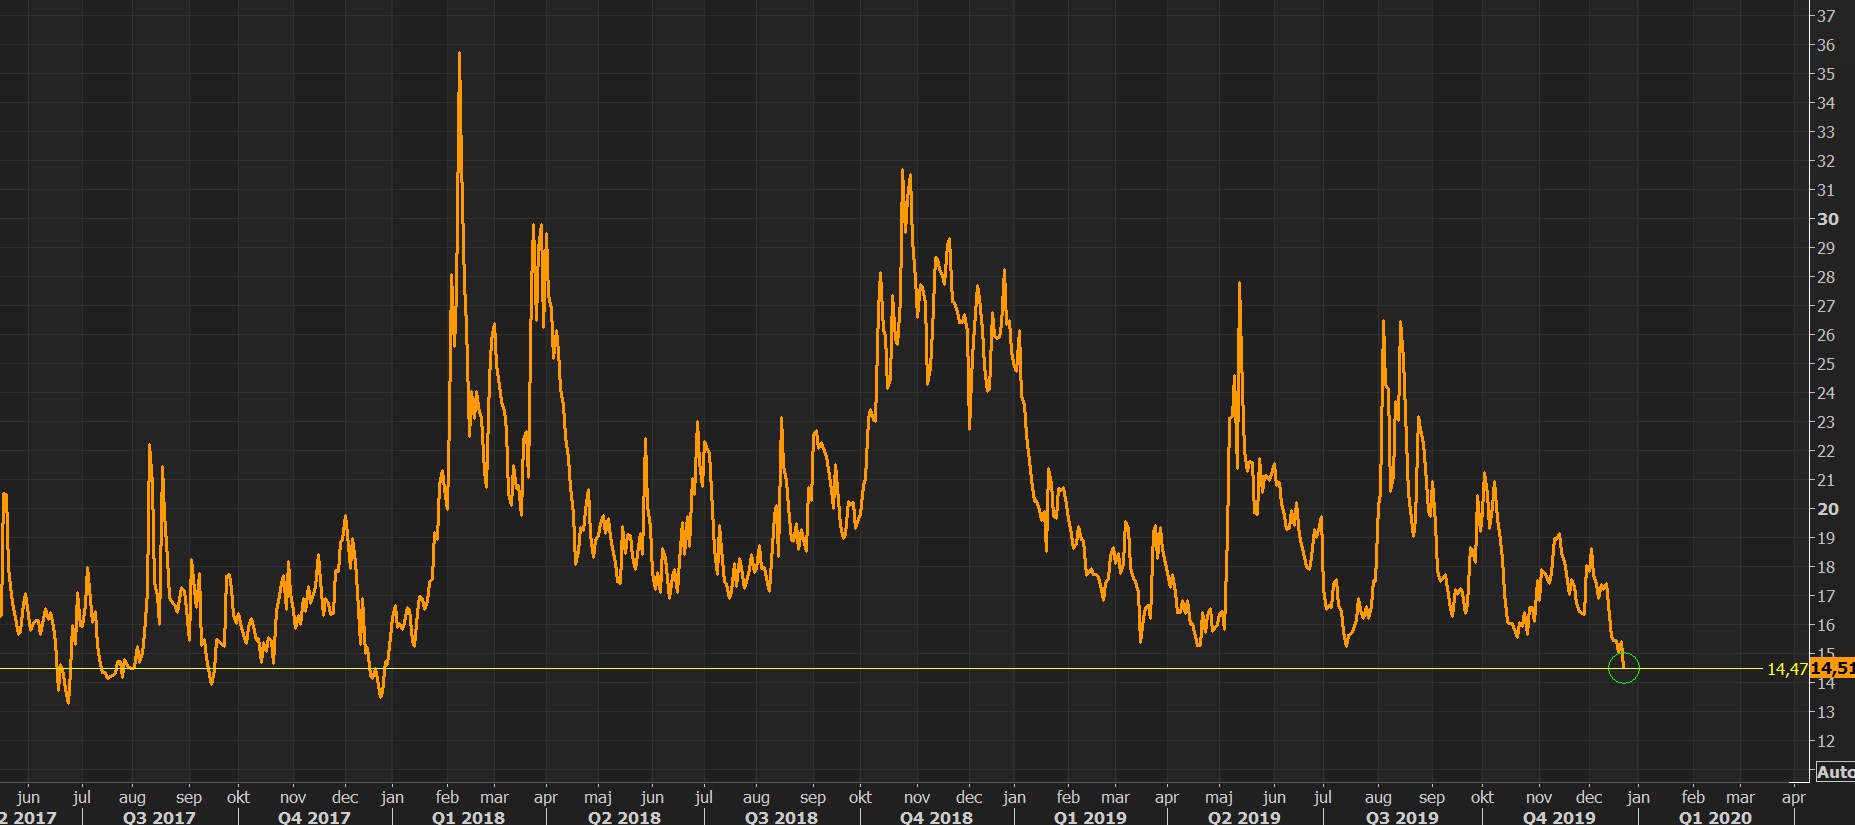
But the overbought signals for the EM rally suggest caution:
- Market Ear – Have no fear? Fed has successfully “sucked” risk premium out of many assets. Below is the Emerging markets volatility index, VXEEM, trading at levels last seen in late 2017. Don’t buy protection when you must, buy it while you can.
So what to do? Perhaps follow the simple wisdom of Lawrence McMillan of Option Strategist:
- In summary, we remain bullish in line with the indicators. However, the massive number of overbought conditions is once again worrisome, so we would not ignore sell signals, should they appear. Meanwhile, tighten trailing stops where appropriate and roll (deeply) in-the-money calls up to be at-the-money calls.
And the case for a good 2020 for stocks seems a safe bet from statistical history, a nearly perfect environment for risk and an increasing likelihood for reelection of President Trump.
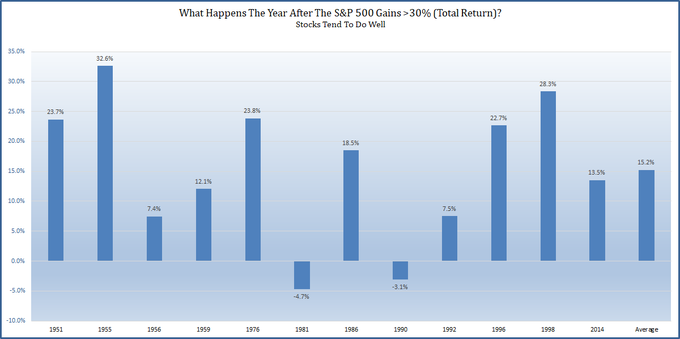
- Ryan Detrick, CMT@RyanDetrick – You might hear how stocks are up a lot and this means next year will be bad. Not necessarily. S&P 500 could be up >30% (total return) in 2019. Historically, the following year has been higher 10 of 12 times and the avg. return is 15.2%.
That is fine but where did we get that bit about increasing likelihood of Trump reelection?
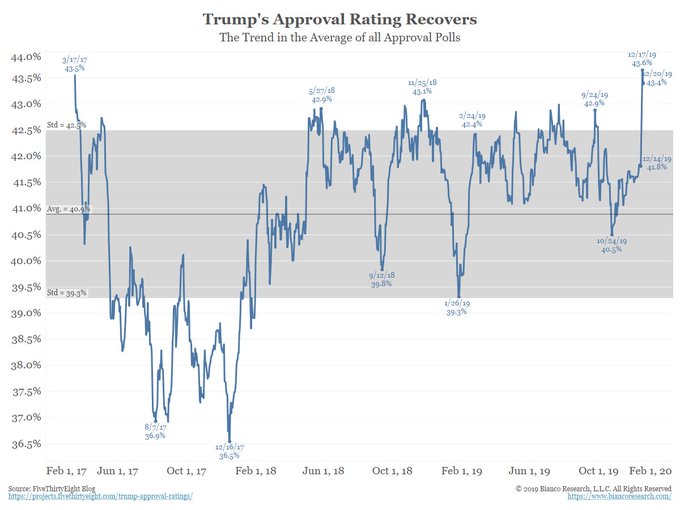
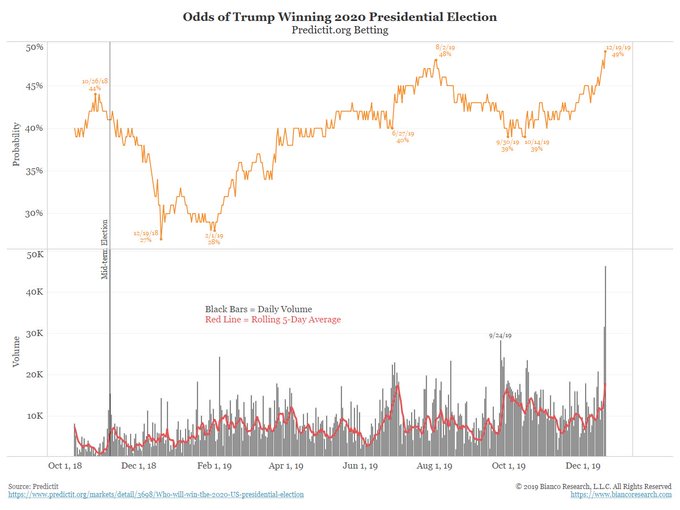
- Jim Bianco@biancoresearch – Wed night – Trump impeached Thu night – Dem debate What did these events do for the election? * A 2.5 year high in Trump’s approval rating * Betting that Trump wins hit a new all-time high on big volume Did the Dem think this would be the results of the last 48 hours?
Sorry, we forgot to address a big worry expressed on CNBC Fast Money – that the Fed is trying to shove under the rug the crisis in the Repo market. But none of them see the other side of the Fed supporting the Repo market. What other side, you ask?
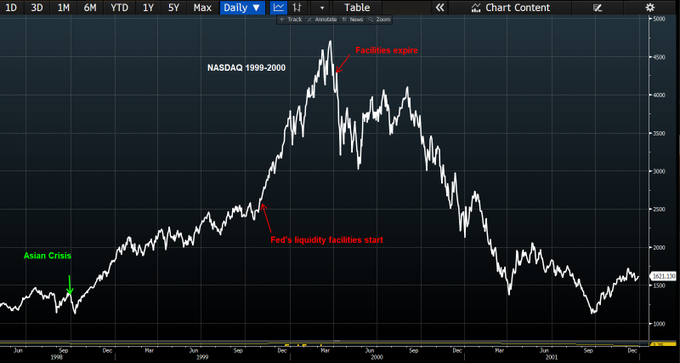
- Julian Brigden@JulianMI2 – – To help the repo market the Fed will inject approximately $500bln over the next month. But have we been here before? In 2000, because of fears related to Y2K, they announced special funding and guess where it went?
If all of the above is not enough, listen to Stanley Druckenmiller saying “for now, its all systems go” to Erik Schatzker of BTV in the first 3 minutes of their long conversation. Druckenmiller said he is long equities, long commodities (including copper but not oil), long commodity currencies and short fixed income (short the long duration Treasuries):
Later on he said it is easier for the Fed to turn from hawkish to dovish (as they did in January 2019) than turn hawkish from dovish. He doesn’t see anything that disturbs the economy or monetary policy.
That brings us to the Fed.
2. Fed & Treasury Rates
Mr. Druckenmiller’s short of long end Treasuries worked well this week with 30-year yield up 6.6 bps; 10-7 year up 8.9 bps; 5-year yield up 7.5 bps & the 2-year up 2.1%. But the 10-year yield stayed below Rick Santelli’s 1.85% level.
Druckenmiller also said interest rates are too low for today’s conditions, a comment that may be challenged by some including Jim Bianco who expects the Fed to cut rates in 2020.
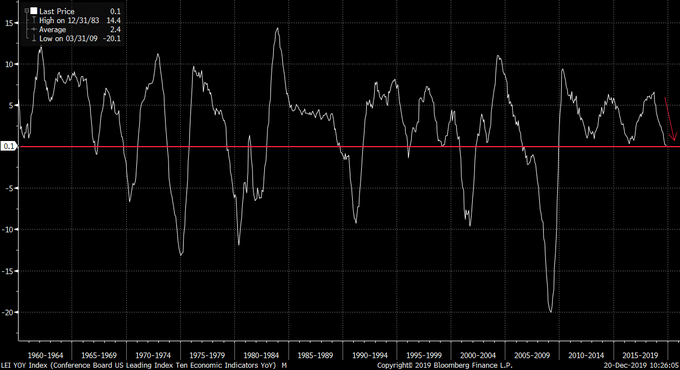
- Richard Bernstein@RBAdvisors – “Fly into the danger zone!” US Leading #Economic Indicator gives weakest reading in 10 years and flirts with #recession signal.
Sure, but isn’t the curve steepening due to rising inflation expectations?
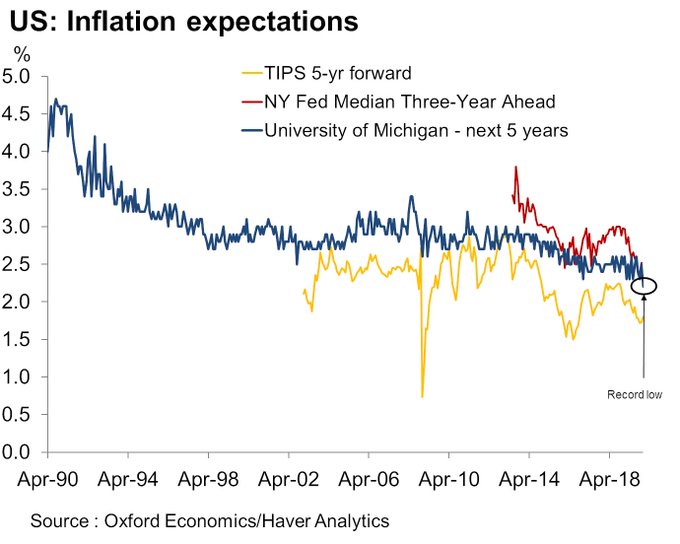
- Kathleen Bostjancic@BostjancicKathy – Amid the data deluge this morning, perhaps overlooked but important was the record low reading in the 5-year ahead consumer inflation expectations reading in UMich consumer sentiment falling to 2.2%. Despite some rebound in market-based TIPS, overall inflation expectations low
Yeah but, don’t they see “green shoots” in the global data?
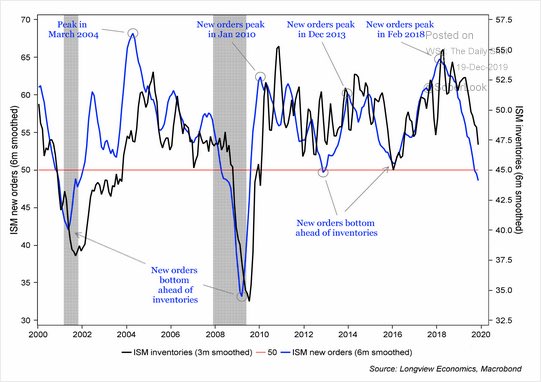
- Liz Ann Sonders@LizAnnSonders – – Destocking cycle now advanced, as ISM new orders & inventory readings approach levels reached during previous US/global growth slowdowns@LongviewEcon @SoberLook@MacrobondF
Remember the Fed has a very high bar for raising rates and a really low bar for cutting rates. If the direction in leading indicators, inflation expectations & ISM et al keeps pointing lower, the Fed may cut rates sooner than many expect.
Add to that the statistical case made by Nomura’s Charlie McElligott on CNBC Squawk Box this week, per a transcript from Market Ear:
- “That dating back to 1983, we see January as a top 3 month of the year for Ten Year US Treasury future, higher with a 70% hit rate. This is then supportive of fixed-income out of the gates and likely speaks to fading the crowd who believes that in January you’ll see UST yields rocketing higher to start 2020, which in-turn many then expect to lead to further extension of this rebalancing trade INTO cyclicals out of duration sensitives (secular growth and defensives); conversely, I think Bond proxies hold just fine and can in-fact outperform said “cyclical renaissance” in January due to this likely “passive rebalancing” phenomenon.”
He says in the clip below that he doesn’t “see bonds selling off next year” & predicts that “we will end 2020 with 10-year at 1.85% as right here“.
So his tactical 1-month reversal of December trade is to Short Energy & Banks and go long Bond Proxies & Secular growth – Defensives.
By the way, that trade fits the recommendation to buy Utilities sector from Carter Worth, resident technician at CNBC Options Action. Is there any support for McElligott’s short energy trade?
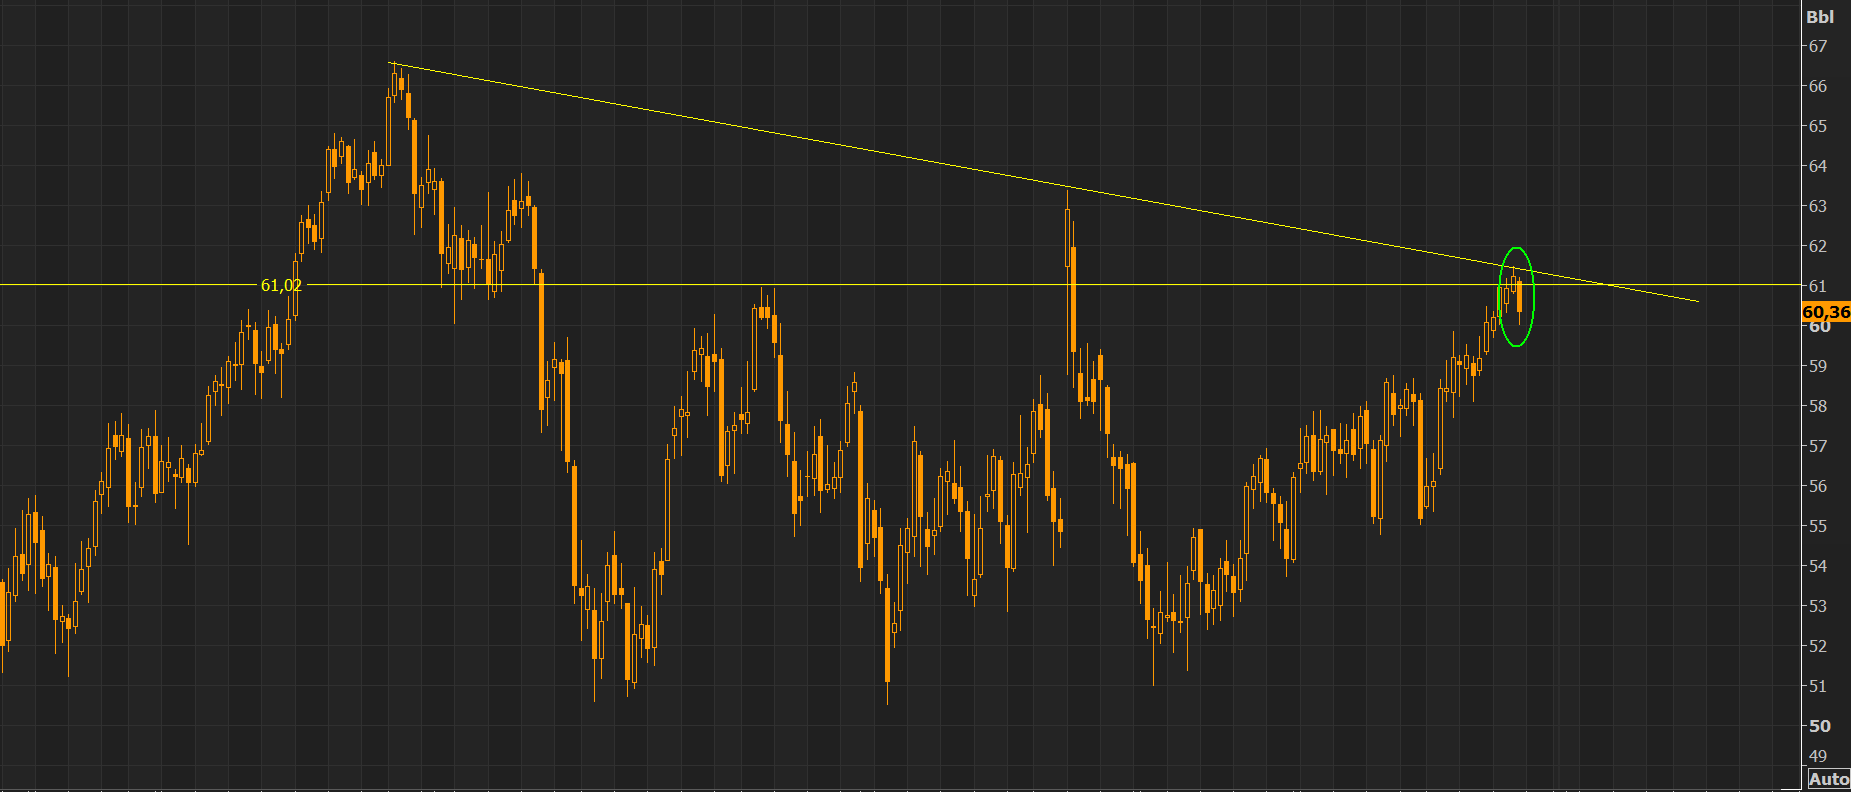
- Market Ear – Biggest negative candle in oil since that big down day in late November. Perfect reversal on huge resistance levels.
3. Investing for Next Decade from Richard Bernstein
There is no shortage of reports that talk about what to do next year. But not many talk about themes for investing for the next decade. Richard Bernstein did precisely that in his Investing for December 2029 piece. It is a well-written article with interesting charts & we urge all to read it. Below are some excerpts:
- Accordingly, here are several secular investment themes one should put in a portfolio
time capsule to be opened on December 31, 2029:
1) Inflation
2) Emerging Markets vs. Venture Capital
3) Tech becomes dreck
4) Gold
Regarding point 2 above, the article says:
- 2000 …. was the end of the Technology Bubble, but consensus remained that technology-related investments were a critical part of any growth portfolio. Emerging Markets were at the other end of investors’ emotional scale because EM had suffered a series of financial catastrophes and were accordingly unpopular. However, Emerging Markets subsequently outperformed Venture during the following decade by nearly 14 percentage points per year.
- The situation was reversed by the end of the 2000s. … by 2009/2010 Emerging Markets were considered a critical part of a portfolio. In fact, investors at that time were so enamored with Emerging Markets that many wouldn’t even consider our portfolios because those portfolios had little or no EM exposure. Technology related investments were largely unpopular because they had underperformed during the “lost decade for equities”. Venture Capital significantly outperformed EM over the subsequent decade by almost 20 percentage points per year.
About the 3rd Tech becomes Dreck point, the article explains:
- “The Technology sector has been the biggest beneficiary of globalization. No other sector has such dispersed global supply chains or broad range of consumers around the world. A significant contraction in global trade could demonstrably change the profitability and growth trajectory of the sector. … Technology is the most foreign exposed sector. A contraction in global trade could make growth targets questionable for foreign exposed technology companies…”
What about Gold?
- First, as mentioned, limiting competition through trade barriers is inflationary and gold has historically hedged inflation well.
- Second, our previous chart on trade uncertainty is one of many measures highlighting the current level of uncertainty is unprecedented, and gold has historically been a hedge against uncertainty and volatility.
- Third, gold could become a store of value in many parts of the world should the contraction in globalization become dire.
4. J.C. Parets in India
We have always thought of J.C. as a smart guy. He just proved it again to us by posting the video below AND writing “Mumbai is one of my favorite cities in the world. There is no question about it.”
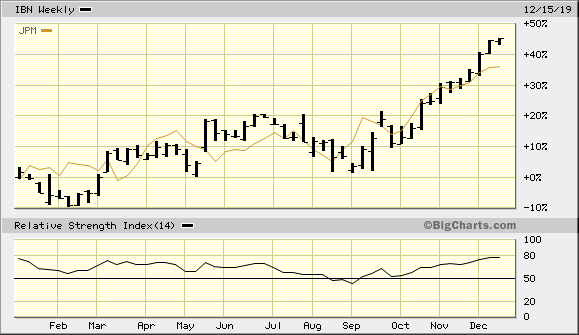
There has been nothing but negative coverage about India in the U.S. media and not any mention that, despite the credit crunch, shadow banking problems & other issues, the Indian Sensex went to a new all-time high this week. Speaking of bad loan problems & credit issues, look at the YTD weekly chart of ICICI Bank (IBN) vs. JPM.
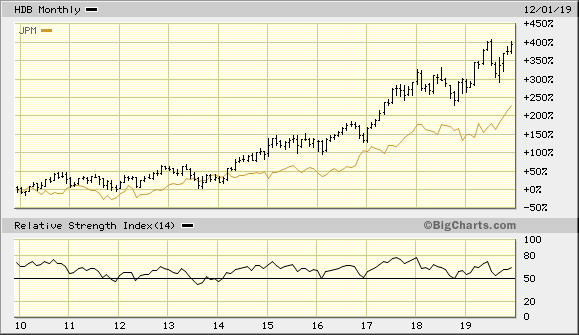
HDFC Bank (HDB) is a larger & better bank while ICICI (IBN) trades with a higher beta. Both should be core holdings we think in any diversified global portfolio. We all know the last decade has been an All-American decade of outperformance over EM. But look at the 10-year monthly chart of HDB vs. JPM.
We really liked the video of Parets’ trip to Mumbai. But we would also have liked some charts & recommendations about the Indian stock market for 2020.
Send your feedback to editor@macroviewpoints.com Or @MacroViewpoints on Twitter
